
An e-commerce product insights dashboard is a powerful tool that provides a comprehensive view of an online store's key metrics and performance indicators. It allows businesses to track sales, revenue, and inventory levels, analyze customer behavior and preferences, and make data- driven decisions to optimize product offerings and improve customer satisfaction. With easy-to-use visualizations and customizable filters, e-commerce product insights dashboards provide businesses with actionable insights to boost sales and profitability.
This fully customizable dashboard wireframe helps in tracking multiple aspects for an e-commerce business. To accommodate for all them, it is split into four different pages, with one of those pages presenting a summary of the entire dashboard.
Screen 1: Product Performance Overview
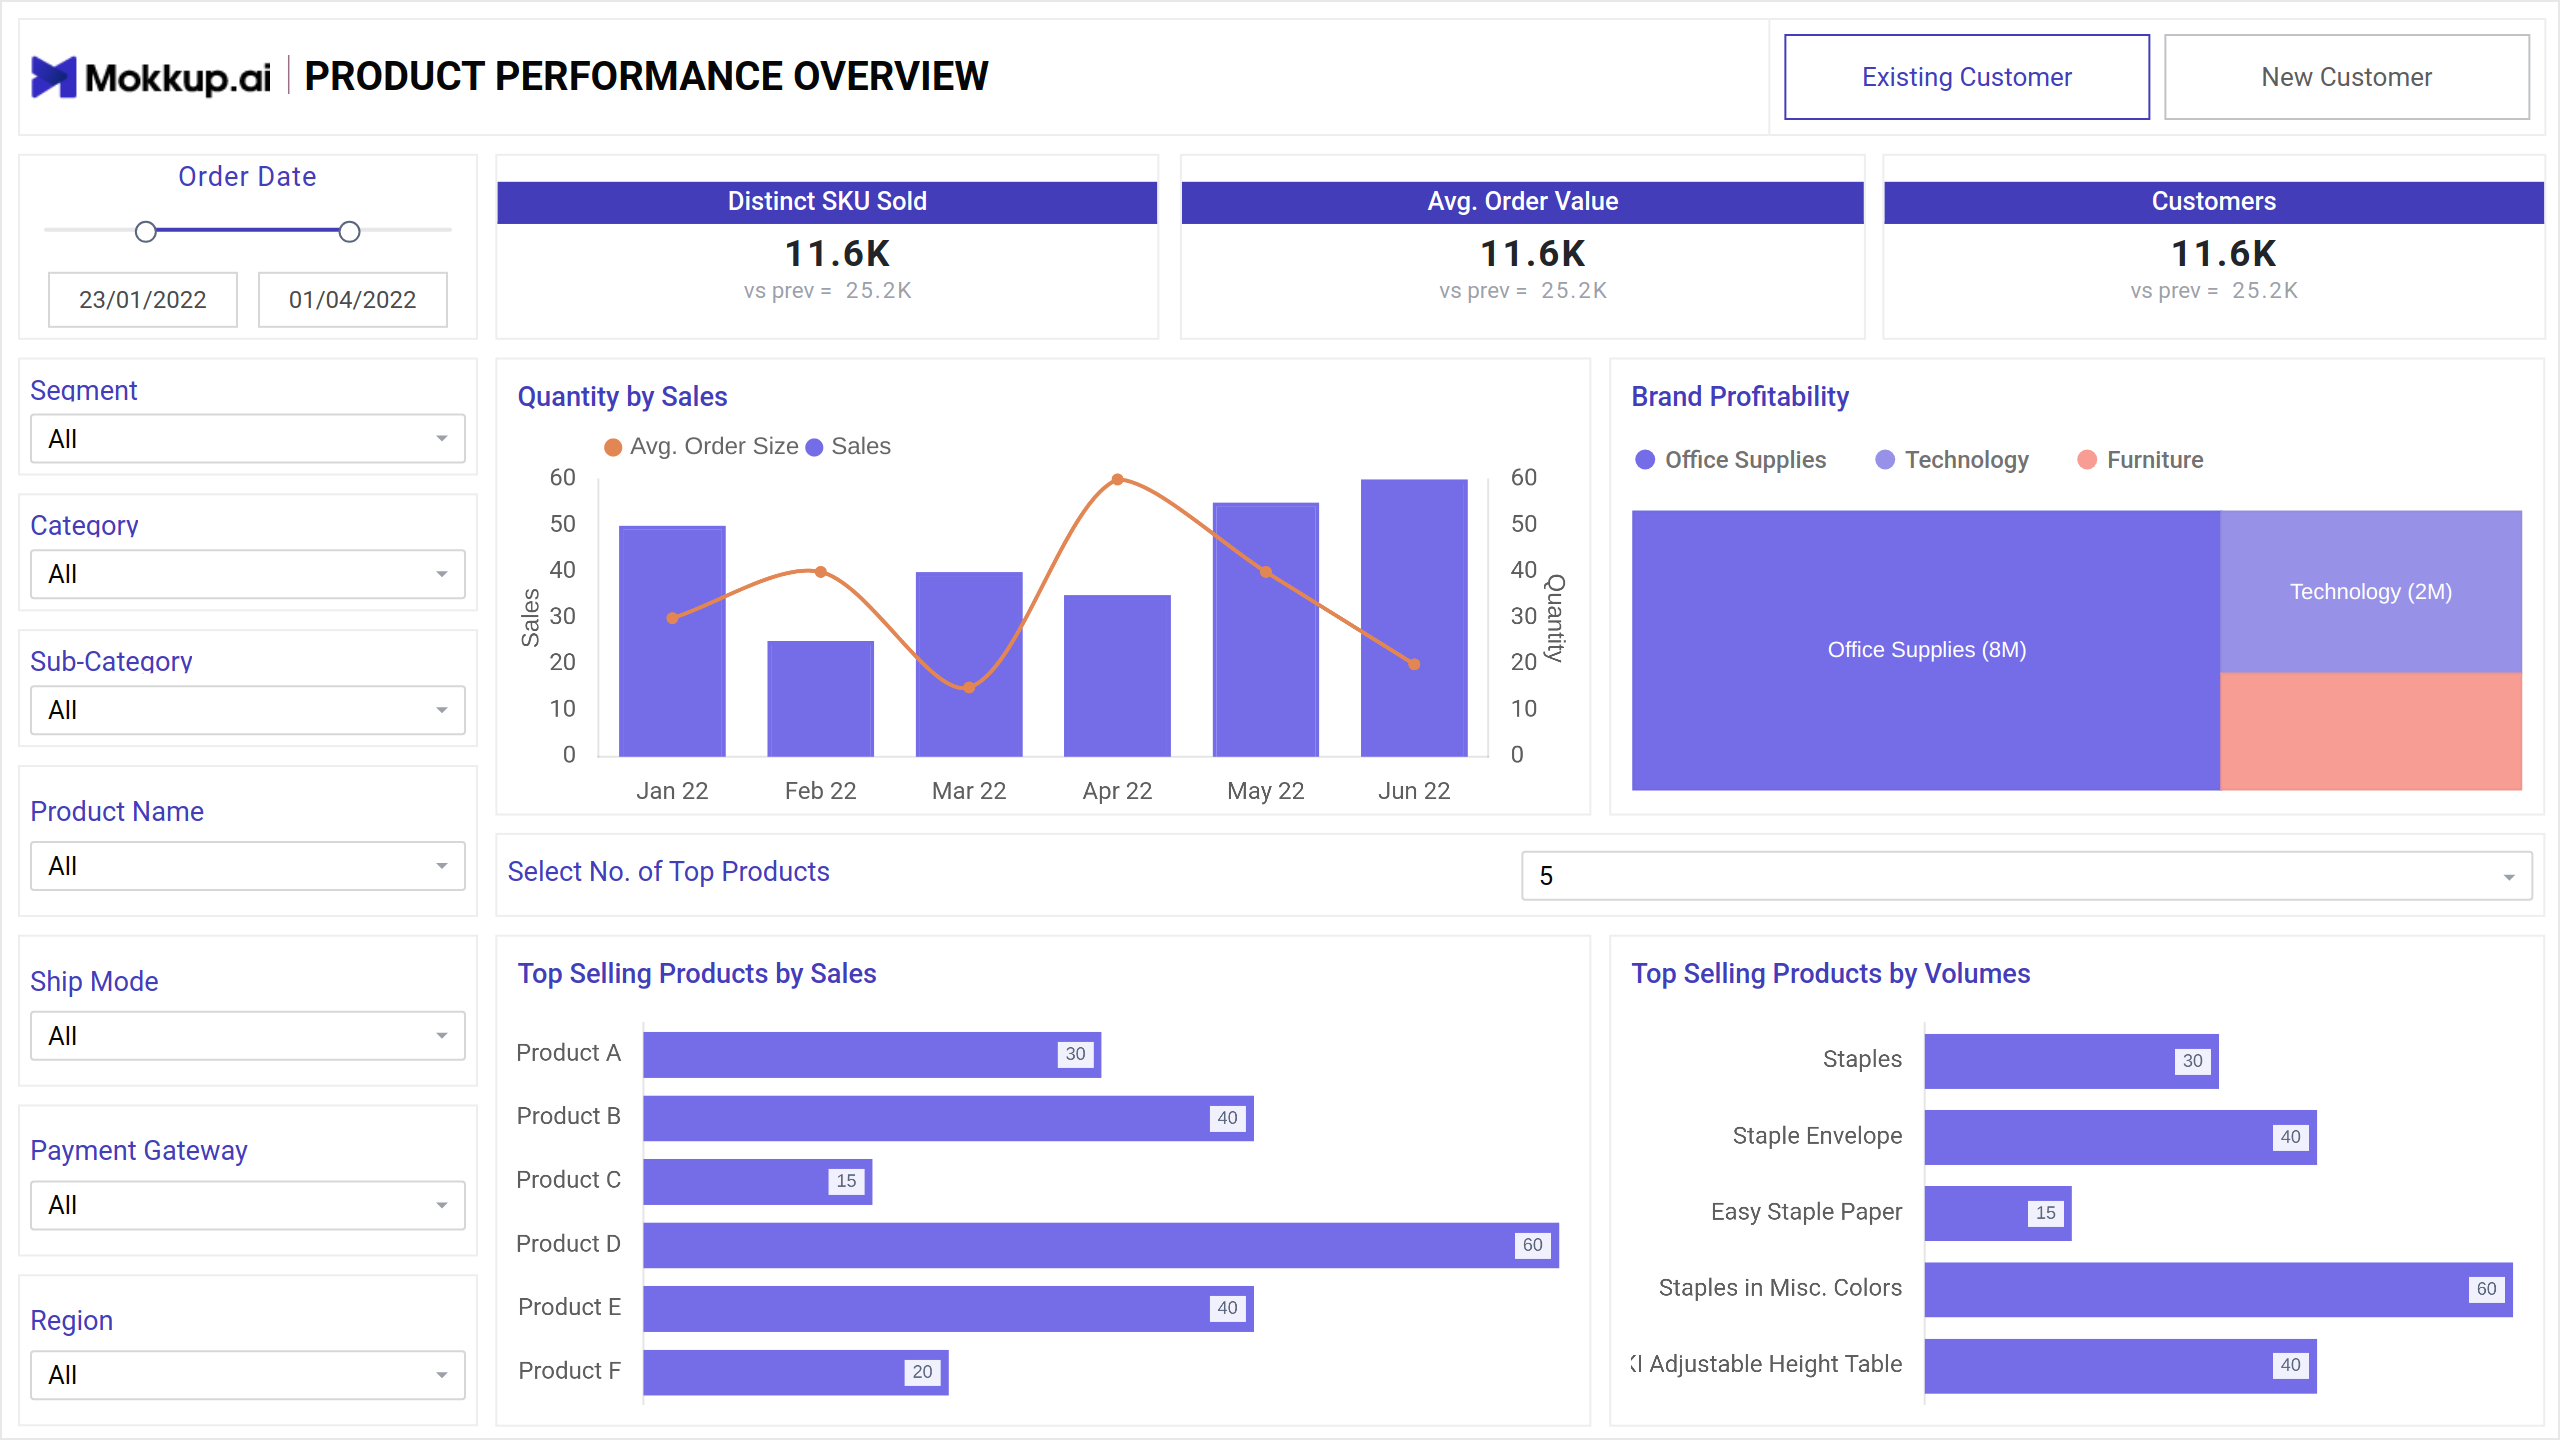
Within the Product Insights Dashboard, the Product Performance Overview screen offers a comprehensive analysis including order date, segment, category, sub-category, product name, ship mode, payment gateway, and region. Additionally, it provides valuable metrics such as distinct SKU sold, average order value, customer count, sales quantity, brand profitability, and allows selection of top products based on sales and volume.
Key Terms to consider:
- Order Date: Essential for tracking temporal patterns and analyzing sales trends over time.
- Segment, Category, Sub-category, Product Name: Crucial for categorizing and organizing products, enabling targeted analysis and comparison.
- Ship Mode: Provides insights into shipping preferences and logistics strategies, impacting delivery timelines and costs.
- Payment Gateway: Indicates preferred payment methods and platforms, influencing transaction processes and customer convenience.
- Region: Allows for regional analysis, identifying geographical preferences and market trends.
- Distinct SKU Sold: Measures product variety and popularity, informing inventory management and marketing strategies.
- Average Order Value: Reflects customer spending habits and purchasing power, guiding pricing and promotional efforts.
- Customers: Tracks customer engagement and retention rates, facilitating customer-centric strategies and personalized marketing.
- Quantity by Sales: Quantifies product demand and sales performance, aiding in inventory forecasting and production planning.
- Brand Profitability: Evaluates the profitability of different brands, guiding brand management and marketing investments.
- Select Number of Top Products: Enables focus on high-performing products, optimizing resource allocation and marketing strategies.
- Top Selling Products by Sales and Volume: Identifies best-selling products based on revenue and quantity sold, informing inventory management and marketing prioritization.
Screen 2: Product Analysis Report
The Product Analysis Report screen showcases monthly revenue, costs, and margins, alongside a trend analysis of monthly profits. It also highlights top-performing products by profitability, tracks revenue against targets, and includes detailed order information such as date, segment, category, sub-category, product name, and region.
Key Terms to consider:
- Monthly Revenue, Cost & Margin: Provides insights into financial performance, including income, expenses, and profitability on a monthly basis.
- Monthly Profit Trend: Illustrates the trajectory of profit over time, aiding in identifying patterns and forecasting future financial performance.
- Top Products by Profit: Identifies the most lucrative products in terms of profitability, guiding inventory management and marketing strategies.
- Revenue vs Target: Compares actual revenue against set targets, facilitating performance evaluation and goal tracking.
Screen 3: Regional Sales Analysis
This screen offers a comprehensive regional sales analysis, presenting top-performing regions by sales alongside order dates for enhanced insight.
Key Terms to consider:
- Regional Sales Analysis: Provides a detailed examination of sales performance across different geographic areas, offering insights into regional market trends.
- Top Regions by Sales: Identifies the highest-performing regions in terms of sales volume or revenue, guiding strategic decision-making and resource allocation.
- Order Date: Allows for temporal analysis of sales data, enabling the identification of trends and seasonality in regional sales patterns.
Dashboard Template Insights
This dashboard offers a comprehensive view of key metrics, enabling businesses to monitor sales, revenue, and inventory levels. With customizable filters and user-friendly visualizations, it provides actionable insights to optimize product offerings and improve customer satisfaction. Structured into four pages, it includes a Product Performance Overview, Product Analysis Report, and Regional Sales Analysis, each offering detailed insights into different aspects of business performance.
Conclusion
An e-commerce product insights dashboard is an essential tool for online retailers to make informed decisions regarding their product offerings. By providing data on customer behavior, sales trends, and inventory levels, this dashboard can help businesses optimize their product strategy, improve customer satisfaction, and ultimately drive revenue growth. With the increasing importance of e-commerce in today's digital landscape, investing in a product insights dashboard can give businesses a competitive edge and position them for long-term success.