
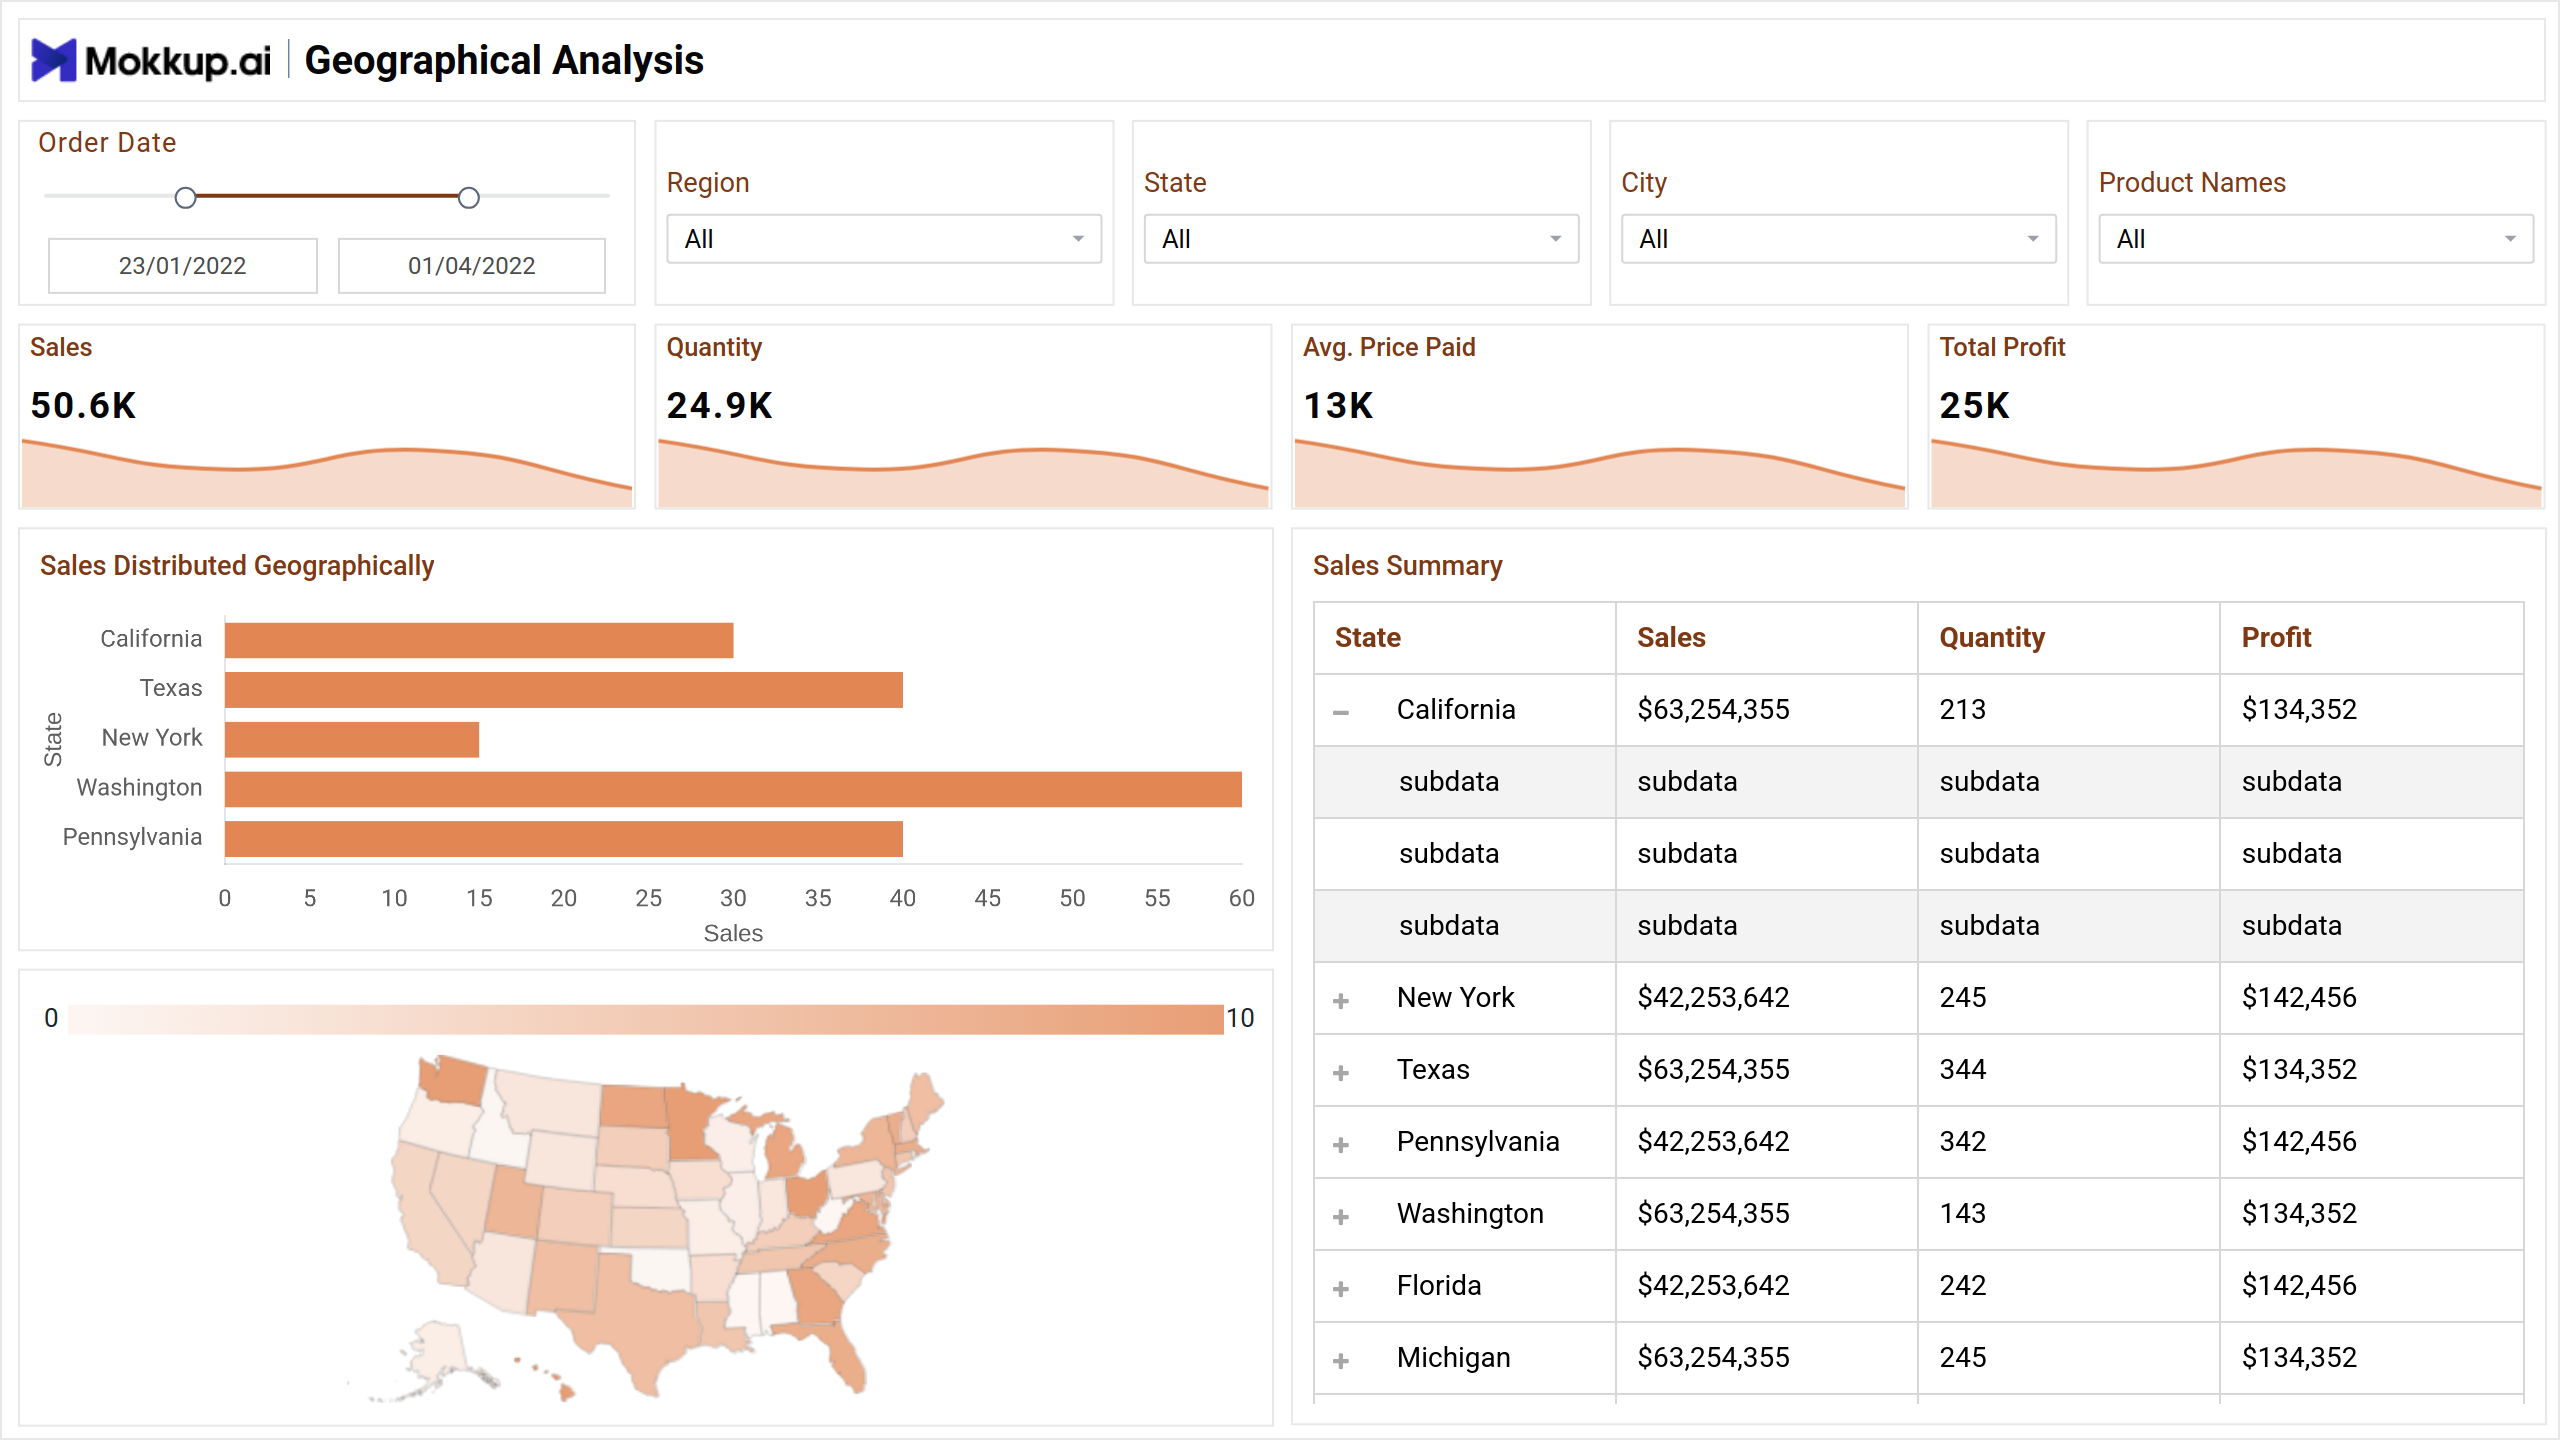
The Geographic Analysis Dashboard template unlocks the global potential of e-commerce businesses to expand their customer base beyond physical store limitations. By understanding customer locations, profitable regions, and product preferences, businesses can plan effectively and gain a competitive edge.
Summary Overview
Optimize your e-commerce strategy with the Geographic Analysis dashboard, providing valuable insights into sales and distribution.
Key Terms to Know:
- Sales, Quantity, Average Price Paid, Total Profit - Core metrics for evaluating overall sales performance.
- Sales Distributed Geographically - Insights into the geographic distribution of sales, helping identify target markets.
- Sales Summary - A concise overview of key sales metrics, facilitating quick decision-making and strategy adjustments.
Detailed Analysis
This customizable sales dashboard helps allocate marketing resources wisely by considering regional variations in marketing goals and costs and identifying the most profitable regions.
Key Terms to Know:
- Lost Sales: Quantifies revenue loss, offering a snapshot of unfulfilled sales potential.
- Order Date: Analyzes sales process based on the timing of customer orders.
- Product Names: Identifies top-performing and underperforming products in the e-commerce platform.
- Region: Breaks down sales data geographically, enabling targeted strategies for specific areas.
- Cancelled Orders: Examines reasons for order cancellations, aiding in reducing abandonment rates.
Refunds & Returns
From assisting in inventory management to understanding product preferences influenced by factors like climate and cultural values, this screen focuses on regional sales trends and top-performing cities and products.
Key Terms to Know:
- Regional Sales Distribution - Insights into the geographic spread of sales, aiding in targeted marketing strategies.
- Top Cities by Sales - Identifying key cities contributing significantly to sales, allowing for strategic focus.
- Top Products by Sales - Highlighting the best-performing products, guiding inventory management and marketing efforts.
- Regional Split - Providing a detailed breakdown of sales across different regions, aiding in regional strategy development.
Dashboard Template Insights
- Simplifies goal achievement by: Determining system efficiency, Understanding regional e-commerce sales trends, Establishing region-specific marketing, pricing strategies, Monitoring product purchase patterns, Assessing customer satisfaction.
- Informs pricing and marketing decisions through AOV (Average Order Value) comparisons.
- Helps apply successful strategies by identifying top revenue-generating cities in similar regions.
- Tracks refund and return rates to highlight areas needing improvement in order handling.
Conclusion
The Geographic Analysis Dashboard gives companies the ability to strategize locally, optimize pricing, strengthen marketing initiatives, and increase customer satisfaction. It uses the global reach of e-commerce to help companies succeed in the world of E-commerce.