Key Performance Indicators (KPIs) serve as benchmarks that compare a company's performance against predefined goals, objectives, or industry norms. They cover various aspects, from financial metrics like net profit and revenue to operational measures such as the current ratio, which reflects liquidity and cash availability.
Customer-centric KPIs provide critical insights into client relationships by revolving around per-customer efficiency, satisfaction levels, and retention rates. Process-oriented KPIs, on the other hand, focus on tracking and assessing operational effectiveness throughout the company.
To systematically measure, manage, and evaluate these KPIs, firms typically use analytics dashboards and powerful reporting tools. This allows for data-driven decision-making and continuous strategy and performance improvements.
Selecting crucial KPIs for your business is essential. Dashboard wireframes simplify this by highlighting which KPIs drive desired outcomes. Tools like Mokkup.ai enable customizing dashboard wireframes, ensuring effective data visualization tailored to your business needs.
Table of Contents
- What is a Key Performance Indicator (KPI)?
- Understanding KPIs in Business
- What are the Categories of KPIs?
- Different Types of KPIs in Business
- Advantages & Limitations of KPIs
What is a Key Performance Indicator (KPI)?
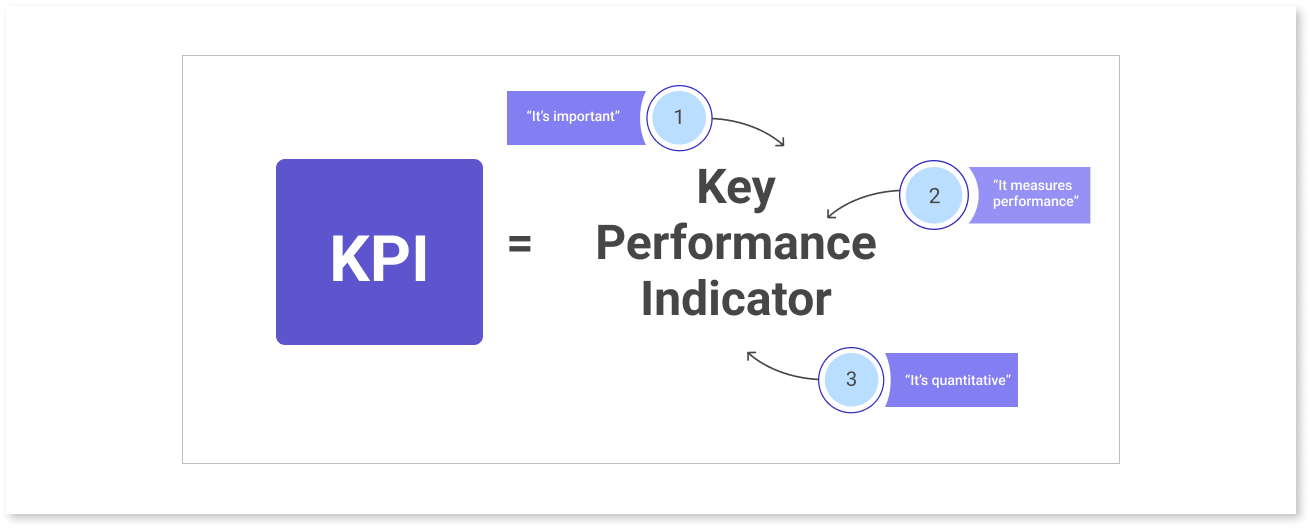
Key performance indicators (KPIs) refer to a set of quantifiable measurements used to assess the overall long-term performance of a business. KPIs in particular assist in identifying the strategic, financial, and operational accomplishments of a business, particularly in relation to other companies operating in the same industry.
A good KPI is specific, measurable, aligned with objectives, and provides actionable insights for informed decision-making.
Comparing these KPIs with industry peers or standards allows for a more insightful analysis, and helps in understanding, strengths, weaknesses, and areas for improvement. Through the efficient use of KPIs, organizations can optimize their overall performance and competitiveness within their sector by making well-informed decisions, achieving realistic business goals, and adapting strategies.
Assume for a moment that you are an artist with a monthly target of producing and selling a specific number of paintings. Your key performance indicator would be the quantity of paintings you hope to sell. For example, your target could be to sell ten paintings in a given month. Your KPI is still hitting that goal whether you sell them all at once or in equal portions over the course of the weeks.
If you sell five paintings by the second week, you will have met half of your KPI. It acts as a visible benchmark that enables you to monitor your progress and make necessary corrections. If, by the third week, you've sold eight paintings, you know you're almost there and can modify your plan of action to make sure you reach your target.
Understanding KPIs in Business
Key Performance Indicators (KPIs) or Key Success Indicators (KSIs) vary amongst companies and industries based on their unique performance criteria. For instance, a software company aiming for quick industry growth might prioritize year-over-year (YOY) revenue growth as its primary KPI. Similarly, a retail chain might focus more on same-store sales as its key metric for assessing growth.
KPIs are all about collecting, storing, and refining data, which could encompass financial or nonfinancial information across various company departments. The ultimate goal of kpi dashboards is to present results clearly and concisely, empowering management to make more informed and strategic decisions and achieve organizational goals.

What are the Categories of KPIs?
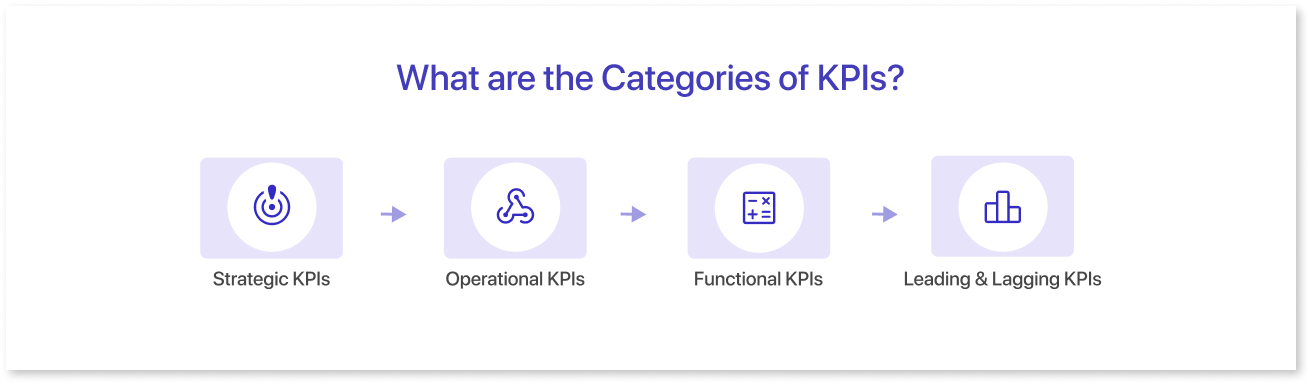
The majority of KPIs can be divided into four groups, each with its own users, time periods, and functions.
1. Strategic KPIs:
Strategic KPIs are high-level metrics offering a broad overview of a company's performance without getting into detailed specifics. Typically used by executives, these KPIs provide a snapshot of how well the company is doing in certain areas.
Examples such as return on investment, profit margin, and total company revenue provide insights into the overall health and success of the business without getting into the nitty-gritty details. They help leadership gauge the company's general direction and performance at a glance.
2. Operational KPIs:
Operational KPIs focus on shorter time frames, usually assessing performance over shorter periods like month-to-month or even day-to-day. They explore specific processes, segments, or geographical areas within a company. These KPIs are especially valuable for managing staff as they provide granular insights into how different elements of the business are performing.
Operational KPIs often derive from questions raised by analyzing strategic KPIs. For example, if high-level revenue metrics indicate a decline, operational KPIs can help pinpoint the issue by examining specific product lines or segments that might be struggling. This level of detail enables management to identify and address problems more effectively, contributing to overall strategic goals.
3. Functional KPIs:
Functional KPIs focus on specific departments or functions within a company, offering insights tailored to the needs and goals of the particular areas. For example, the finance department tracks the number of new vendors registered in their accounting system monthly, while the marketing team measures the click-through rates of their email campaigns.
Although these KPIs can be used for operational or strategic reasons, their intended users or departments will benefit from them the most. They provide departments with the ability to measure their performance in relation to predetermined goals and make well-informed decisions to enhance their specific roles within the broader organizational structure.
4. Leading & Lagging KPIs:
Leading and lagging KPIs indicate if the data predicts future trends or reflects past performance. Take the example of overtime hours worked as a leading KPI indicating potential issues like a decline in manufacturing quality. On the other hand, profit margins are considered as lagging indicators of prior achievement because they are a reflection of past operations.
Different Types of KPIs in Business
Let's delve into the different types of key performance indicators (KPIs) in business.
1. Financial Metrics & KPIs:
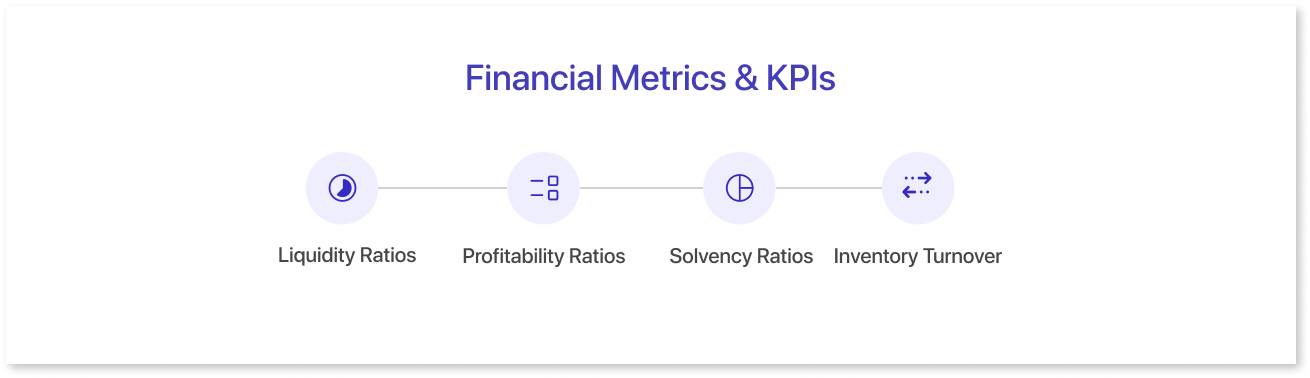
Financial metrics are drawn from a company’s financial statements. However, internal management can find it more useful to analyze various numbers that are more specific to analyzing the problems or aspects of the company that management wants to analyze.
Financial KPIs include:
- Liquidity Ratios: Current ratios, or liquidity ratios, are calculated by dividing current assets by current liabilities. Based on the company's current short-term assets, these KPIs assess how successfully the organization will handle its short-term debt commitments.
- Profitability Ratios: often known as net profit margin, are a type of key performance indicators that indicate how successfully a business is producing profit while controlling expenses.
- Solvency Ratios: or total debt to total assets ratios are KPIs that assess a company's ability to repay long-term debt, which is a key indicator of its long-term financial stability.
- Inventory Turnover or Turnover Ratios: These KPIs assess how fast an organization can complete a particular activity. Inventory turnover, for instance, gauges how rapidly a business can move an item from inventory to a sale. Businesses aim to boost turnover in order to expedite the churn of cash spent, which is then recovered through income.
2. Customer Metrics & KPIs:
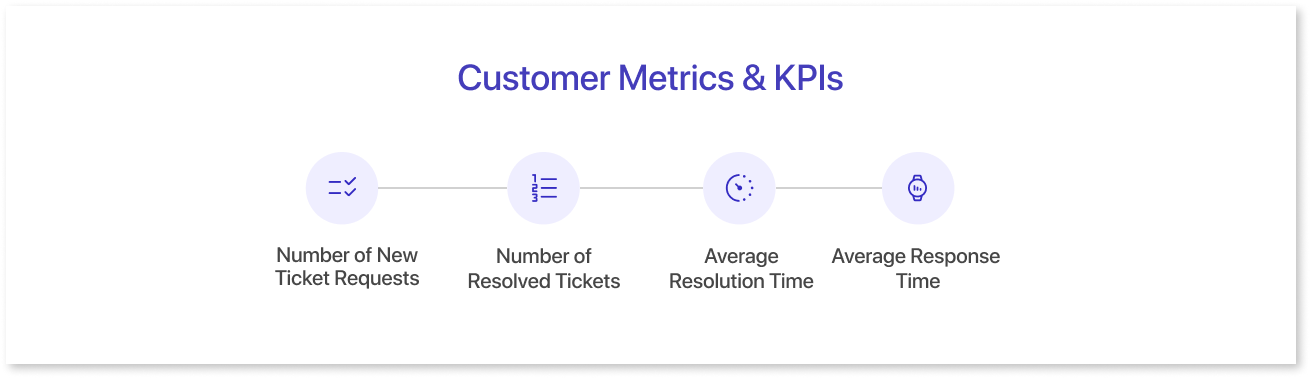
Customer-focused KPIs revolve around measuring per-customer efficiency, satisfaction, and retention rates. These metrics are invaluable for customer service teams as they offer vital insights into the quality of service customers have been experiencing.
Customer-centric metrics include the following:
- Number of New Ticket Requests: This KPI tracks the number of new and open issues customers are having in addition to counting customer service requests.
- Number of Resolved Tickets: It keeps a count of the number of customer issues that have been resolved and helps in monitoring customer satisfaction.
- Average Resolution Time: tracks the average amount of time needed to resolve an issue.
- Average Response Time: tracks the average amount of time a customer service agent takes to connect with a customer.
3. Process Performance KPIs:

The goal of process performance metrics is to track and evaluate the organization's overall operational performance. These KPIs examine task performance and identify process, quality, and performance problems.
Process performance metrics include:
- Production Efficiency: This KPI is used to measure the production time for each stage divided by the total processing time.
- Total Cycle Time: measures the total amount of time to finish a process from beginning to end.
- Error Rate: reflects the total number of errors divided by the number of units produced.
4. Marketing KPIs:

The goal of marketing KPIs is to improve comprehension of the effectiveness of promotional and marketing efforts. These metrics frequently track the rate at which potential clients respond to a certain marketing channel by measuring conversion rates.
Marketing metrics include:
- Website Traffic: This KPI monitors the number of users who access particular pages on a business's website. With the use of this KPI, management can gain a better understanding of whether web traffic is being directed toward potential sales channels and whether customers are not being funneled appropriately.
- Conversion Rates: This KPI focuses on targeted marketing campaigns that request specific behaviors from consumers. For example, encouraging customers to check out a certain sale before it ends.
- Click-Through Rates: This Key Performance Indicator(KPI) counts the number of particular clicks made on email distributions. Certain applications, for instance, might keep track of the number of clients who clicked on a link, opened an email distribution, and completed a purchase.
5. Sales KPIs:

A company's main objective is to make money through sales. While financial KPIs are frequently used to assess income, sales KPIs use nonfinancial data to gain a deeper understanding of the sales process.
Sales KPI examples include:
- Customer Lifetime Value (CLV): The total amount of money a customer will likely spend on your products throughout the course of the business relationship is represented by this KPI.
- Customer Acquisition Cost (CAC): The entire cost of sales and marketing needed to acquire a new client is represented by this KPI. Businesses can assess the success of their client acquisition campaigns by comparing CAC to CLV.
- Average Conversion Time: This KPI calculates how long it takes to get a signed contract to conduct business after reaching out to a potential customer for the first time.
6. Human Resources and Staffing KPIs:

Companies could also find it useful to examine KPIs that are unique to their workforce. A business may already have an extensive amount of data about its employees, ranging from retention to satisfaction to turnover.
KPIs related to staffing or human resources include:
- Absenteeism Rate: It counts the number of dates per year or a specific period of time when employees are calling in sick or missing shifts.
- Employee Satisfaction: To measure this KPI and find out how employees feel about different areas of the organization, a company-wide survey is often needed.
- Employee Turnover Rate: This Key Performance Indicator calculates the rate at which workers are quitting their jobs.
Advantages & Limitations of KPIs
KPIs serve as a link between goals and real business operations. An organization may create goals, but those plans serve little to no purpose if it is unable to monitor progress toward those objectives. Alternatively, KPIs let businesses define goals and track their progress toward them.
On the other hand, working with KPIs has various drawbacks that should be taken into account. KPIs could need a lengthy time period to produce data that is meaningful.
For KPIs to be effective, they must be closely monitored and continuously tracked. There is no need for a KPI report that is created but never examined. Furthermore, KPIs that are not regularly checked for logic and accuracy do not promote effective decision-making.
|
Pros |
Cons |
|
Informs management about the company’s performance. |
Data collection takes a longer period of time. |
|
Provides insight on employee performance. |
Requires constant monitoring to acquire results. |
|
Motivates employees to meet targets. |
Ignore broader strategies. |
|
Helps to set goals and measure progress. |
May demotivate workers if KPI targets are irrational. |
Conclusion
Key Performance Indicators (KPIs) are an essential instrument for assessing and overseeing an organization's performance in a variety of areas. Managers well-versed in KPIs can employ these useful metrics to strategically guide the organization toward sustained long-term success.
Additionally, platforms like Mokkup.ai, a dashboard wireframing tool, provide valuable support in creating wireframes and making informed decisions about selecting and implementing the most relevant KPIs for effective business management.
Frequently Asked Questions
Marketing tracks lead generation and ROI, Sales focuses on revenue and conversions, HR monitors retention and engagement, while Finance measures profitability and cash flow.
Each department should focus on 5–7 key KPIs that directly reflect its strategic priorities.
KPIs measure progress toward strategic goals, whereas metrics track general performance data that lacks a direct link to objectives.
Most teams review KPIs on a monthly basis, with quarterly evaluations for more in-depth performance analysis.
An effective KPI is specific, measurable, achievable, relevant, and time-bound (SMART).
Ensure each KPI supports company-wide objectives and contributes to shared outcomes across teams.
Leading KPIs forecast future performance (like pipeline growth), while lagging KPIs measure results already achieved (like quarterly revenue).
Compare KPI results against predefined targets and assess their impact on overall business outcomes.
Prompt it. Wireframe it with Mokkup.ai.
