What is a Wind Power Plant Workplace Safety & Regulatory Compliance Dashboard?
A Wind Power Plant Workplace Safety & Regulatory Compliance Dashboard template is a data-driven monitoring system used by electric power utilities to track workplace safety performance and regulatory adherence across wind energy operations. It consolidates safety, incident, training, and compliance data from multiple sources into a single, interactive view. The dashboard enables safety leaders, plant managers, and compliance teams to monitor key health, safety, and environmental (HSE) metrics.
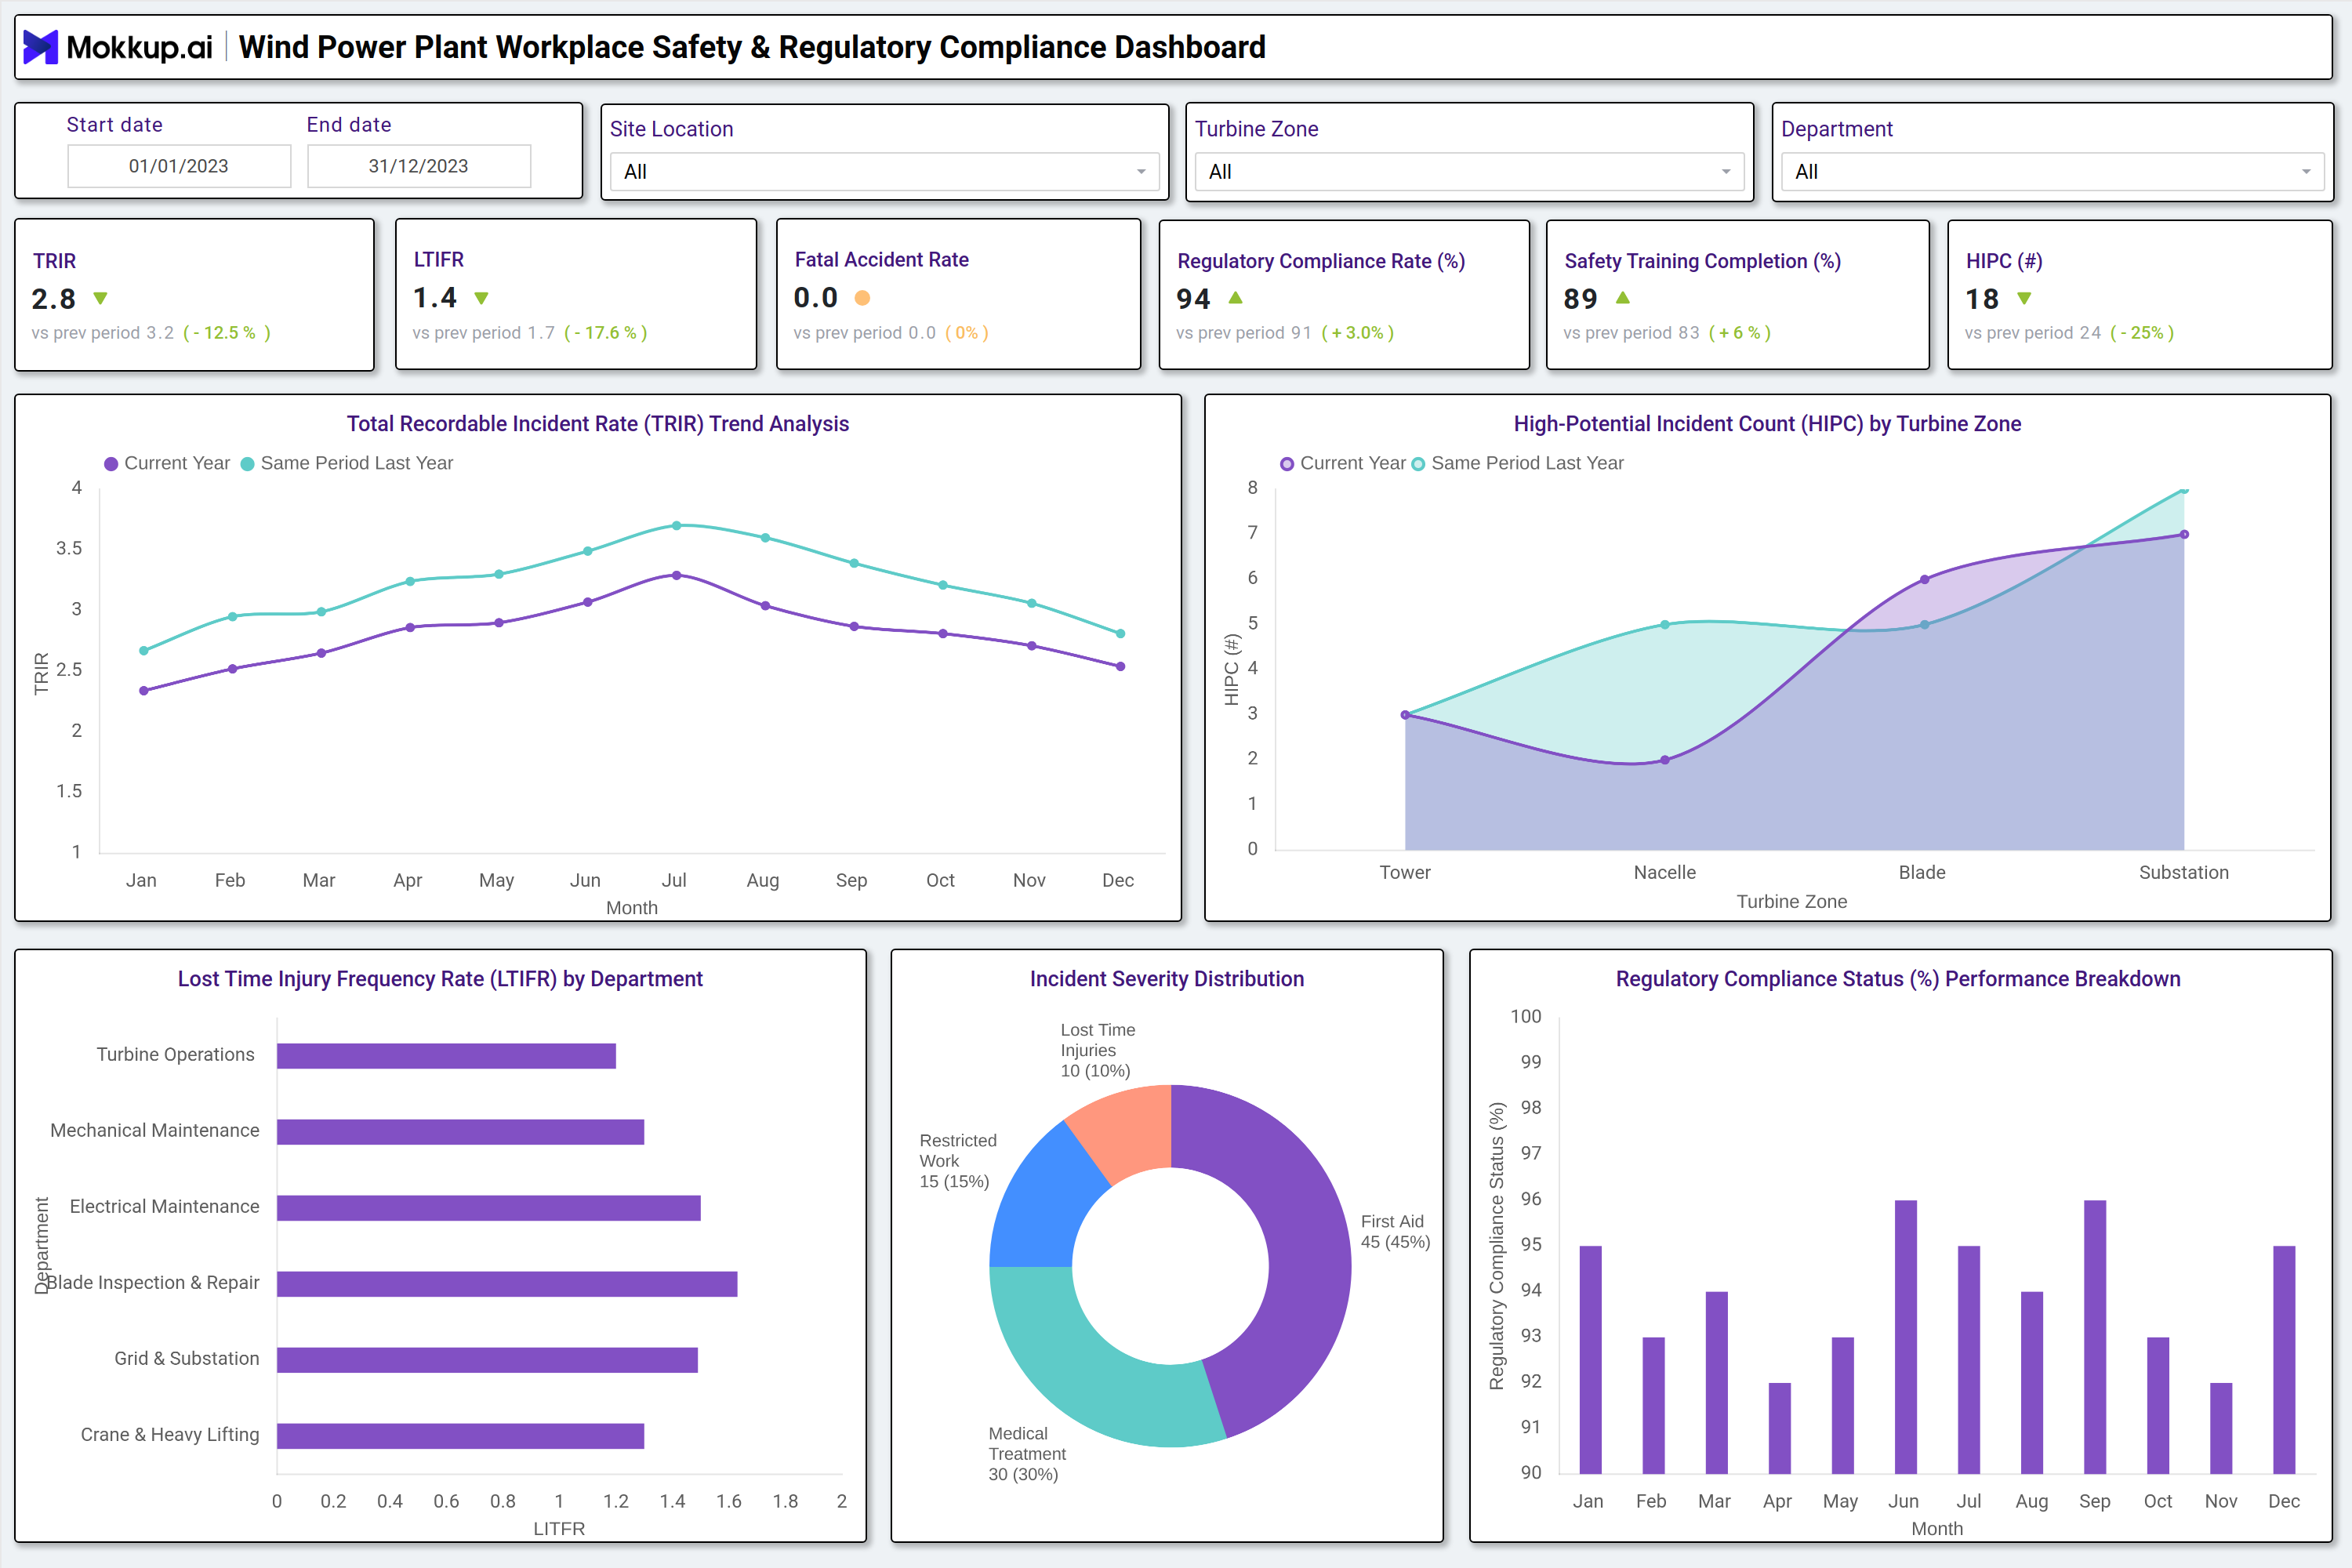
This dashboard wireframe supports both operational and regulatory objectives by tracking key indicators, including Total Recordable Incident Rate (TRIR), Lost Time Injury Frequency Rate (LTIFR), fatal accident rate, high-potential incidents, safety training completion, and regulatory compliance percentage. By providing visibility into safety risks across turbine zones, departments, and time periods, the dashboard enables proactive safety management. It ensures compliance with industry standards, statutory regulations, and internal safety policies.
How to Create a Wind Power Plant Workplace Safety & Regulatory Compliance Dashboard
You don’t need to build your report from scratch; just start with a ready-to-use Wind Power Plant Workplace Safety & Regulatory Compliance dashboard template from Mokkup. Add in your data and export it however you like. Here’s how to do it:
1. Create or Log in to Your Mokkup Account
Start by signing up on Mokkup.ai using your email. If you already have an account, just log in, and you’ll be good to go.
2. Choose and Customize Your Dashboard Template
Find the Wind Power Plant Workplace Safety & Regulatory Compliance Dashboard template in the Templates section. Use the drag and drop editor to adjust KPIs, edit filters, or add elements based on your data.
3. Export to Your BI Tool
Once your dashboard wireframe is ready, use the BI Tool Export feature to send it directly to Power BI or Tableau for further analysis and enhancements. You can also download the dashboard as a PDF, PNG, or JPEG, embed it on a platform, or invite your team to collaborate.
Note: This is a Pro template. You’ll need a Pro subscription on Mokkup to use and customize this dashboard wireframe. Upgrade anytime to unlock full access.
Wind Power Plant Workplace Safety & Regulatory Compliance Dashboard Example
A Wind Power Plant Workplace Safety & Regulatory Compliance Dashboard typically begins with global filters for date range, site location, turbine zone, and department. These filters allow users to analyze safety performance across specific wind farms or operational areas. KPI cards at the top summarize critical metrics, including TRIR, LTIFR, fatal accident rate, regulatory compliance rate, safety training completion, and high-potential incident count, along with comparisons to previous periods. Trend analysis charts display monthly TRIR performance compared to the same period last year, helping to identify seasonal safety patterns and long-term improvement trends.
Turbine zone analysis reveals high potential incident counts across towers, nacelles, blades, and substations, enabling teams to identify high-risk areas. Department-level LTIFR comparisons reveal which operational teams are exposed to higher injury rates. Incident severity distribution visualizes first aid, medical treatment, restricted work, and lost time injuries. Regulatory compliance performance charts track monthly audit and statutory compliance, helping ensure continuous adherence to safety regulations.
How to Analyze Data in a Wind Power Plant Workplace Safety & Regulatory Compliance Dashboard
This dashboard helps safety and compliance teams identify risks, monitor trends, and ensure regulatory adherence across wind power operations:
- Monitor TRIR & LTIFR Trends: Evaluate overall workplace safety performance over time using incident frequency indicators.
- Year-on-Year Safety Comparison: Compare current safety metrics with previous periods to assess improvement or deterioration.
- High-Risk Turbine Zone Identification: Identify turbine zones with higher potential incidents to prioritize safety controls.
- Department-wise Injury Analysis: Analyze LTIFR by department to detect operational areas with elevated injury risk.
- Incident Severity Breakdown: Review severity distribution to understand the impact level of reported incidents.
- Safety Training Completion Review: Track training completion rates to ensure workforce readiness for safety.
- Regulatory Compliance Monitoring: Monitor compliance percentages to detect audit gaps at an early stage.
- Filtered Safety Performance Analysis: Use filters by site, department, or turbine zone for focused insights.
- Root Cause Correlation: Correlate incident trends with compliance and training data for deeper root cause analysis.
Benefits of a Wind Power Plant Workplace Safety & Regulatory Compliance Dashboard
The following are the benefits of using this dashboard:
- Improved Safety Visibility: Provides clear visibility into workplace safety performance across wind operations.
- Early Risk Detection: Enables early identification of high-risk turbine zones and departments.
- Centralized Compliance Tracking: Supports regulatory compliance through unified reporting and monitoring.
- Incident Reduction: Reduces incident rates through data-driven safety interventions.
- Training Readiness Assurance: Improves safety training compliance and workforce preparedness.
- Multi-Site HSE Consistency: Enables standardized HSE performance monitoring across multiple wind farms.
- Operational Continuity: Reduces disruptions caused by workplace incidents and safety violations.
KPIs to Track in a Wind Power Plant Workplace Safety & Regulatory Compliance Dashboard
The following key KPIs can be tracked by using this dashboard:
- Total Recordable Incident Rate (TRIR): Measures the frequency of recordable workplace incidents.
- Lost Time Injury Frequency Rate (LTIFR): Tracks injuries resulting in lost work time.
- Fatal Accident Rate: Monitors the occurrence of fatal safety incidents.
- High Potential Incident Count (HIPC): Tracks incidents with high severity potential even if no injury occurred.
- Regulatory Compliance Rate (%): Measures adherence to safety and regulatory requirements.
- Safety Training Completion Rate (%): Tracks workforce completion of mandatory safety training programs.
Frequently Asked Questions
Q1. Who should use a wind power plant workplace safety dashboard?
This dashboard is used by HSE managers, safety officers, plant managers, compliance teams, and utility executives responsible for wind power operations.
Q2. Can this dashboard be used for both onshore and offshore wind farms?
Yes. The dashboard supports segmentation by site type, location, and operational zone for both onshore and offshore wind assets.
Q3. How often should safety data be reviewed in this dashboard?
Daily or weekly reviews are recommended for operational teams, while monthly reviews are suggested for leadership and compliance reporting purposes.