What is a Solar Plant Safety & Compliance Dashboard?
A Solar plant safety and compliance performance monitoring dashboard is a centralized monitoring system used by electric utilities, solar operators, and EHS (Environment, Health & Safety) teams to track worker safety, operational compliance, regulatory standards, and incident performance across utility-scale plants. It provides a unified view of safety metrics, including incident rates, near-miss events, equipment compliance, regulatory readiness, and training performance. The dashboard serves as a solar plant safety and compliance monitoring tool, enabling operators to measure the effectiveness of HSE controls, identify unsafe conditions early, and assess compliance with internal and regulatory standards. By combining real-time safety indicators and historical data, it supports proactive decision-making and ensures continuous alignment with safety policies, certifications, and legal requirements.
How to Create a Solar Plant Safety & Compliance Dashboard
You don’t need to build your report from scratch—just start with a ready-to-use dashboard template from Mokkup. Add in your data and export it however you like. Here’s how to do it:
1. Create or Log in to Your Mokkup Account
Start by signing up on Mokkup.ai using your email. If you already have an account, just log in, and you’ll be good to go.
2. Choose and Customize Your Dashboard Template
Find the Solar Plant Safety & Compliance Dashboard template in the Templates section. Use the drag-and-drop editor to adjust KPIs, edit filters, or add elements based on your data.
3. Export to Your BI Tool
Once your dashboard wireframe is ready, use the BI Tool Export feature to send it directly to Power BI or Tableau for further analysis and enhancements. You can also download the dashboard as a PDF, PNG, or JPEG, embed it on a platform, or invite your team to collaborate.
Note: This is a Pro template. You’ll need a Pro subscription on Mokkup to use and customize this dashboard wireframe. Upgrade anytime to unlock full access.
Solar Plant Safety & Compliance Dashboard Example
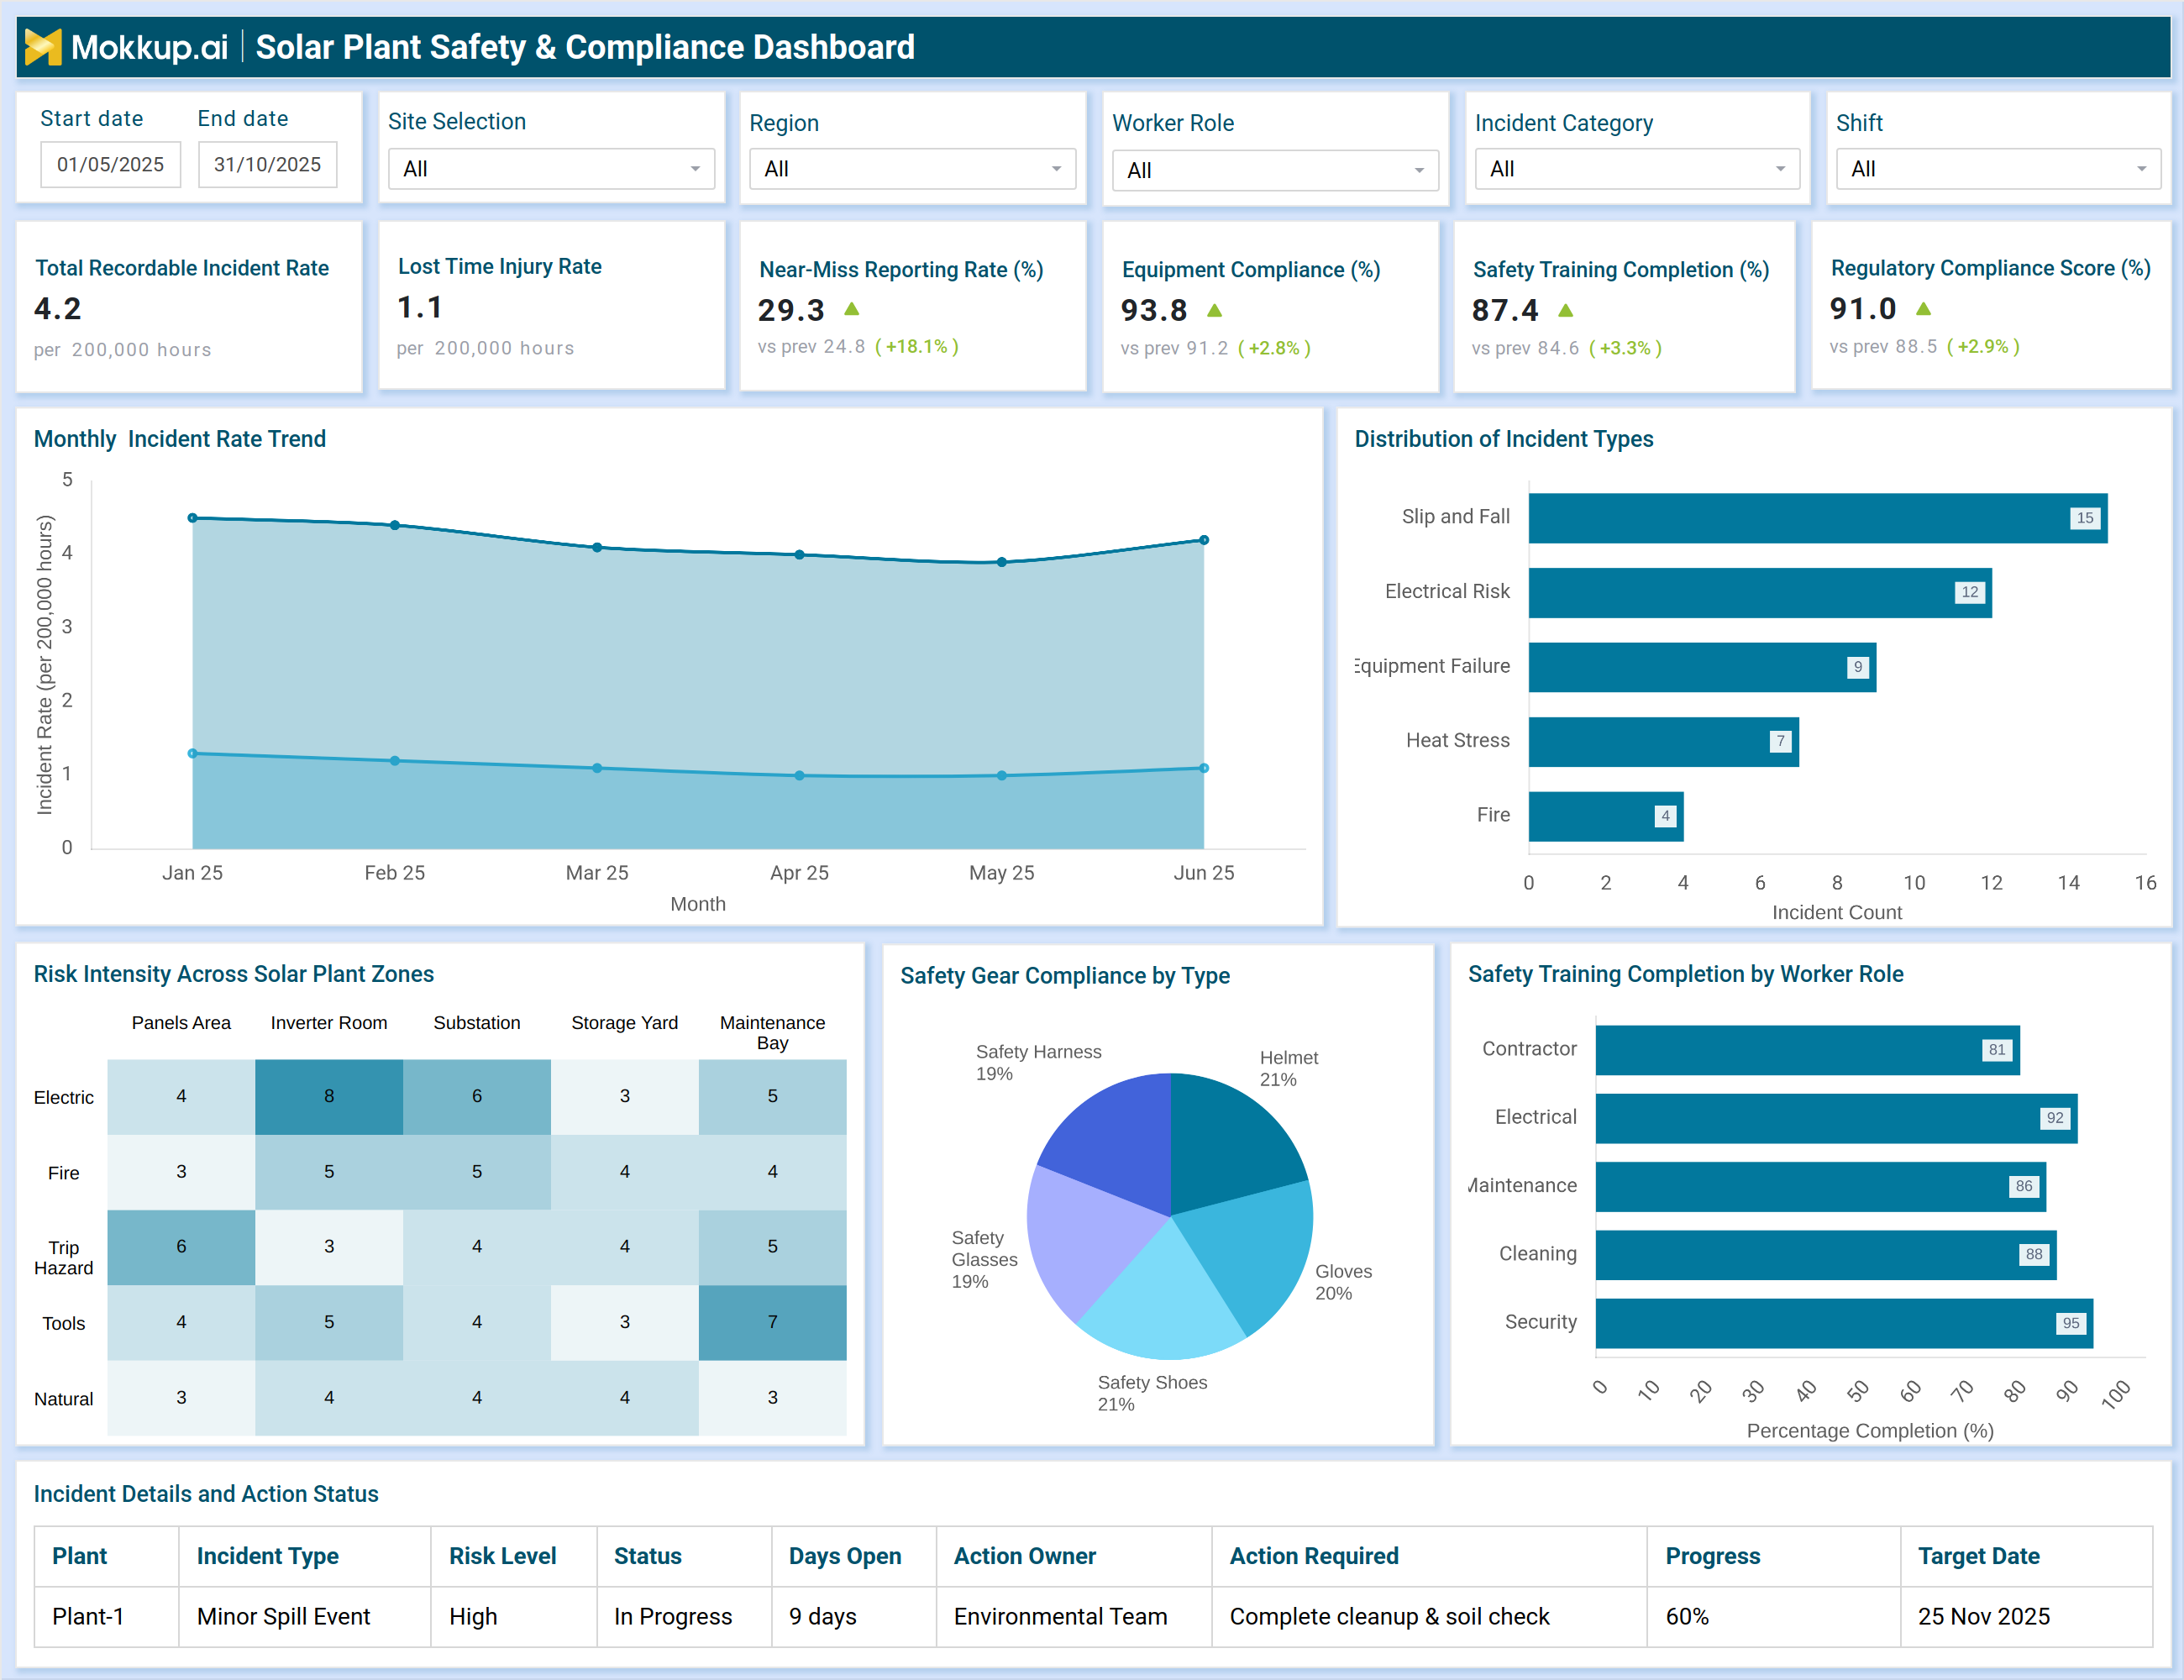
A typical solar power plant health, safety, and environmental compliance dashboard includes clear KPIs, visual trends, and zone-wise risk insights. In the provided example, the dashboard displays key safety metrics, including Total Recordable Incident Rate (TRIR), Lost Time Injury Rate (LTIR), Near-Miss Reporting, Equipment Compliance, and Safety Training Completion. These KPIs provide EHS leaders with a quick understanding of the overall safety and health of the plant. Trend charts display month-by-month incident rate movement, enabling teams to detect patterns such as seasonal hazards or recurring operational risks.
Bar charts highlight the distribution of incident types, such as electrical risks, slips, equipment failures, or heat stress, allowing teams to focus on the most frequent safety issues. Advanced components such as risk intensity heatmaps, PPE compliance charts, and training completion by worker role help identify high-risk plant zones, compliance gaps, and workforce training needs. The dashboard also includes incident-level details and corrective actions, serving as a renewable energy safety compliance and audit readiness reporting tool that supports internal audits, inspections, and regulatory submissions.
How to Analyze Data in a Solar Plant Safety & Compliance Dashboard
Here is how you can analyze data from this solar plant safety violations and corrective action performance dashboard:
- Monitor core safety KPIs, such as TRIR, LTIR, near-miss reporting, and regulatory compliance scores, to assess the safety posture.
- Track the distribution of incident types to identify common hazards and plan targeted safety interventions.
- Study trend lines to identify improvements or concerning patterns in incident rates over time.
- Analyze zone-based risk maps to identify areas such as inverters, substations, or maintenance bays that require heightened safety inspections.
- Measure PPE compliance to verify whether workers consistently follow safety gear requirements.
- Review worker role training completion to identify compliance gaps in contractor, electrical, or maintenance teams.
- Evaluate corrective action progress to ensure that safety violations and incidents are addressed on time.
- Compare shifts, worker roles, and regions to identify operational conditions that result in higher safety risks.
- Use incident detail logs for root-cause analysis and continuous mitigation planning.
Benefits of Solar Plant Safety & Compliance Dashboard
The following are the benefits of using this dashboard:
- Visibility into safety performance, enabling proactive decision-making.
- Reduction in safety violations, thanks to continuous monitoring and faster corrective actions.
- Improved compliance readiness, supporting ISO, OSHA, and regulatory audit requirements.
- Better workforce protection, as teams can identify high-risk zones and everyday hazards.
- Stronger incident prevention, supported by early detection of near-miss patterns.
- Optimized worker training programs, based on role-specific training completion data.
- Enhanced operational reliability by reducing equipment-related safety failures.
- Centralized safety documentation simplifies audits and compliance reporting.
- Lower operational risk exposure, supported by a complete electric utility solar compliance monitoring and risk management platform.
- Continuous improvement driven by data-backed insights into incidents, trends, and compliance performance.
KPIs to Track in Solar Plant Safety & Compliance Dashboard
The following key KPIs can be tracked by using this dashboard:
- Total Recordable Incident Rate (TRIR) – Tracks overall incident frequency per 200,000 hours.
- Lost Time Injury Rate (LTIR) – Measures incidents resulting in lost workdays.
- Near-Miss Reporting Rate (%) – Indicates reporting culture and proactive hazard identification.
- Equipment Compliance (%) – Monitors safety checks, preventive measures, and equipment standards.
- Regulatory Compliance Score (%) – Evaluates adherence to safety regulations and audits.
- Safety Training Completion (%) – Tracks completion of role-wise safety training programs.
- Incident Type Distribution – Understanding major categories like electrical risk, slips, and equipment failure.
- PPE Compliance (%) – Measures adherence to safety gear, including harnesses, helmets, gloves, and eyewear.
- Risk Intensity by Plant Zone – Identifies unsafe zones such as inverters, substations, or maintenance areas.
- Corrective Action Closure Rate – Tracks the speed at which teams resolve recorded safety issues.
- Incident Severity Levels – Categorizes incidents as minor, major, or critical.
- Days Overdue for Actions – Shows delays in incident resolution, inspections, or corrective tasks.
Frequently Asked Questions
1. Who uses a Solar Plant Safety & Compliance Dashboard?
EHS officers, plant managers, utility operators, compliance teams, and executive leadership rely on the dashboard for real-time monitoring of safety and compliance.
2. Can this dashboard support audit readiness?
Yes. Since it functions as a renewable energy safety compliance and audit readiness reporting tool, it helps maintain documentation, incident logs, and compliance metrics required for regulatory audits.
3. How often should safety data be updated?
Most utility-scale solar plants update the dashboard daily or weekly, depending on the workflow and hazard-criticality of operations.