What is a Wind Power Plant SCADA Uptime & Data Quality Dashboard?
A Wind Power Plant SCADA Uptime & Data Quality Dashboard is a centralized analytics interface used by electric power utilities to monitor SCADA system availability, data accuracy, completeness, latency, and alarm health across onshore and offshore wind farms. It consolidates SCADA signals from turbines, substations, communication networks, and servers to provide a historical view of operational uptime and data reliability. This wind power plant executive KPI dashboard enables utilities to identify SCADA downtime, degraded data streams, protocol-related delays, and data gaps that can impact power generation, forecasting, compliance reporting, and performance analytics. By aligning SCADA system health with operational KPIs, the dashboard supports proactive maintenance, faster issue resolution, and improved grid reliability.
How to Create a Wind Power Plant SCADA Uptime & Data Quality Dashboard
You don’t need to build your report from scratch, just start with a ready-to-use dashboard template from Mokkup. Add in your data and export it however you like. Here’s how to do it:
1. Create or Log in to Your Mokkup Account
Start by signing up on Mokkup.ai using your email. If you already have an account, just log in, and you’ll be good to go.
2. Choose and Customize Your Dashboard Template
Find the Wind Power Plant SCADA Uptime & Data Quality Dashboard template in the Templates section. Use the drag and drop editor to adjust KPIs, edit filters, or add elements based on your data.
3. Export to Your BI Tool
Once your dashboard wireframe is ready, use the BI Tool Export feature to send it directly to Power BI or Tableau for further analysis and enhancements. You can also download the dashboard as a PDF, PNG, or JPEG, embed it on a platform, or invite your team to collaborate.
Note: This is a Pro template. You’ll need a Pro subscription on Mokkup to use and customize this dashboard wireframe. Upgrade anytime to unlock full access.
Wind Power Plant SCADA Uptime & Data Quality Dashboard Example
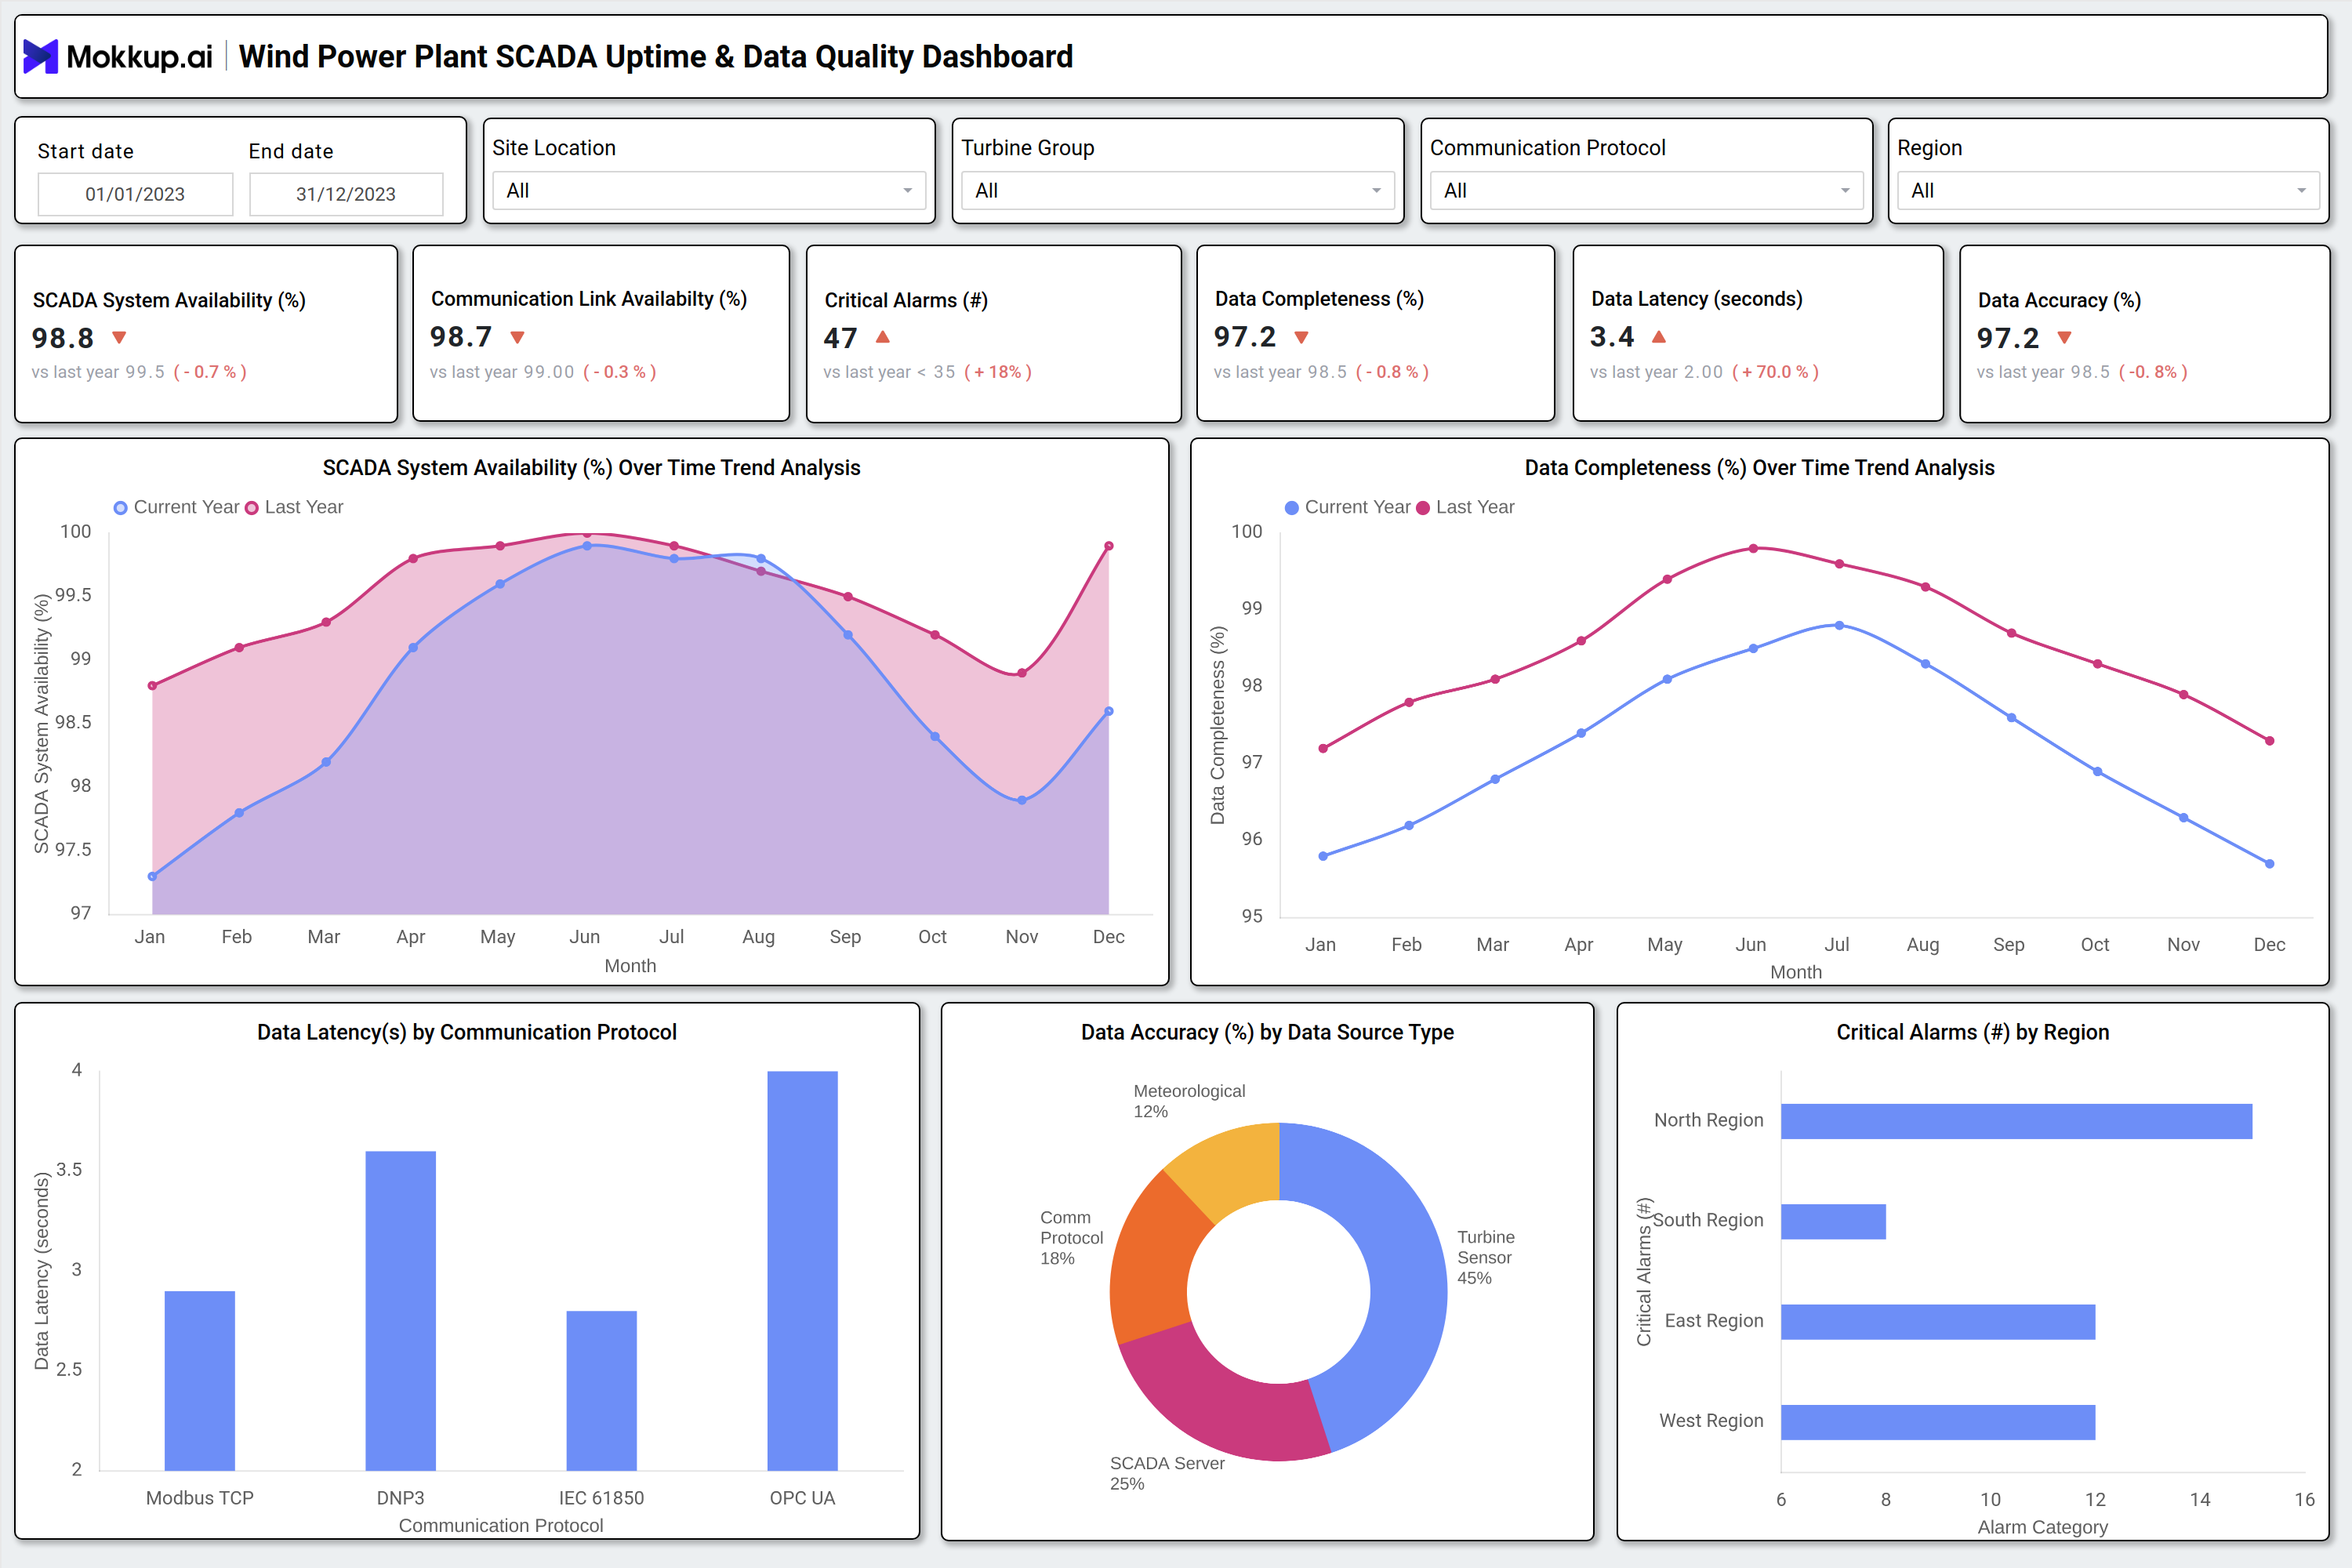
A typical wind power plant SCADA uptime dashboard includes global filters for date range, site location, turbine group, communication protocol, and region to enable multi level analysis. High level KPI cards display SCADA system availability percentage, CLA, number of critical alarms, data completeness, data latency, and data accuracy, with year over year comparisons. Trend charts show monthly SCADA availability and data completeness for current and previous years, helping operators identify seasonal degradation patterns. Protocol wise latency analysis highlights performance differences between Modbus TCP, DNP3, IEC 61850, and OPC UA. Donut charts break down data accuracy by source type such as turbine sensors, SCADA servers, communication protocols, and meteorological systems. Regional alarm distribution charts allow utilities to pinpoint high risk zones requiring immediate intervention.
How to Analyze Data in a Wind Power Plant SCADA Uptime & Data Quality Dashboard
Here is how you can analyze data from this wind energy SCADA data quality KPI dashboard:
- Compare SCADA system availability trends month-over-month: Identify recurring downtime patterns, seasonal variations, or system-level issues that impact overall turbine uptime.
- Analyze CLA (Communication Link Availability) values: Evaluate how reliably the operational data is being captured and ensure communication channels are stable.
- Monitor critical alarm spikes by region: Detect clusters of alarms that may indicate infrastructure failures, environmental disruptions, or network instability.
- Track data completeness percentages: Spot missing, incomplete, or delayed SCADA data streams that could impact performance monitoring and reporting accuracy.
- Review data latency by communication protocol: Understand which protocols or links are causing delays and optimize them to improve real-time data flow.
- Evaluate data accuracy by source: Compare sensor-level data quality to identify faulty instrumentation, calibration issues, or corrupt SCADA inputs.
- Use year-over-year comparisons: Validate whether uptime improvements, network upgrades, or maintenance initiatives are producing measurable results.
- Drill down by site or turbine group: Pinpoint weak-performing assets, turbines, or clusters that need maintenance, optimization, or component-level inspection.
Benefits of a Wind Power Plant SCADA Uptime & Data Quality Dashboard
The following are the benefits of using this wind power SCADA data reliability analytics dashboard:
- Improves SCADA system availability: Ensures both onshore and offshore wind farms operate with minimal data disruptions and maximum visibility.
- Enhances data reliability for analytics and reporting: Strengthens forecasting models and performance insights by ensuring clean, complete, high-quality data.
- Reduces operational risk: Minimizes failures caused by inaccurate, missing, or poor-quality SCADA information.
- Enables faster root cause analysis: Helps teams quickly diagnose downtime, alarm surges, network failures, or SCADA system errors.
- Supports proactive maintenance: Ensures communication networks, servers, and data pipelines remain healthy and optimized.
- Strengthens audit and compliance readiness: Provides traceable, quality-verified SCADA data for regulatory and certification requirements.
- Aligns IT, OT, and operations teams: Creates a unified view of plant performance, improving collaboration and decision-making.
KPIs to Track in a Wind Power Plant SCADA Uptime & Data Quality Dashboard
The following key KPIs can be tracked by using this SCADA uptime and availability dashboard for wind farms:
- SCADA System Availability (%) – Measures the percentage of time the SCADA system is operational and accessible for real-time wind plant monitoring.
- Communication Link Availability (%) – Indicates the uptime of network and communication links connecting turbines, substations, and control centers.
- Critical Alarms Count – Tracks the number of high-severity SCADA alarms requiring immediate operational or safety intervention.
- Data Completeness (%) – Represents the proportion of expected SCADA data points successfully captured without gaps.
- Data Latency (Seconds) – Measures the time delay between data generation at field devices and its availability in monitoring systems.
- Data Accuracy (%) – Assesses the correctness of SCADA data by comparing received values against validated or reference measurements.
Frequently Asked Questions
1. What is SCADA uptime in a wind power plant?
SCADA uptime refers to the percentage of time the SCADA system remains fully operational and available to collect, transmit, and process data from wind turbines and infrastructure.
2. Can this dashboard be used for offshore and onshore wind farms?
Yes, the dashboard is suitable for both onshore and offshore wind power plants, supporting region-wise and site-level analysis.
3. Who typically uses this dashboard?
SCADA engineers, utility operations teams, reliability engineers, asset managers, and power utility executives use this dashboard.