
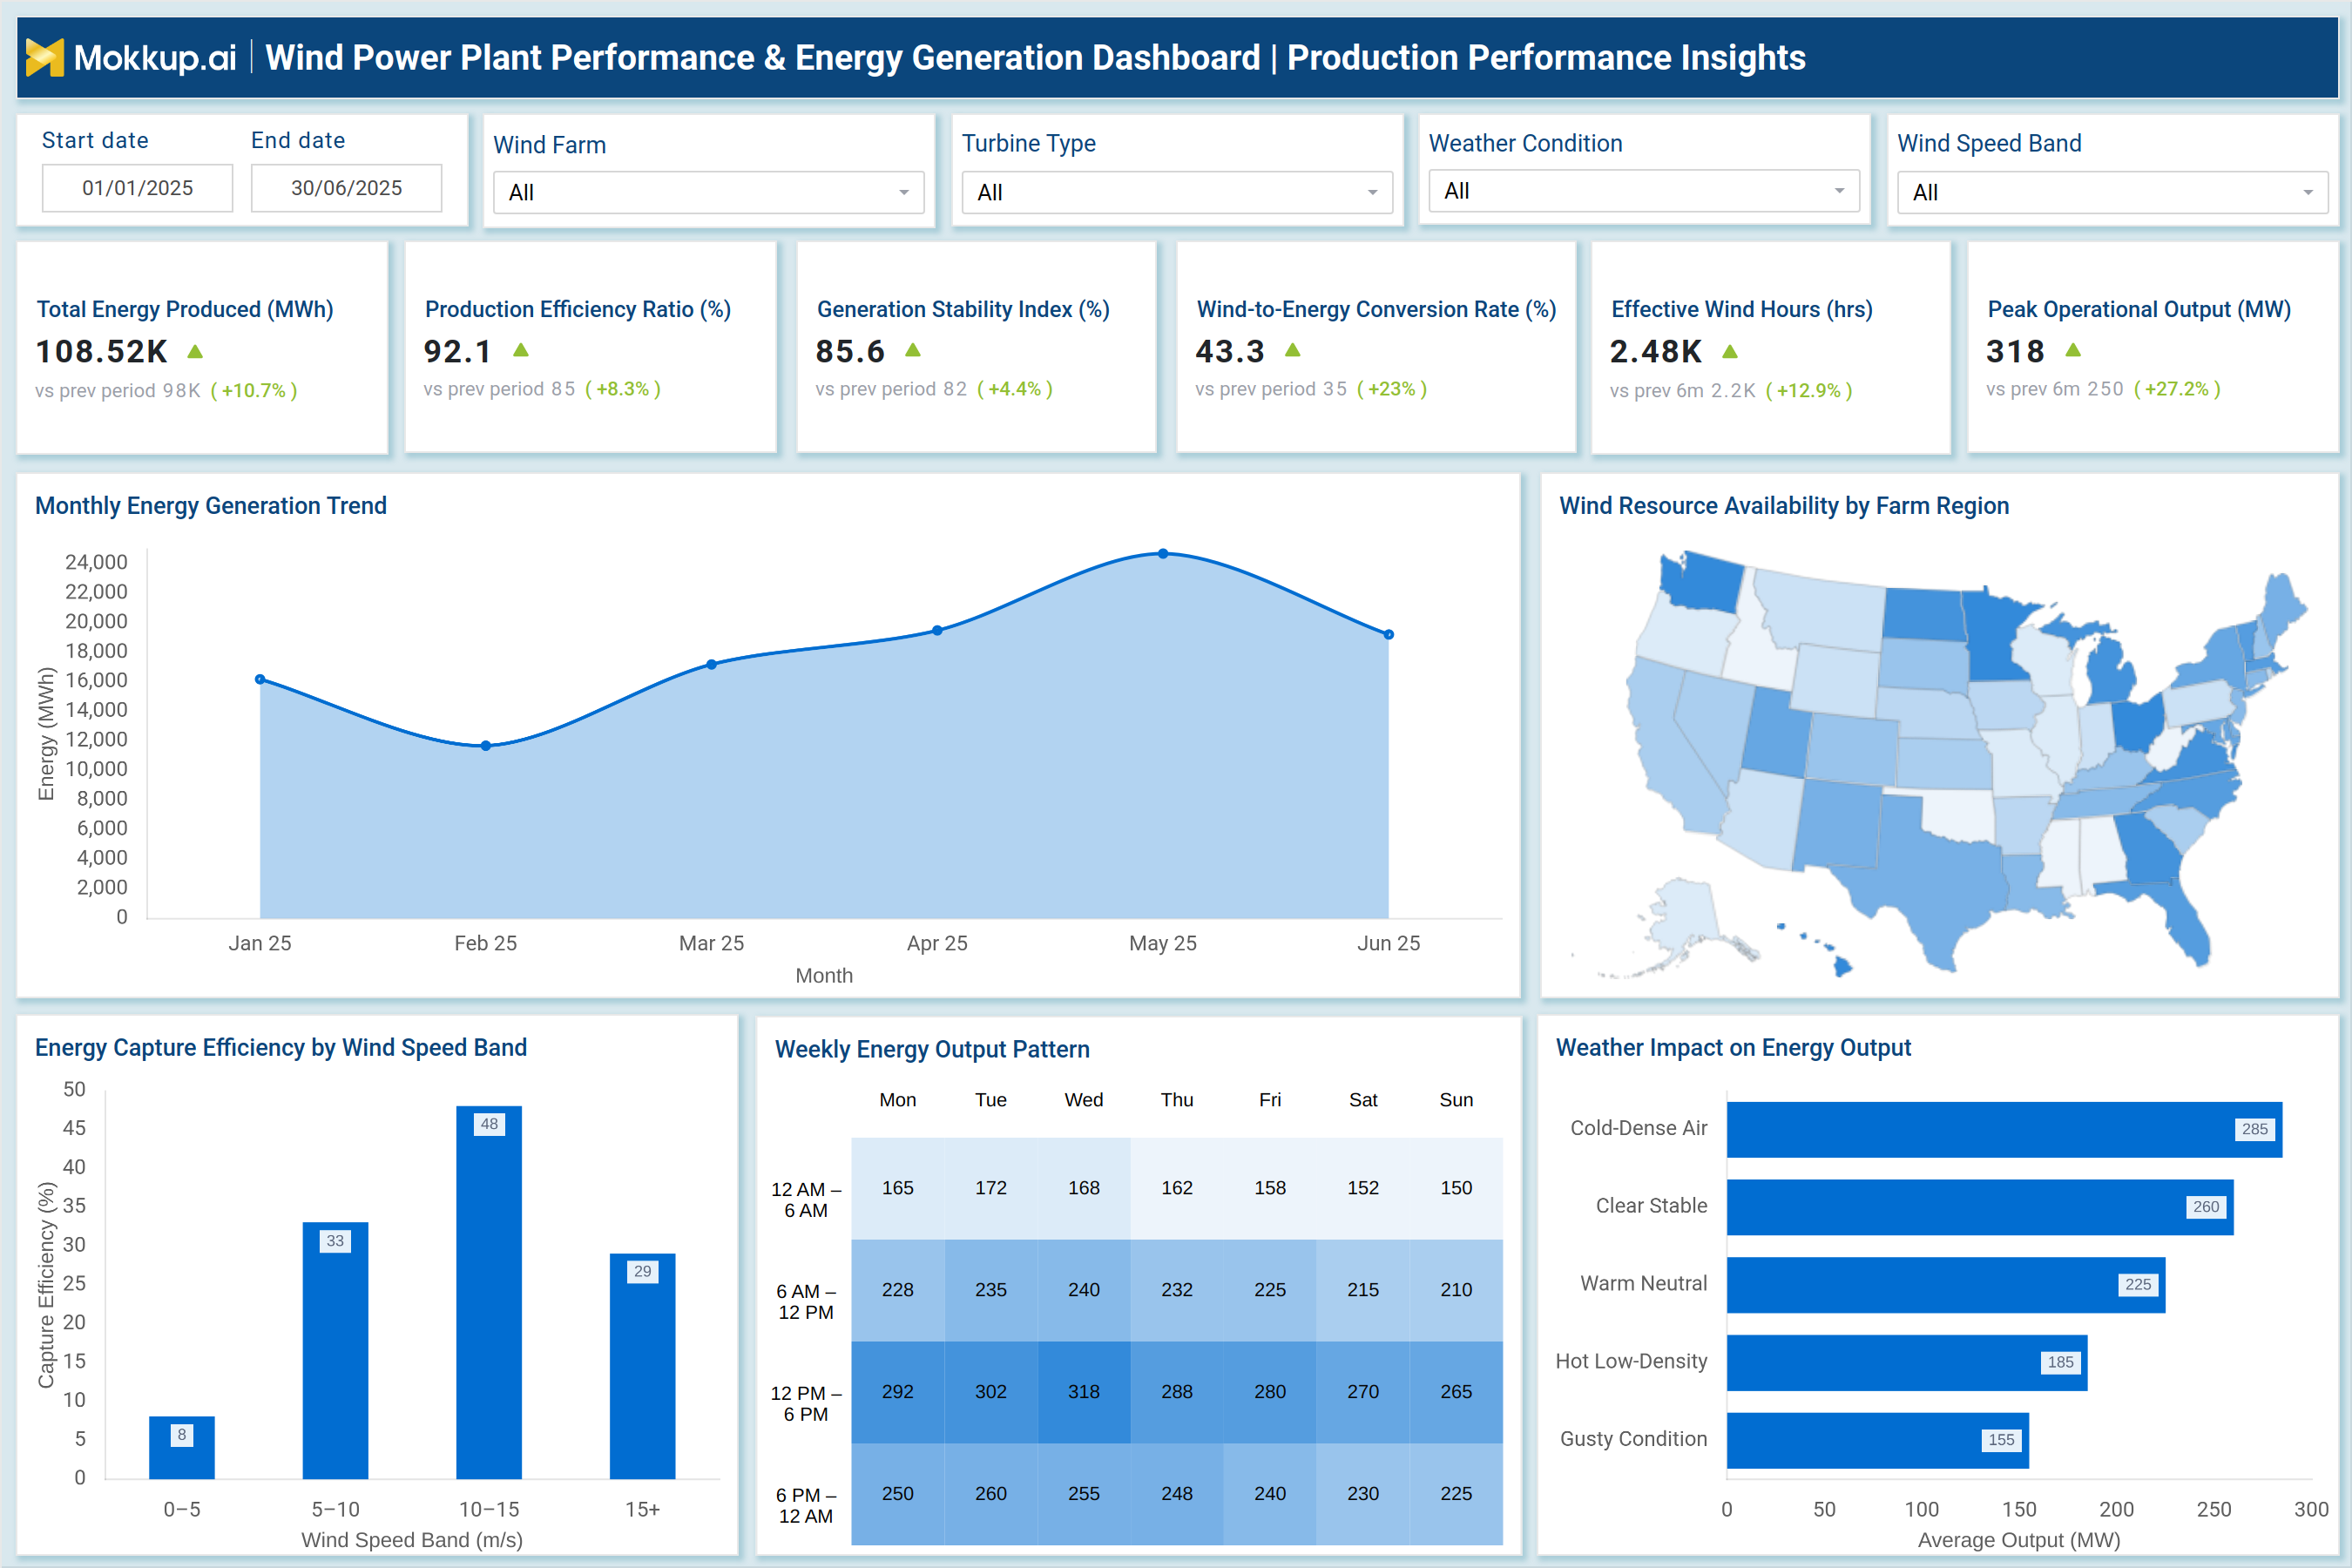
What is a Wind Power Plant Performance & Energy Generation Dashboard?
A Wind Power Plant Performance & Energy Generation Dashboard template is an analytics system used by electric power utilities to monitor energy output, turbine performance, and operational efficiency across onshore and offshore wind farms. It consolidates SCADA data, weather parameters, turbine metrics, and production KPIs into a unified interface that supports data-driven operational decisions. This dashboard wireframe serves as a wind power plant performance monitoring dashboard, enabling utilities to track energy production, conversion rates, peak output, and resource availability.
How to Create a Wind Power Plant Performance & Energy Generation Dashboard
You don’t need to build your report from scratch; just start with a ready-to-use Wind Power Plant Performance & Energy Generation dashboard template from Mokkup. Add in your data and export it however you like. Here’s how to do it:
1. Create or Log in to Your Mokkup Account
Start by signing up on Mokkup.ai using your email. If you already have an account, just log in, and you’ll be good to go.
2. Choose and Customize Your Dashboard Template
Find the Wind Power Plant Performance & Energy Generation Dashboard template in the Templates section. Use the drag-and-drop editor to adjust KPIs, edit filters, or add elements based on your data.
3. Export to Your BI Tool
Once your dashboard wireframe is ready, use the BI Tool Export feature to send it directly to Power BI or Tableau for further analysis and enhancements. You can also download the dashboard as a PDF, PNG, or JPEG, embed it on a platform, or invite your team to collaborate.
Note: This is a Pro template. You’ll need a Pro subscription on Mokkup to use and customize this dashboard wireframe. Upgrade anytime to unlock full access.
Wind Power Plant Performance & Energy Generation Dashboard Example
A typical example of this dashboard includes two major analytical screens: Production Performance Insights and Energy Loss Diagnostics. The Production Performance view highlights the metrics that determine energy output, including total energy produced, efficiency ratio, generation stability, wind-to-energy conversion rate, effective wind hours, and peak operational output. Supporting visuals such as monthly generation trends, wind resource availability maps, energy capture efficiency by wind speed band, weekly output patterns, and weather impact analysis help identify what drives production variance.
The second view, Energy Loss Diagnostics, focuses on performance bottlenecks and operational losses. It tracks total energy lost, turbine downtime, failure recurrence, asset health index, and reactive shutdown events. The dashboard also provides a root-cause breakdown of energy loss, maps regional loss contributions, shows operational drivers of outages, and displays monthly loss trends. A table of critical incident details helps utilities review major disruptions, their duration, and the operational scenario that triggered them. Combined, these two views provide a complete wind turbine efficiency and energy output analysis dashboard, addressing both production optimization and loss reduction.
How to Analyze Data in a Wind Power Plant Performance & Energy Generation Dashboard
Here is how you can analyze data from this dashboard:
- Total Energy Produced & Efficiency Ratio: Begin with these to assess baseline production performance.
- Generation Stability & Conversion Rate: Review these to understand how consistently turbines convert wind resources into energy.
- Monthly & Weekly Output Patterns: Analyze production cycles, peak periods, and low-output phases.
- Wind Resource Availability by Region: Evaluate which locations offer the highest energy yield.
- Capture Efficiency by Wind Speed Bands: Identify turbine performance under different atmospheric conditions.
- Weather Impact Analysis: Inspect how temperature, density, and stability influence production.
- Total Energy Lost & Downtime: Determine operational weaknesses and inefficiencies.
- Failure Recurrence & Asset Health Index: Study these to evaluate turbine reliability.
- Root-Cause Analysis: Pinpoint dominant reasons behind energy loss.
- Regional Loss Contribution: Identify areas requiring operational improvements.
- Operational Drivers of Energy Loss: Review these to prioritize mitigation actions.
- Critical Incident Logs: Analyze high-impact disruptions and their root triggers.
Benefits of a Wind Power Plant Performance & Energy Generation Dashboard
The following are the benefits of using this dashboard:
- Enhanced Production Visibility: Monitor energy output and turbine efficiency in real time.
- Predictive Maintenance Support: Track failure patterns, health indices, and downtime trends.
- Data-Driven Decision-Making: Gain accurate environmental and weather-linked performance insights.
- Optimized Energy Yield: Identify resource-rich regions and high-performing wind speed bands.
- Reduced Energy Loss: Highlight operational bottlenecks and root-cause-driven disruptions.
- Improved Forecasting Accuracy: Use historical production and stability trends.
- Unified Onshore & Offshore Reporting: Manage all asset types in one dashboard.
- Stronger Asset Reliability: Monitor performance deviations and shutdown events.
- Better Resource Planning: Understand peak output periods and weather-driven variations.
- Compliance Support: Simplify structured performance and loss analytics for audits.
KPIs to Track in a Wind Power Plant Performance & Energy Generation Dashboard
The following key KPIs can be tracked by using this dashboard:
- Total Energy Produced (MWh): Measures total electricity output over the selected period.
- Production Efficiency Ratio (%): Indicates how effectively turbines convert available wind energy into electrical output.
- Generation Stability Index (%): Reflects consistency of energy production across time.
- Wind-to-Energy Conversion Rate (%): Shows the proportion of wind resources converted into usable power.
- Effective Wind Hours (hrs): Measures the duration of optimal wind conditions.
- Peak Operational Output (MW): Represents maximum turbine or farm output achieved.
- Energy Lost (MWh): Quantifies production losses due to operational or environmental reasons.
- Loss per Turbine (MWh/turbine): Evaluates turbine-level inefficiency.
- Average Turbine Downtime (hrs): Measures the time turbines are offline.
- Failure Recurrence Rate (%): Indicates how often mechanical or electrical failures repeat.
- Asset Health Index (%): Shows the overall performance condition of turbine assets.
- Reactive Shutdown Events: Counts automated shutdowns triggered by safety or environmental thresholds.
Frequently Asked Questions
Q1. Who uses this dashboard in wind power utilities?
Operations teams, performance engineers, asset managers, reliability teams, and executive planners.
Q2. Can the dashboard track both onshore and offshore wind farms?
Yes. It functions as both an onshore and offshore analytics platform, supporting mixed asset portfolios.
Q3. How does weather data influence performance analysis?
Weather patterns influence wind speed, air density, and stability, which directly affect turbine output.