What is a Solar Power Plant SCADA Health Dashboard?
A Solar Power Plant SCADA Health Dashboard is a centralized monitoring tool designed for plant managers, maintenance supervisors, and operations engineers. It provides a consolidated view of the health and performance of the Supervisory Control and Data Acquisition (SCADA) system, which is the nerve center of a solar power plant. This dashboard tracks critical infrastructure metrics such as system uptime, data availability, alarm frequency, communication link stability, and cybersecurity status. It serves as a vital Solar Power Plant SCADA monitoring dashboard, enabling technical teams to proactively identify issues, maintain system integrity, and ensure the reliable operation of the entire plant.
How to Create a Solar Power Plant SCADA Health Dashboard
You don't need to design your dashboard from scratch. Simply begin with a pre-built Solar Power Plant SCADA Health Dashboard template from Mokkup. Customize it with your specific data and export it for use. Here’s how:
1. Create or Log in to Your Mokkup Account
Sign up on Mokkup.ai using your email address. Existing users can log in directly to access the platform.
2. Choose and Customize Your Dashboard Template
Navigate to the Templates section and select the Solar Power Plant SCADA Health Dashboard. Use the intuitive drag-and-drop editor to modify Key Performance Indicators (KPIs), adjust filters, or add new visual components based on your plant's data.
3. Export to Your BI Tool
Once your dashboard wireframe is finalized, use the BI Tool Export feature to transfer it directly to Power BI or Tableau for deeper data analysis and refinement. You can also download the dashboard as a PDF, PNG, or JPEG, embed it in another platform, or invite colleagues to collaborate.
Note: This is a Pro template. A Mokkup Pro subscription is required to use and customize this dashboard wireframe.
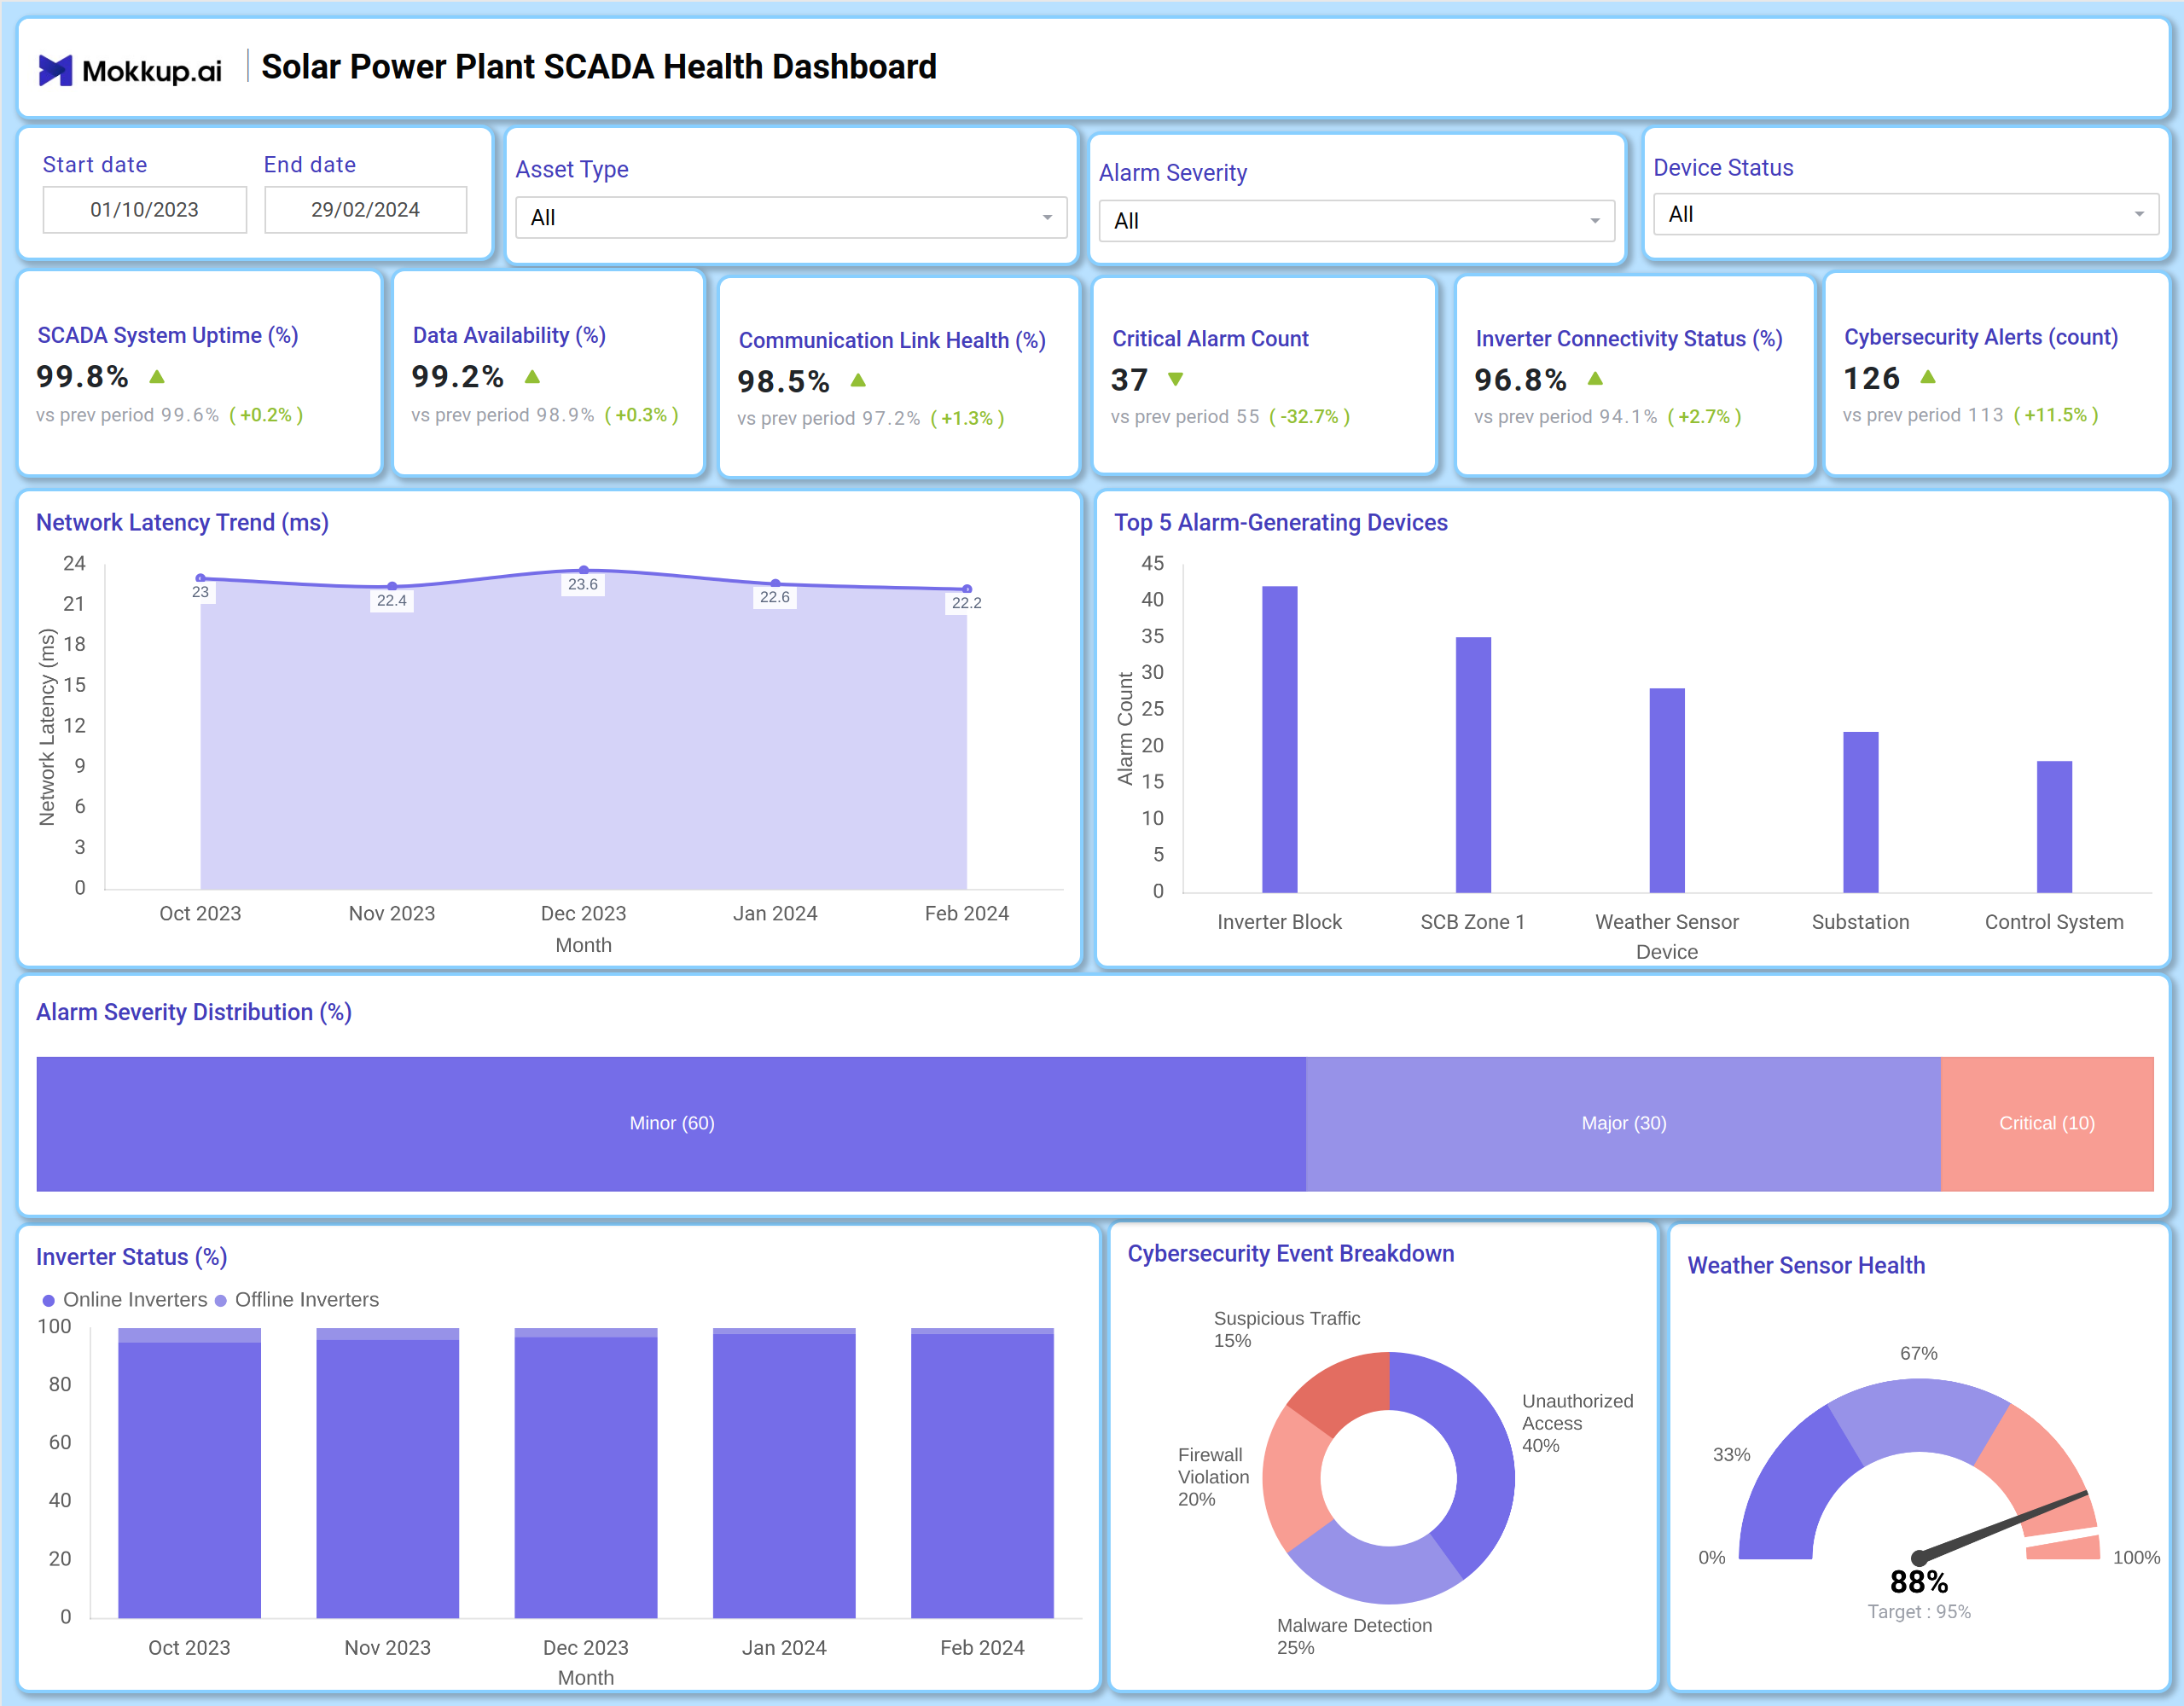
Solar Power Plant SCADA Health Dashboard Example
You can create a comprehensive Solar Power Plant SCADA Health Dashboard using a combination of KPI tiles and charts. At the top, KPI cards display essential metrics like SCADA System Uptime, Data Availability, and Critical Alarm Count. Below, visualizations such as trend lines show the history of Network Latency and Inverter Online/Offline Status. Bar charts can identify the Top 5 Alarm-Generating Devices, while pie charts break down Alarm Severity Distribution and Cybersecurity Events. This layout makes it an effective dashboard for tracking the health of solar farm SCADA systems, providing a clear picture of operational stability and security.
How to Analyze Data in Solar Power Plant SCADA Health Dashboards
Here’s how plant operators and engineers can leverage the data presented on the Solar Power Plant SCADA Health Dashboard:
- Monitor System Reliability: Track SCADA System Uptime and Data Availability percentages to ensure the system is consistently operational and collecting necessary information.
- Assess Critical Issues: Review the Critical Alarm Count and identify the Top Alarm-Generating Devices to prioritize maintenance and troubleshooting efforts.
- Evaluate Infrastructure Health: Analyze Communication Link Health and Inverter Connectivity Status to pinpoint weaknesses in the plant's communication network and critical hardware.
- Track Security Posture: Monitor Cybersecurity Alerts and their breakdown (e.g., Malware Detection, Firewall Violations) to gauge the system's security status.
- Review Performance Trends: Use the Network Latency Trend chart to identify potential communication bottlenecks over time.
- Gauge Device Status: Observe the Inverter's online vs. offline status to determine the operational readiness of key power generation units quickly.
Benefits of Solar Power Plant SCADA Health Dashboards
- Enhanced System Reliability: Continuous tracking of uptime and availability ensures the SCADA system, the plant's core, remains functional.
- Proactive Maintenance: Identifying frequent alarms and problematic devices allows teams to address issues before they cause significant downtime, making it a proactive SCADA health monitoring solution.
- Improved Operational Efficiency: A clear view of connectivity and communication health enables the optimization of network performance and resource allocation, ultimately enhancing overall operational efficiency.
- Informed Security Management: Visibility into cybersecurity events provides a deeper understanding of threats and reinforces defenses.
- Centralized Visibility: Consolidates all critical SCADA health metrics into a single view, simplifying oversight for plant management.
- Performance Trend Analysis: Historical data on latency and device status helps in long-term planning and performance improvement.
Together, these elements provide technical leadership with a clear understanding of the SCADA system's condition, making it easier to ensure plant reliability and efficiency. This is why many plant managers consider it the best SCADA health dashboard for solar power plants, enabling them to maintain operational excellence.
KPIs to Track in Solar Power Plant SCADA Health Dashboards
- SCADA System Uptime (%): The percentage of time the SCADA system is fully operational.
- Data Availability (%): The proportion of expected data points successfully collected from field devices.
- Critical Alarm Count: The number of high-priority alarms triggered by the system.
- Communication Link Health (%): The stability and performance of communication networks between the SCADA server and remote devices.
- Inverter Connectivity Status (%): The percentage of inverters successfully communicating with the SCADA system.
- Cybersecurity Alerts (count): The number of security-related incidents detected.
- Network Latency (ms): The time delay in data communication across the SCADA network.
- Top Alarm-Generating Devices: The specific devices or subsystems that trigger the most alarms.
- Alarm Severity Distribution (%): The breakdown of alarms by their level of urgency (e.g., Critical, Major, Minor).
- Inverter Online/Offline Status (%): The proportion of inverters that are online and operational versus those that are offline.
Frequently Asked Questions
1. Who should use a Solar Power Plant SCADA Health Dashboard?
Plant Managers, SCADA Engineers, Maintenance Supervisors, and Operations Teams are responsible for the health and performance of the solar power plant's control system.
2. Can this dashboard help reduce plant downtime?
Yes. By providing early warnings through alarm trends and device status monitoring, it enables proactive maintenance, which can prevent extended outages.
3. How does it support cybersecurity efforts?
It consolidates cybersecurity alert data, giving teams visibility into the frequency and type of threats, which is crucial for a solar farm cybersecurity status dashboard.
4. Is this dashboard helpful in reporting?
Yes, because a Solar Power Plant SCADA reporting and analytics dashboard supports operational reviews, compliance reporting, and performance audits for stakeholders.