What is a Wind Power Plant Reliability & Predictive Maintenance Dashboard?
A Wind Power Plant Reliability & Predictive Maintenance Dashboard template is an analytics system designed to assess turbine health, monitor component performance, and predict failures across onshore and offshore wind farms. It consolidates SCADA parameters, sensor data, maintenance history, and environmental conditions into a single platform. This dashboard wireframe serves as a wind power plant reliability monitoring dashboard, enabling utilities to track fleet availability, failure frequency, outage behavior, and component degradation.
How to Create a Wind Power Plant Reliability & Predictive Maintenance Dashboard
You don’t need to build your report from scratch—just start with a ready-to-use Wind Power Plant Reliability & Predictive Maintenance dashboard template from Mokkup. Add in your data and export it however you like. Here’s how to do it:
1. Create or Log in to Your Mokkup Account
Start by signing up on Mokkup.ai using your email. If you already have an account, just log in, and you’ll be good to go.
2. Choose and Customize Your Dashboard Template
Find the Wind Power Plant Reliability & Predictive Maintenance Dashboard template in the Templates section. Use the drag-and-drop editor to adjust KPIs, edit filters, or add elements based on your data.
3. Export to Your BI Tool
Once your dashboard wireframe is ready, use the BI Tool Export feature to send it directly to Power BI or Tableau for further analysis and enhancements. You can also download the dashboard as a PDF, PNG, or JPEG, embed it on a platform, or invite your team to collaborate.
Note: This is a Pro template. You’ll need a Pro subscription on Mokkup to use and customize this dashboard wireframe. Upgrade anytime to unlock full access.
Wind Power Plant Reliability & Predictive Maintenance Dashboard Example
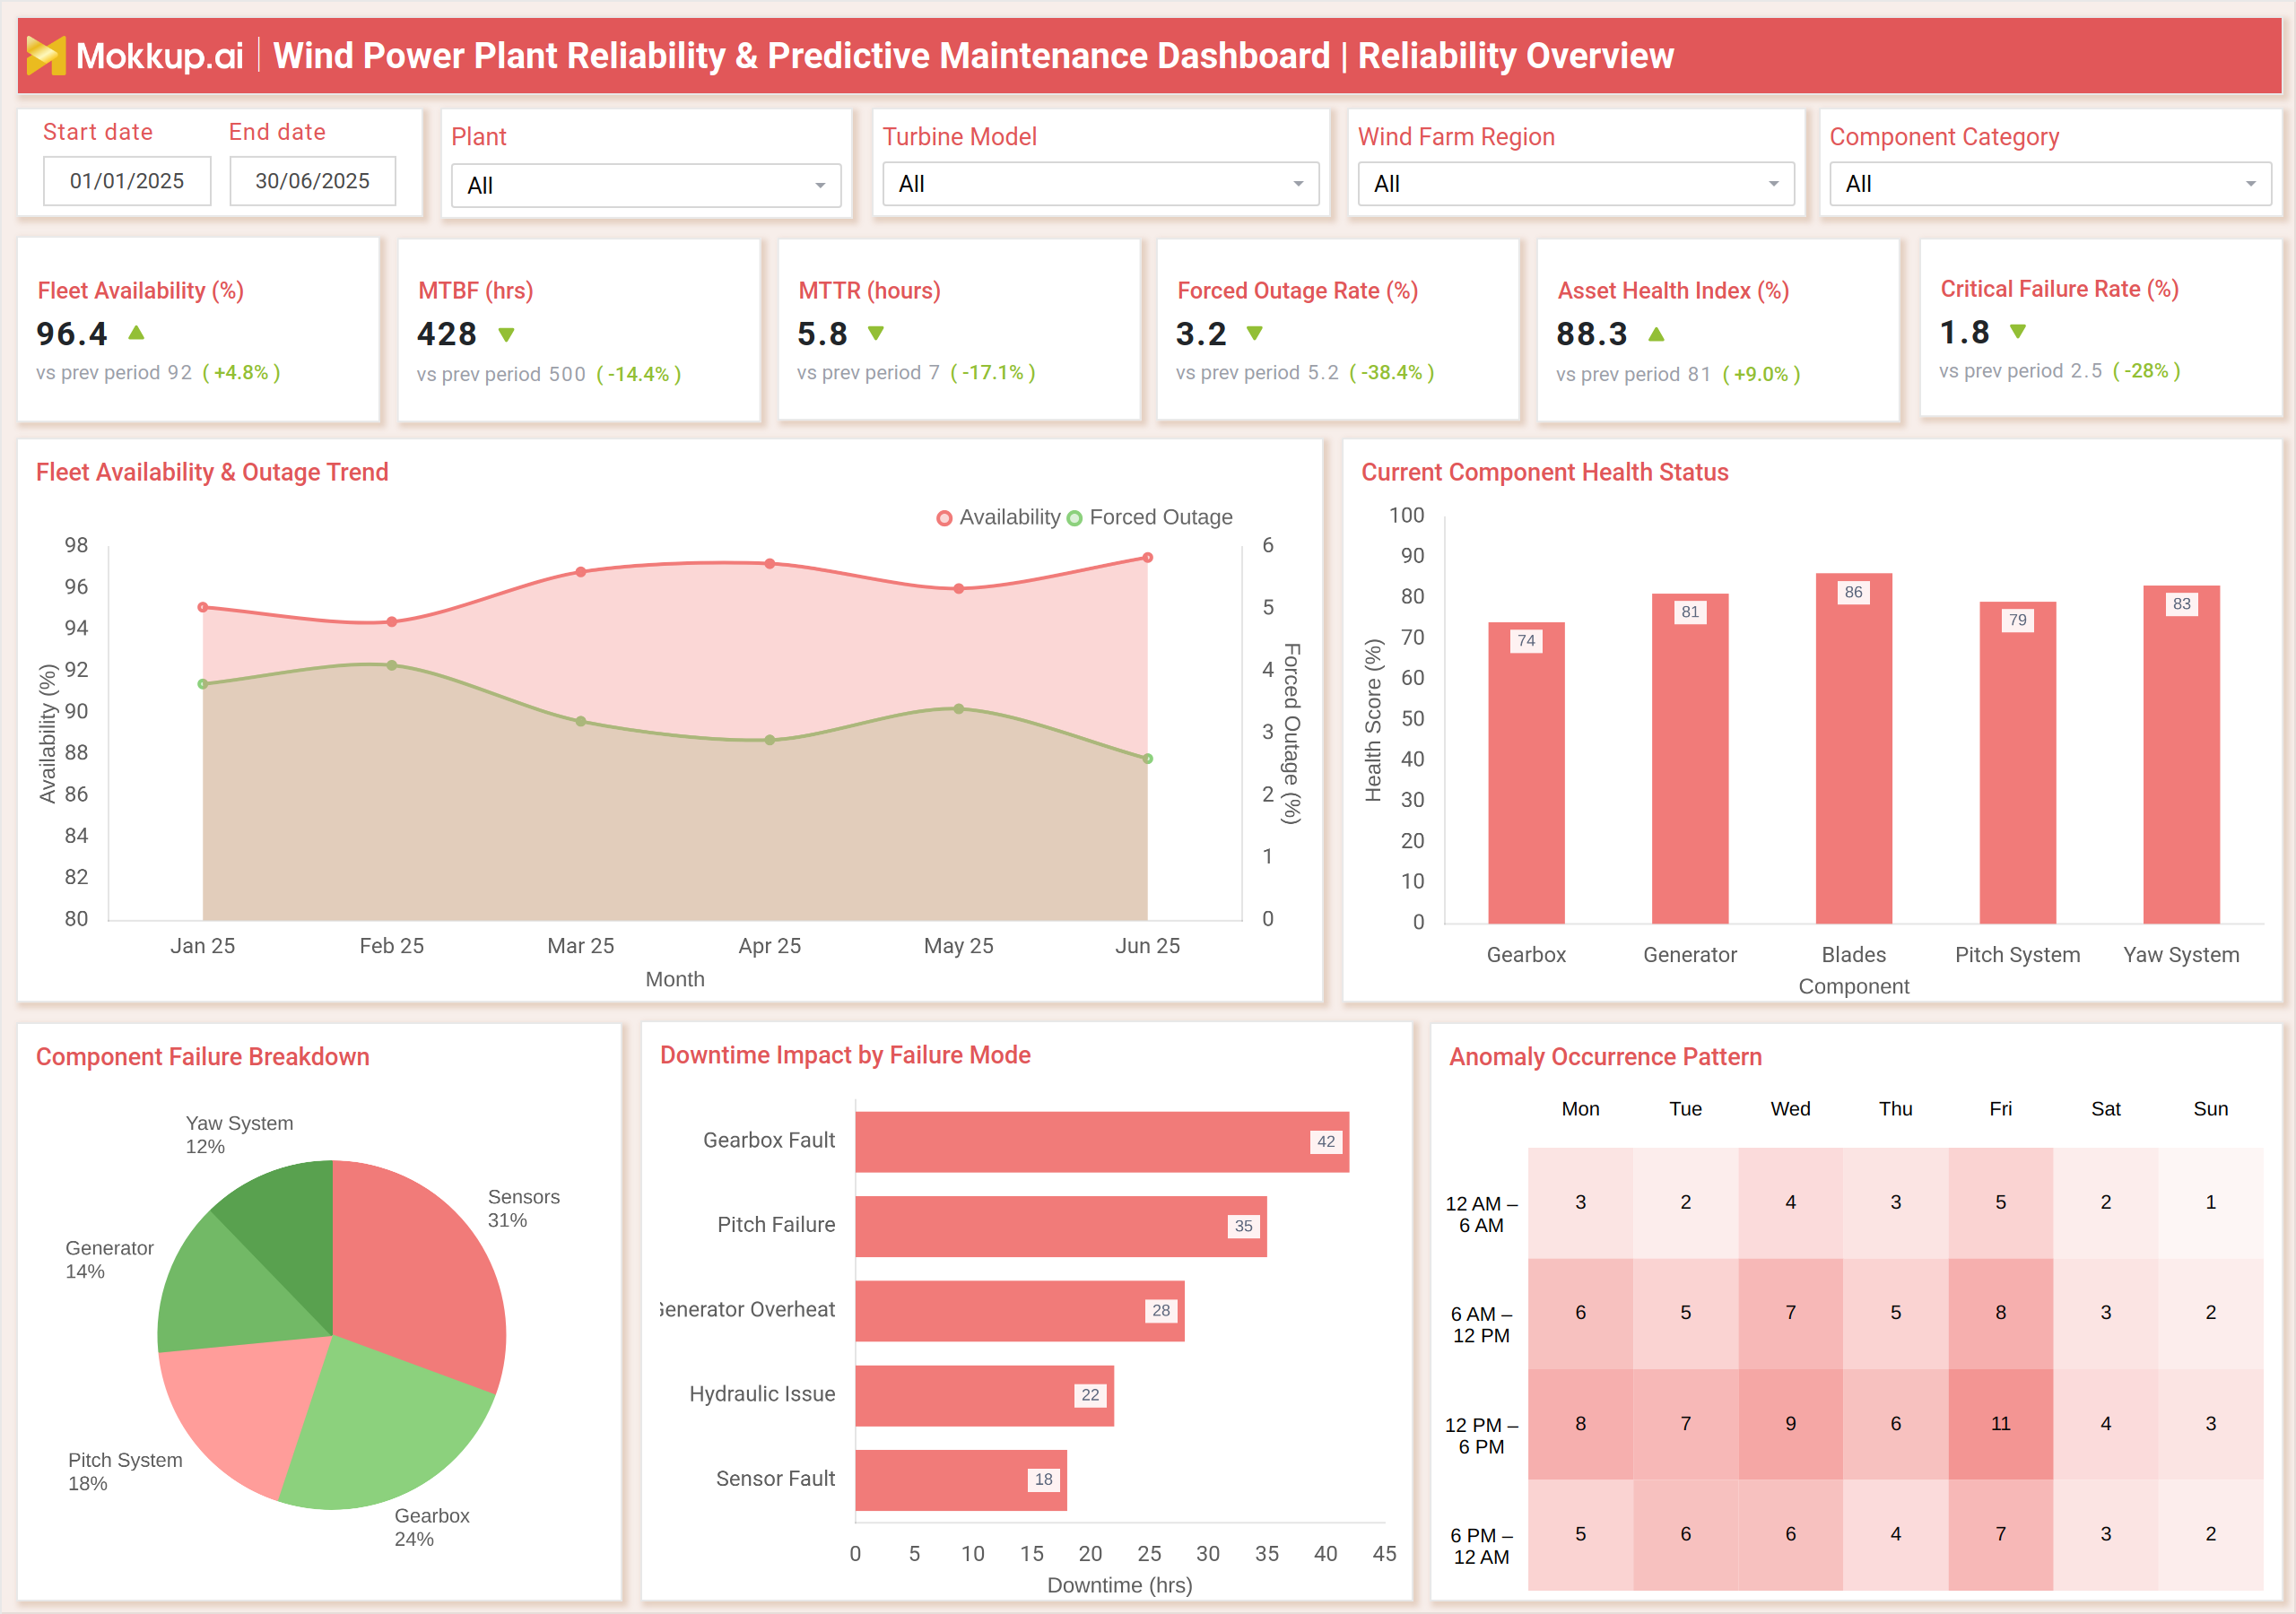
This dashboard is structured into two main areas: Reliability Overview and Predictive Maintenance Insights. The Reliability Overview screen provides a clear picture of fleet performance. Metrics such as fleet availability, MTBF, MTTR, forced outage rate, asset health index, and critical failure rate help quantify reliability. A time-series view of availability versus forced outage trends gives insight into operational stability over months. Component health charts display the health status of key subsystems, including gearboxes, generators, blades, pitch systems, and yaw systems. Additional visuals break down component failures, show the impact of downtime by failure mode, and map anomaly occurrences across time blocks.
These analytics help operators identify recurring issues, weak components, stress periods, and operational inefficiencies. The Predictive Maintenance Insights screen focuses on identifying future risks and planning maintenance. It highlights high-risk components, average RUL, failure escalation levels, predicted energy loss, spare parts readiness, and pending maintenance backlog. RUL distribution charts across components show how close different systems are to their end-of-life thresholds. Predictive driver analysis helps diagnose underlying contributors such as vibration, thermal stress, imbalance, electrical overload, and sensor drift. Spare-parts readiness charts highlight inventory gaps that could delay repairs. A critical maintenance action table provides component-level details, downtime estimates, technician requirements, and recommended interventions. This example demonstrates how the dashboard connects operational reliability with predictive insights to support strategic asset management.
How to Analyze Data in Wind Power Plant Reliability & Predictive Maintenance Dashboard
Here is how you can analyze data from this dashboard:
- Fleet Reliability Check: Review fleet availability and forced outage rate to understand baseline reliability.
- Failure Frequency & Repair Time: Analyze MTBF and MTTR to determine failure frequency and repair duration.
- Health Degradation Trends: Check asset health index trends to detect early performance degradation.
- Subsystem Reliability Review: Use component health charts to compare subsystem reliability across turbines.
- High-Impact Failures: Study failure breakdowns to identify high-impact components driving outages.
- Downtime Contributors: Assess downtime impact by failure mode to prioritize maintenance actions.
- Anomaly Patterns: Examine anomaly occurrence patterns to identify time periods with abnormal stress.
- RUL Forecasting: Interpret RUL charts to forecast replacement timelines for critical components.
- Risk of Energy Loss: Review predicted energy loss to evaluate the financial impact of upcoming failures.
- Inventory Readiness: Check spare-parts readiness to ensure inventory levels support predicted maintenance.
- Degradation Drivers: Analyze predictive driver matrices to diagnose conditions accelerating wear.
- Workforce & Schedule Planning: Use maintenance backlog metrics to adjust workforce planning and scheduling.
Benefits of Wind Power Plant Reliability & Predictive Maintenance Dashboard
The following are the benefits of using this dashboard:
- Prevents Unplanned Downtime: Reduces unplanned downtime by identifying failures before they occur.
- Boosts Overall Reliability: Improves asset reliability through continuous health monitoring and diagnostics.
- Supports Predictive Strategy: Enables predictive maintenance with accurate RUL and failure forecasting.
- Optimizes Planning: Improves maintenance planning using workload predictions and component risk scores.
- Enhances Safety: Strengthens safety and compliance by identifying high-risk operational conditions.
- Reduces Maintenance Costs: Minimizes costs through targeted interventions and better spare-parts management.
- Extends Turbine Lifespan: Addresses component degradation early to extend asset life.
- Improves Efficiency: Provides clear visibility of failure drivers and outage patterns for better efficiency.
- Unified Analytics: Supports onshore and offshore fleet management with unified reliability reporting.
- Informed Decision-Making: Enhances decision-making by combining real-time and predictive insights.
KPIs to Track in Wind Power Plant Reliability & Predictive Maintenance Dashboard
The following key KPIs can be tracked by using this dashboard:
- Fleet Availability (%): Measures operational readiness of turbines.
- MTBF (hrs): Evaluates how frequently failures occur.
- MTTR (hrs): Tracks average repair duration.
- Forced Outage Rate (%): Indicates unexpected shutdown frequency.
- Asset Health Index (%): Shows the overall condition of turbine components.
- Critical Failure Rate (%): Highlights severe failure events.
- Component Health Score: Assesses performance of key subsystems.
- Failure Mode Downtime (hrs): Breaks down downtime contributions by failure type.
Frequently Asked Questions
Q1. Who uses this dashboard in wind power utilities?
Reliability engineers, maintenance teams, asset managers, operations analysts, and OEM service partners.
Q2. Does the dashboard support both onshore and offshore wind farms?
Yes. It functions as both an onshore and offshore reliability and diagnostics tool.
Q3. How does predictive maintenance reduce downtime?
By forecasting component failures early, operators can schedule interventions before breakdowns occur.