
What is a Fleet Efficiency Dashboard?
A Fleet Efficiency Dashboard is a centralized reporting solution for logistics and transportation companies that tracks fleet utilization, delivery performance, operating costs, and resource allocation. Monitoring key metrics such as utilization rate, average delivery time, fuel consumption, and maintenance costs helps organizations reduce expenses, improve on-time delivery, and maximize ROI. In today’s competitive industry, the best fleet efficiency dashboard for logistics companies empowers decision-makers with actionable insights to optimize operations and drive cost savings.
How to Create a Fleet Efficiency Dashboard
You don’t need to build your report from scratch-just start with a ready-to-use dashboard template from Mokkup. Add your data and export it as needed. Here’s how to do it:
1. Create or Log in to Your Mokkup Account
Start by signing up on Mokkup.ai using your email. If you already have an account, just log in, and you’ll be good to go.
2. Choose and Customize Your Dashboard Template
Find the Fleet Efficiency Dashboard template in the Templates section. Use the drag-and-drop editor to adjust KPIs, edit filters, or add elements based on your data.
3. Export to Your BI Tool
Once your dashboard wireframe is ready, use the BI Tool Export feature to send it directly to Power BI or Tableau for further analysis and enhancements. You can also download the dashboard as a PDF, PNG, or JPEG, embed it on a platform, or invite your team to collaborate.
Note: This is a Pro template. You’ll need a Pro subscription on Mokkup to use and customize this dashboard wireframe. Upgrade anytime to unlock full access.
Fleet Efficiency Dashboard Example
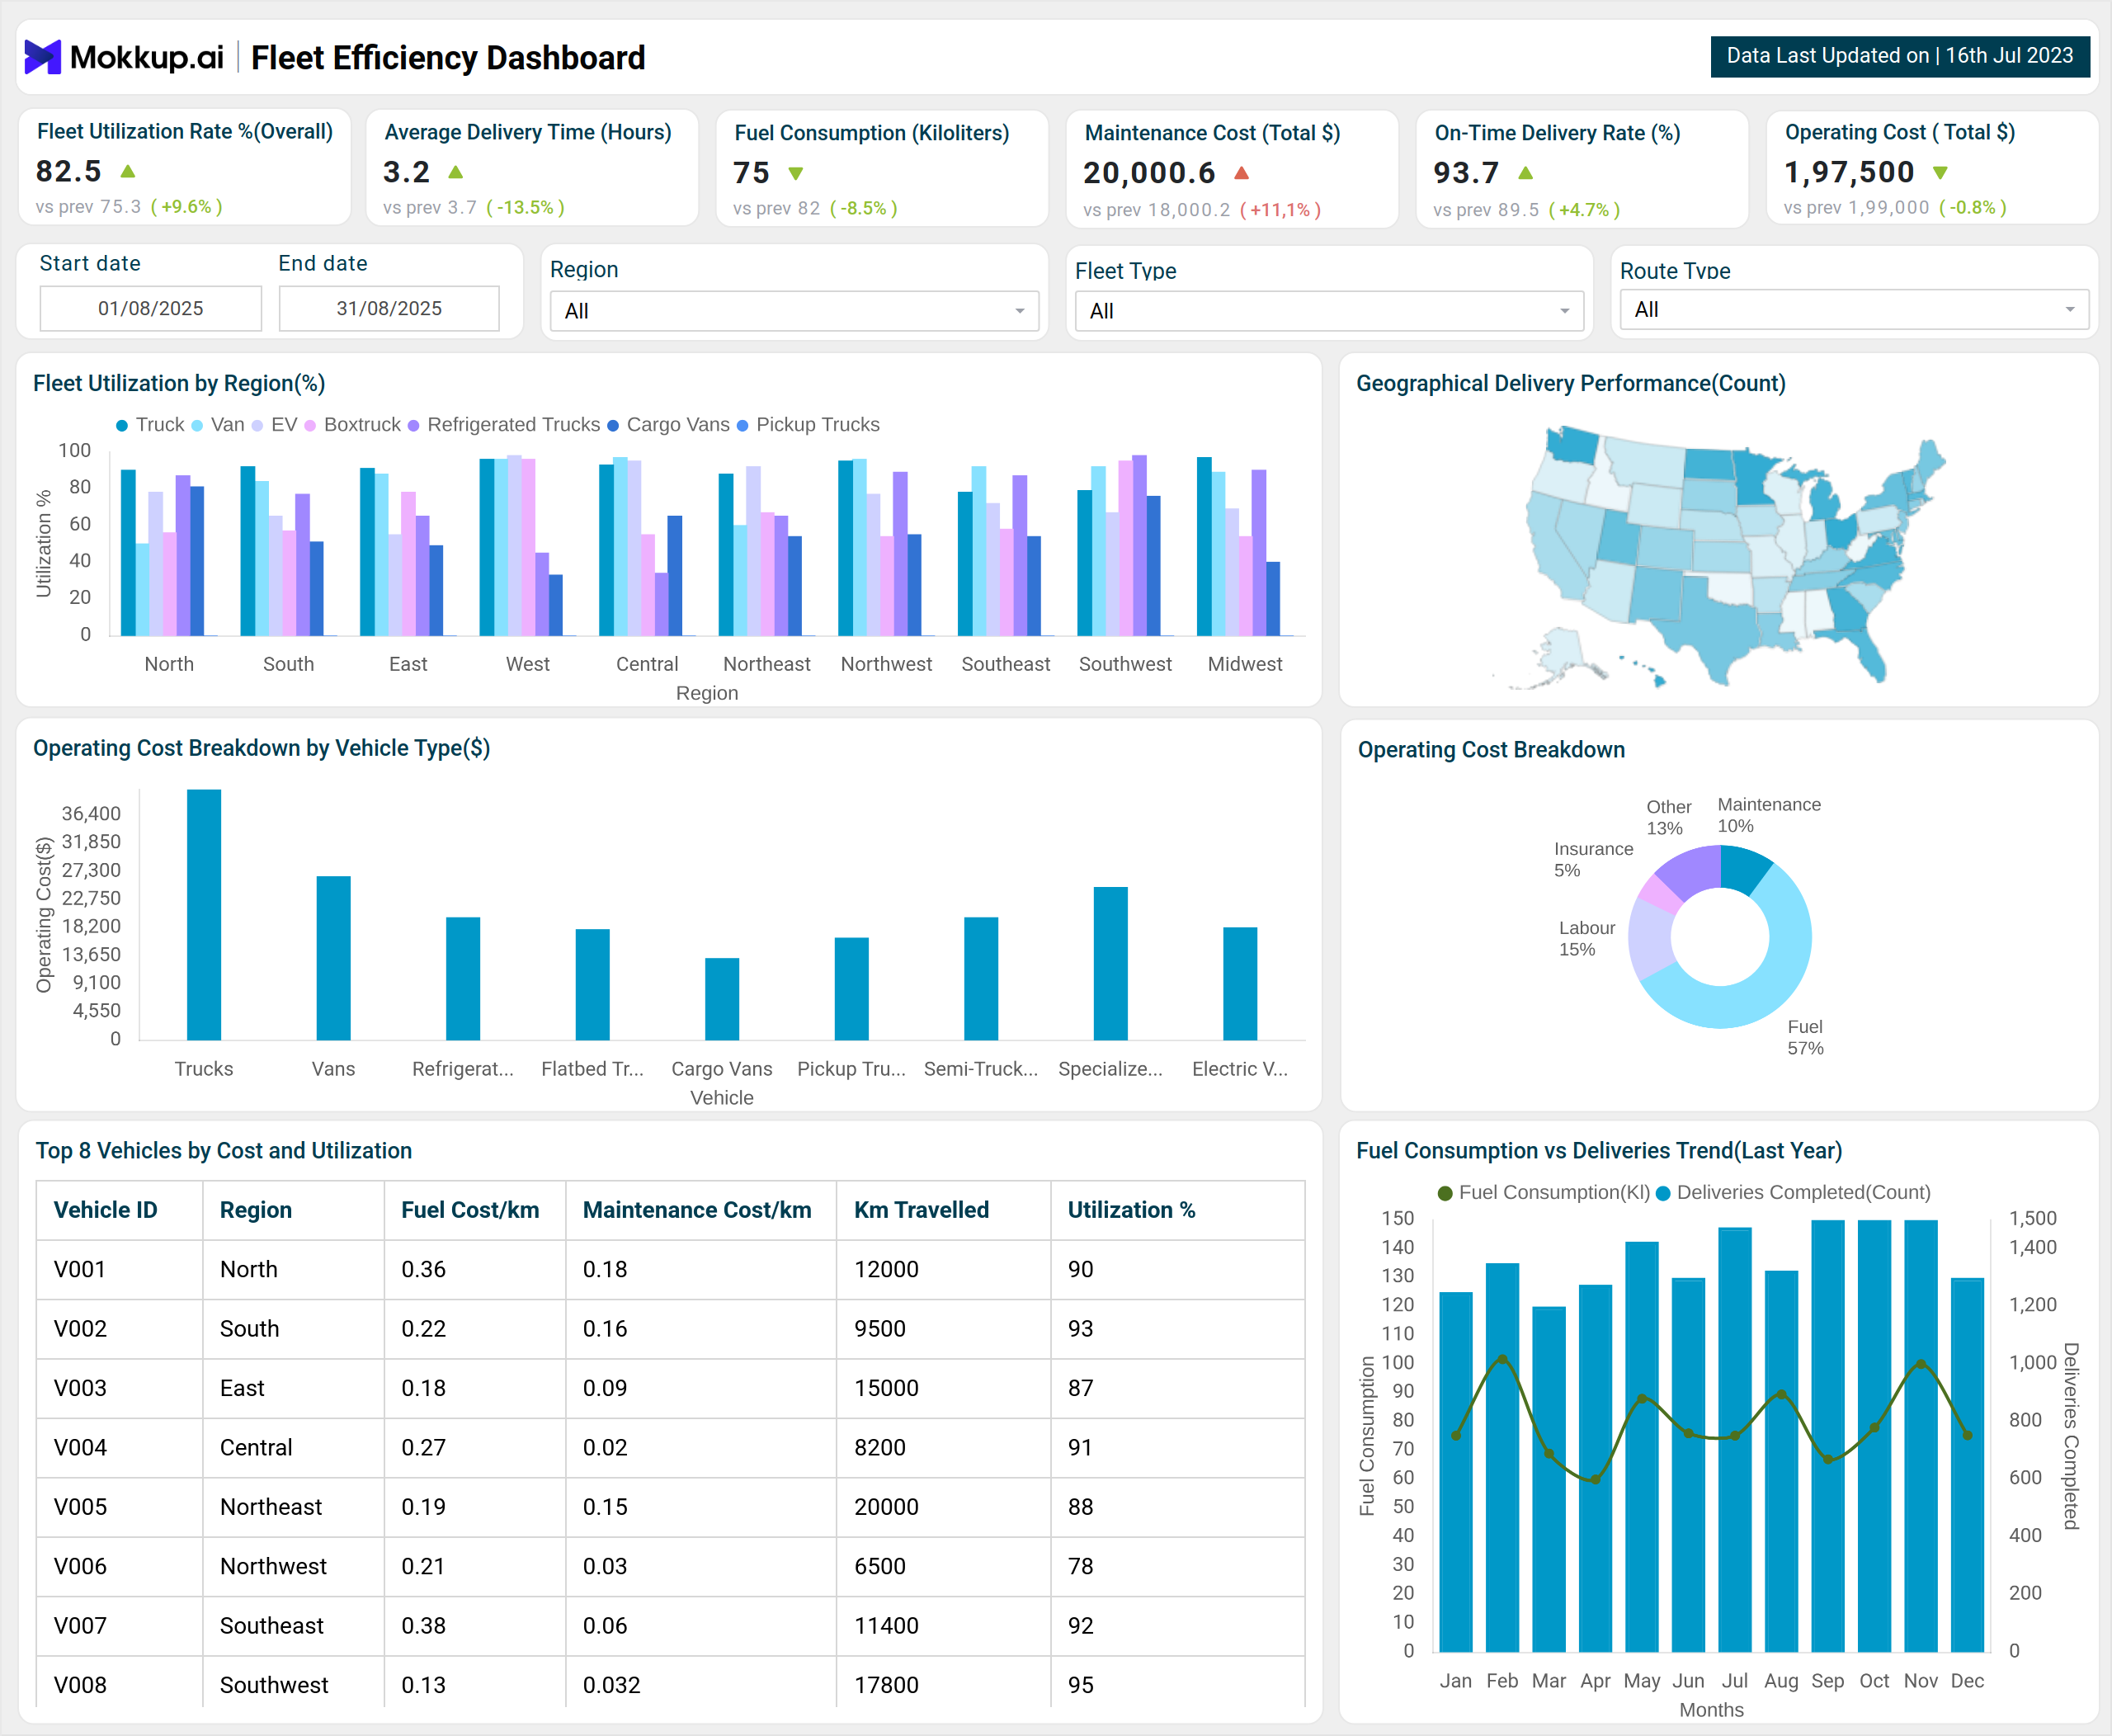
Create your personalized fleet management dashboard with delivery tracking to monitor all essential fleet metrics in one structured layout, where KPI cards provide a quick snapshot of fleet utilization, delivery time, operating costs, and on-time performance. The Utilization & Cost Overview highlights fleet utilization by region along with a detailed operating cost breakdown, while the Efficiency & Cost Drivers section displays fuel consumption trends against deliveries, identifies costly vehicles, and provides performance maps for deeper insights. With the help of filters and slicers, you can analyze data by date range, region, fleet type, and route type, making the entire setup the Fleet efficiency dashboard for reducing operating costs
that is highly interactive and actionable for better decision-making.
How to Analyze Data in Fleet Efficiency Dashboards
An effective fleet management dashboard with delivery tracking makes operational analysis intuitive:
- Track Utilization Trends -Compare utilization across regions and vehicle types.
- Analyze Operating Costs -Identify high-cost categories like fuel, maintenance, and labor.
- Evaluate Fuel Efficiency -Spot inefficiencies using fuel vs. delivery volume analysis.
- Identify High-Cost Vehicles -Pinpoint costly vehicles that require action.
- Monitor Regional Performance -Use geo maps to detect delivery hotspots.
With these features, the best way to measure fleet utilization and delivery performance becomes seamless and reliable.
Benefits of Fleet Efficiency Dashboards
- Centralized Monitoring -Offers a single unified platform where all fleet KPIs can be tracked, compared, and analyzed in real time, giving the best way to measure fleet utilization and delivery performance.
- Cost Optimization -Identifies inefficiencies in fuel consumption and maintenance activities to help reduce overall operating expenses.
- Better Utilization -Ensures vehicles are deployed in the right regions and schedules, maximizing their usage and efficiency.
- Improved On-Time Deliveries -Tracks delivery timelines, highlights delays, and helps optimize routes to improve punctuality.
- Smarter Resource Allocation -Enables efficient assignment of vehicles and drivers based on demand, workload, and route requirements.
KPIs to Track in Fleet Efficiency Dashboards
Here are five key KPIs with one-line explanations for fleet efficiency analytics for transportation companies:
- Fleet Utilization Rate (%) -Shows the percentage of vehicles actively used from the total fleet, indicating overall efficiency.
- Average Delivery Time -Tracks the average time required to complete deliveries, helping measure service performance.
- Fuel Consumption (kl) -Monitors total fuel usage across the fleet to assess mileage and fuel efficiency.
- Maintenance Cost ($) -Captures total spending on vehicle servicing, repairs, and upkeep to manage expenses.
- On-Time Delivery Rate (%) -Measures the percentage of deliveries completed within the scheduled timeframe.
- Operating Cost ($) -Tracks the overall cost of running and managing the fleet, including fuel, labor, and maintenance.
Frequently Asked Questions
1. What makes a fleet efficiency dashboard important for logistics companies?
It helps logistics and transportation companies track utilization, delivery performance, and operating costs in one place, making it the best way to measure fleet utilization and delivery performance.
2. Is this dashboard suitable for both small and large fleets?
Absolutely. Whether you manage a small set of vans or a large fleet across regions, the template scales to provide fleet efficiency analytics for transportation companies of any size.
3. Can I customize the dashboard based on my company’s needs?
Yes, the dashboard template allows full customization of KPIs, filters, and visual layouts so you can align it with your business goals.