
What is a Coal Power Generation Energy Efficiency Dashboard?
A Coal Power Generation Energy Efficiency Dashboard template is a strategic tool designed for plant managers, operations directors, and energy analysts to monitor and improve the performance of coal-fired power plants. It provides a clear view of key efficiency metrics, including thermal efficiency, heat rate, capacity factor, fuel costs, cost savings, and return on investment (ROI) from improvement projects. This dashboard wireframe serves as both a coal power plant efficiency tracking dashboard and a coal plant performance and reporting dashboard, enabling the tracking of operational performance, identification of inefficiencies, and measurement of the impact of upgrades, all in one centralized view.
How to Create a Coal Power Generation Energy Efficiency Dashboard
You don’t need to start from scratch. Simply use a ready-made Coal Power Generation Energy Efficiency Dashboard template from Mokkup. Customize it with your data and export it in your preferred format. Here’s how:
1. Create or Log in to Your Mokkup Account
Sign up on Mokkup.ai using your email address. Existing users can log in directly.
2. Choose and Customize Your Dashboard Template
Navigate to the Templates section and select the Coal Power Generation Energy Efficiency Dashboard. Use the drag-and-drop editor to modify KPIs, adjust filters, or add new elements based on your plant data.
3. Export to Your BI Tool
Once your dashboard wireframe is ready, export it to Power BI or Tableau for deeper analysis. You can also download it as a PDF, PNG, or JPEG, embed it on a platform, or invite team members to collaborate.
Note: This is a Pro template. A Mokkup Pro subscription is required to use and customize this dashboard. Upgrade anytime to unlock full access.
Coal Power Generation Energy Efficiency Dashboard Example
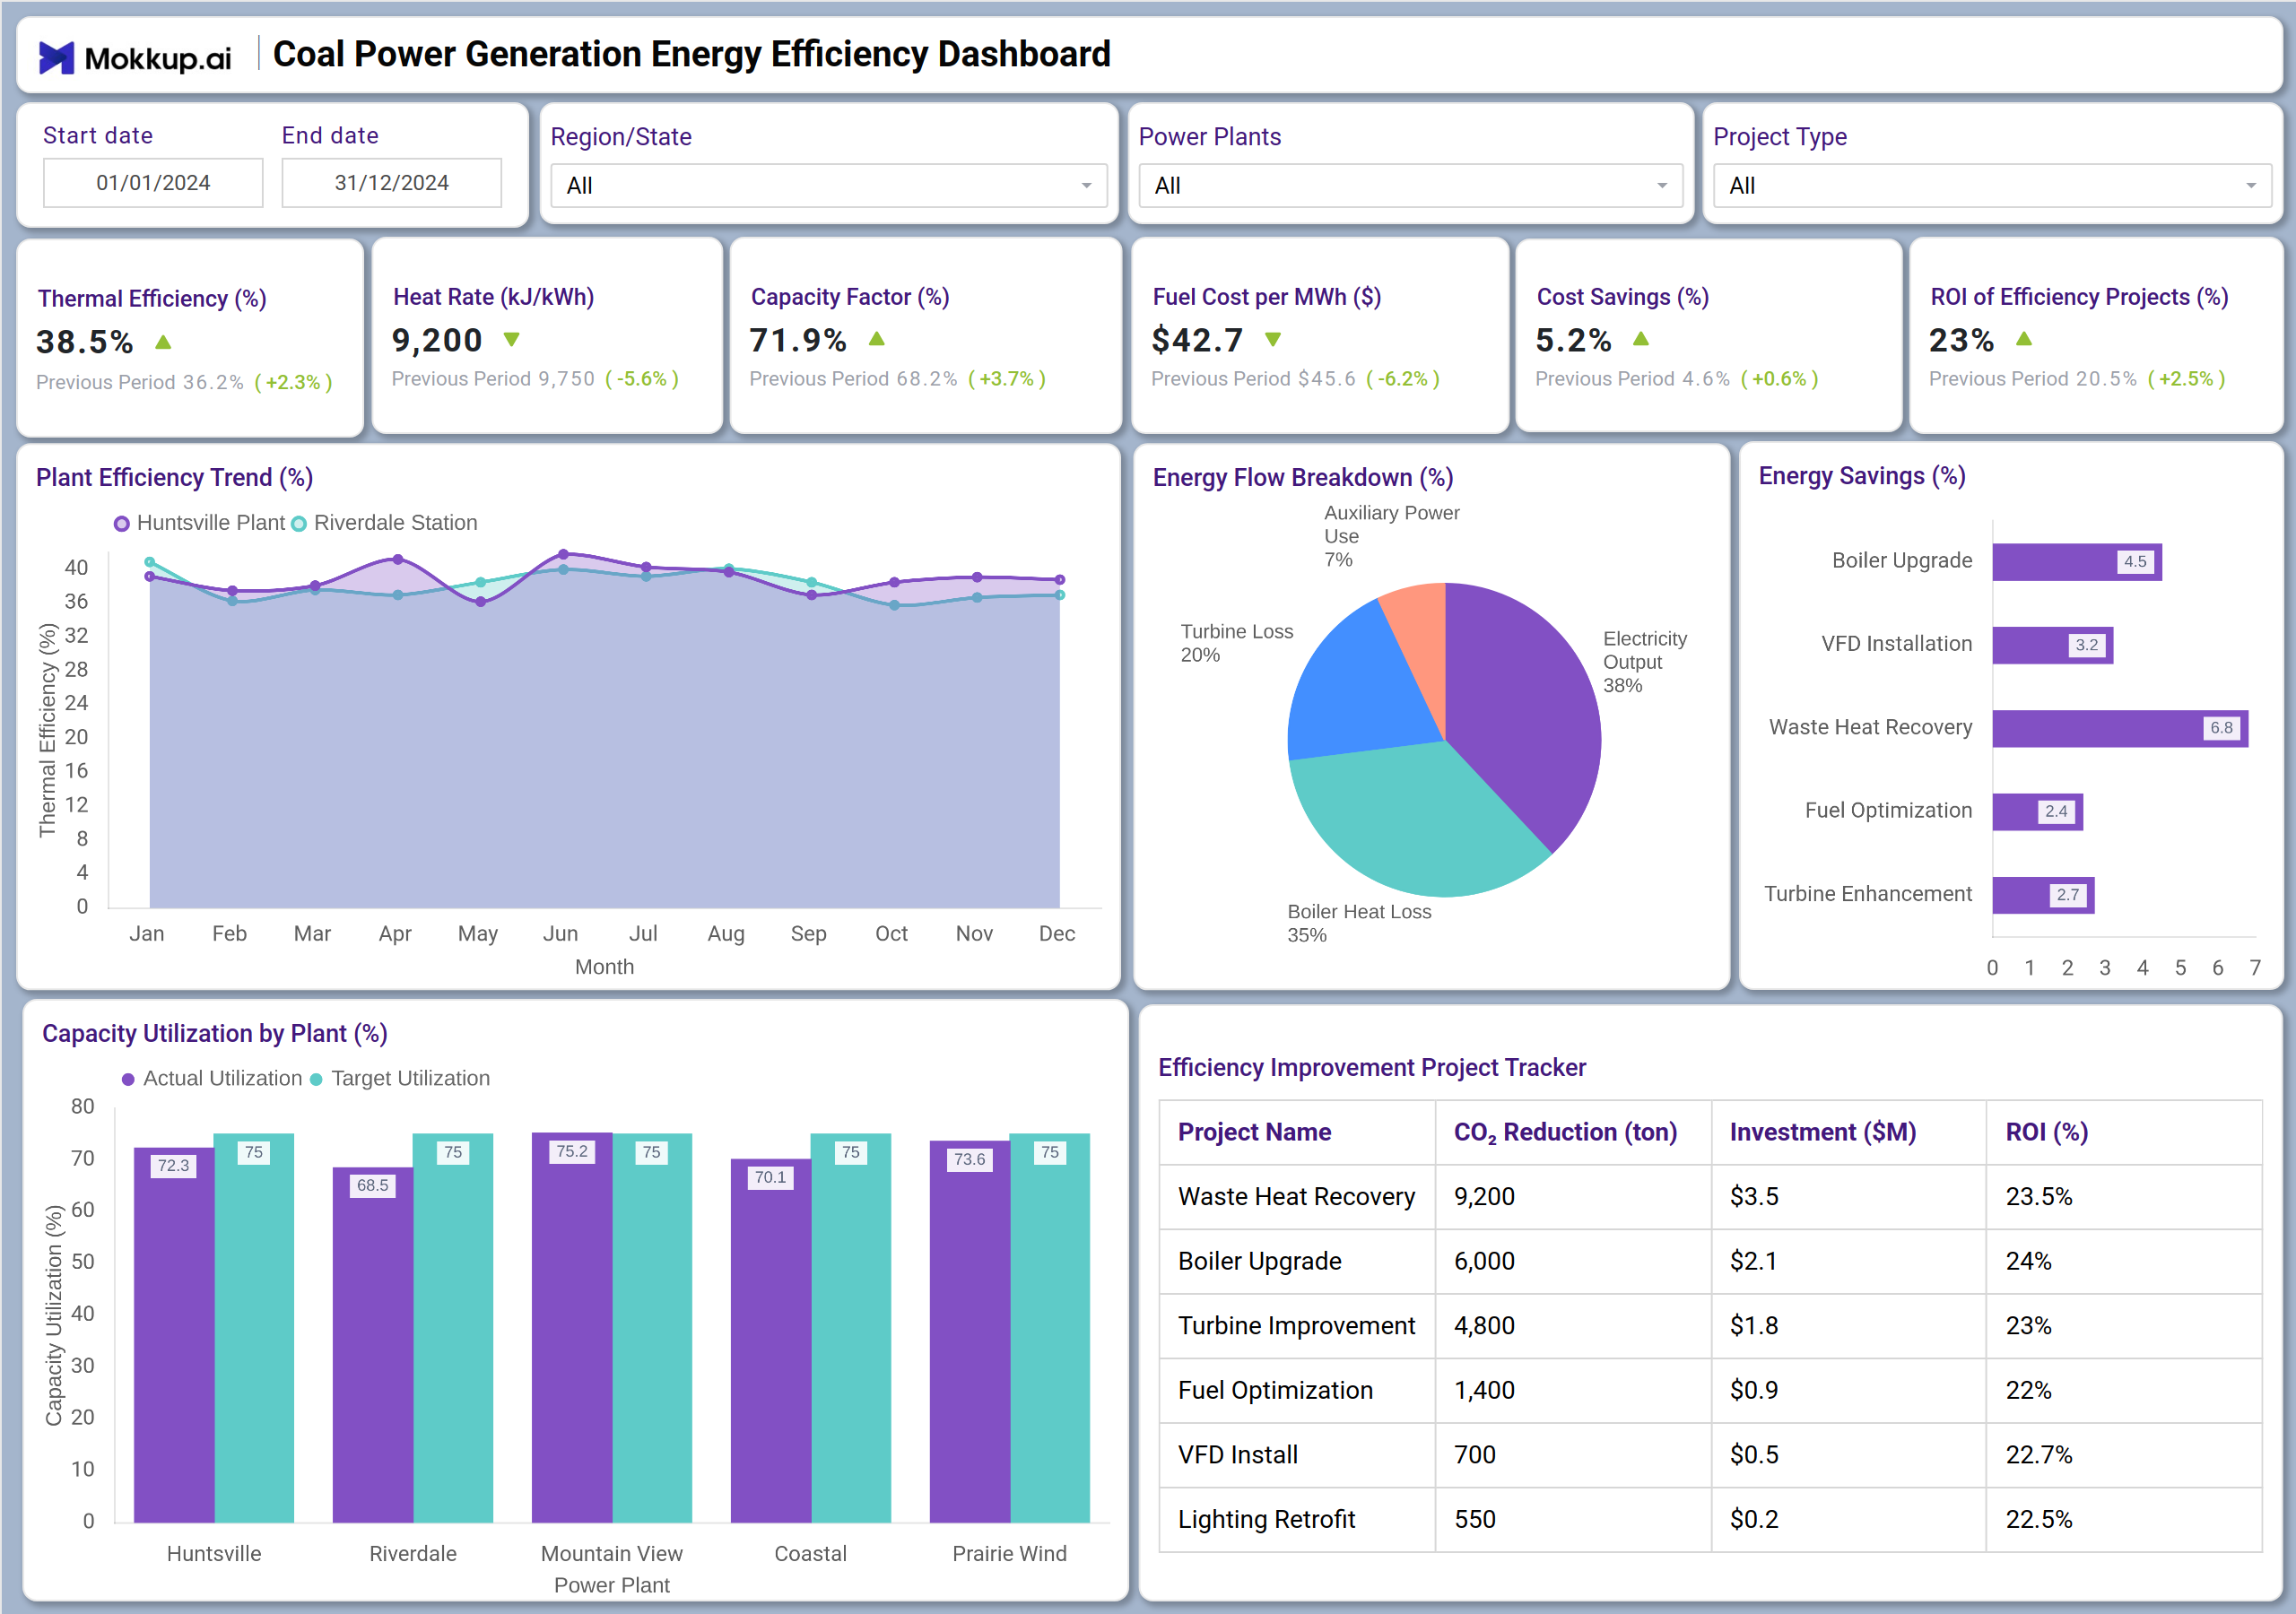
A Coal Power Generation Energy Efficiency Dashboard typically includes a mix of KPI tiles and visualizations. At the top, KPI cards display metrics like thermal efficiency, heat rate, capacity factor, fuel cost per kWh, cost savings, and ROI. Below, trend charts show plant efficiency over time, energy flow breakdowns, and the impact of efficiency projects. Bar charts compare capacity utilization across plants, and a project tracker lists CO₂ reductions, investments, and ROI. This layout helps stakeholders monitor both operational and financial performance effectively.
How to Analyze Data in Coal Power Generation Energy Efficiency Dashboards
Here’s how plant operators and managers can leverage the dashboard:
- Track Thermal Efficiency: Monitor the percentage of heat from coal that is converted into electrical energy.
- Monitor Heat Rate: Analyze the energy required to produce one kilowatt-hour (kWh) of electricity.
- Review Capacity Factor: Evaluate how frequently the plant operates at full capacity.
- Evaluate Fuel Cost Per kWh: Track the cost efficiency of fuel consumption.
- Measure Cost Savings: Identify financial savings from efficiency improvements.
- Assess ROI of Projects: Compare returns from different efficiency upgrade initiatives.
- Analyze Energy Flow: Understand where energy losses occur (e.g., boiler, turbine, auxiliary systems).
- Compare Plant Performance: Use bar charts to see how different plants utilize capacity.
- Track Project Benefits: Review CO₂ reductions and investments in improvement projects.
Benefits of Coal Power Generation Energy Efficiency Dashboards
Energy efficiency dashboards for coal power plants offer a centralized platform for monitoring, analyzing, and enhancing operational performance while striking a balance between sustainability and profitability goals:
- Improved Operational Insight: Clear view of efficiency trends and losses.
- Cost Reduction: Identifies areas to save on fuel and operational expenses.
- Informed Decision-Making: Data-driven support for maintenance and upgrades.
- Environmental Impact Tracking: Monitors CO₂ reductions from efficiency projects.
- Performance Benchmarking: Compare plants and projects to optimize resource allocation.
- ROI Visibility: Helps justify investments in efficiency improvements.
- Regulatory Compliance: Supports reporting and transparency for environmental and operational standards.
Together, these features make the dashboard a vital tool for improving both the economic and environmental performance of coal power plants. Many industry leaders consider it the best energy efficiency dashboard for coal power plants when aiming to balance output with sustainability.
KPIs to Track in Coal Power Generation Energy Efficiency Dashboards
Tracking these KPIs helps plants measure performance, identify inefficiencies, and implement effective energy-saving strategies:
- Thermal Efficiency (%): Percentage of heat converted into electrical energy.
- Heat Rate (kJ/kWh): Energy input needed to produce one unit of electricity.
- Capacity Factor (%): Ratio of actual output to maximum possible output.
- Fuel Cost per kWh ($): Cost of fuel per kilowatt-hour generated.
- Cost Savings (%): Percentage of costs saved through efficiency measures.
- ROI of Efficiency Projects (%): Return on investment from improvement initiatives.
- CO₂ Reduction (ton): Tons of carbon dioxide reduced due to projects.
- Plant Capacity Utilization (%): How effectively plant capacity is being used.
Frequently Asked Questions
Q1. Who should use a Coal Power Generation Energy Efficiency Dashboard?
Plant managers, operations directors, energy analysts, and sustainability officers are responsible for performance and efficiency.
Q2. Can this dashboard help reduce operational costs?
Yes. By tracking fuel costs, heat rate, and efficiency trends, plants can identify and act on cost-saving opportunities.
Q3. How does it support environmental goals?
It tracks CO₂ reductions from efficiency projects and helps monitor the environmental impact of plant operations.
Q4. Is the dashboard useful for reporting?
Yes. It serves as a dashboard for coal power plant efficiency reporting, supporting internal reviews and regulatory compliance.