
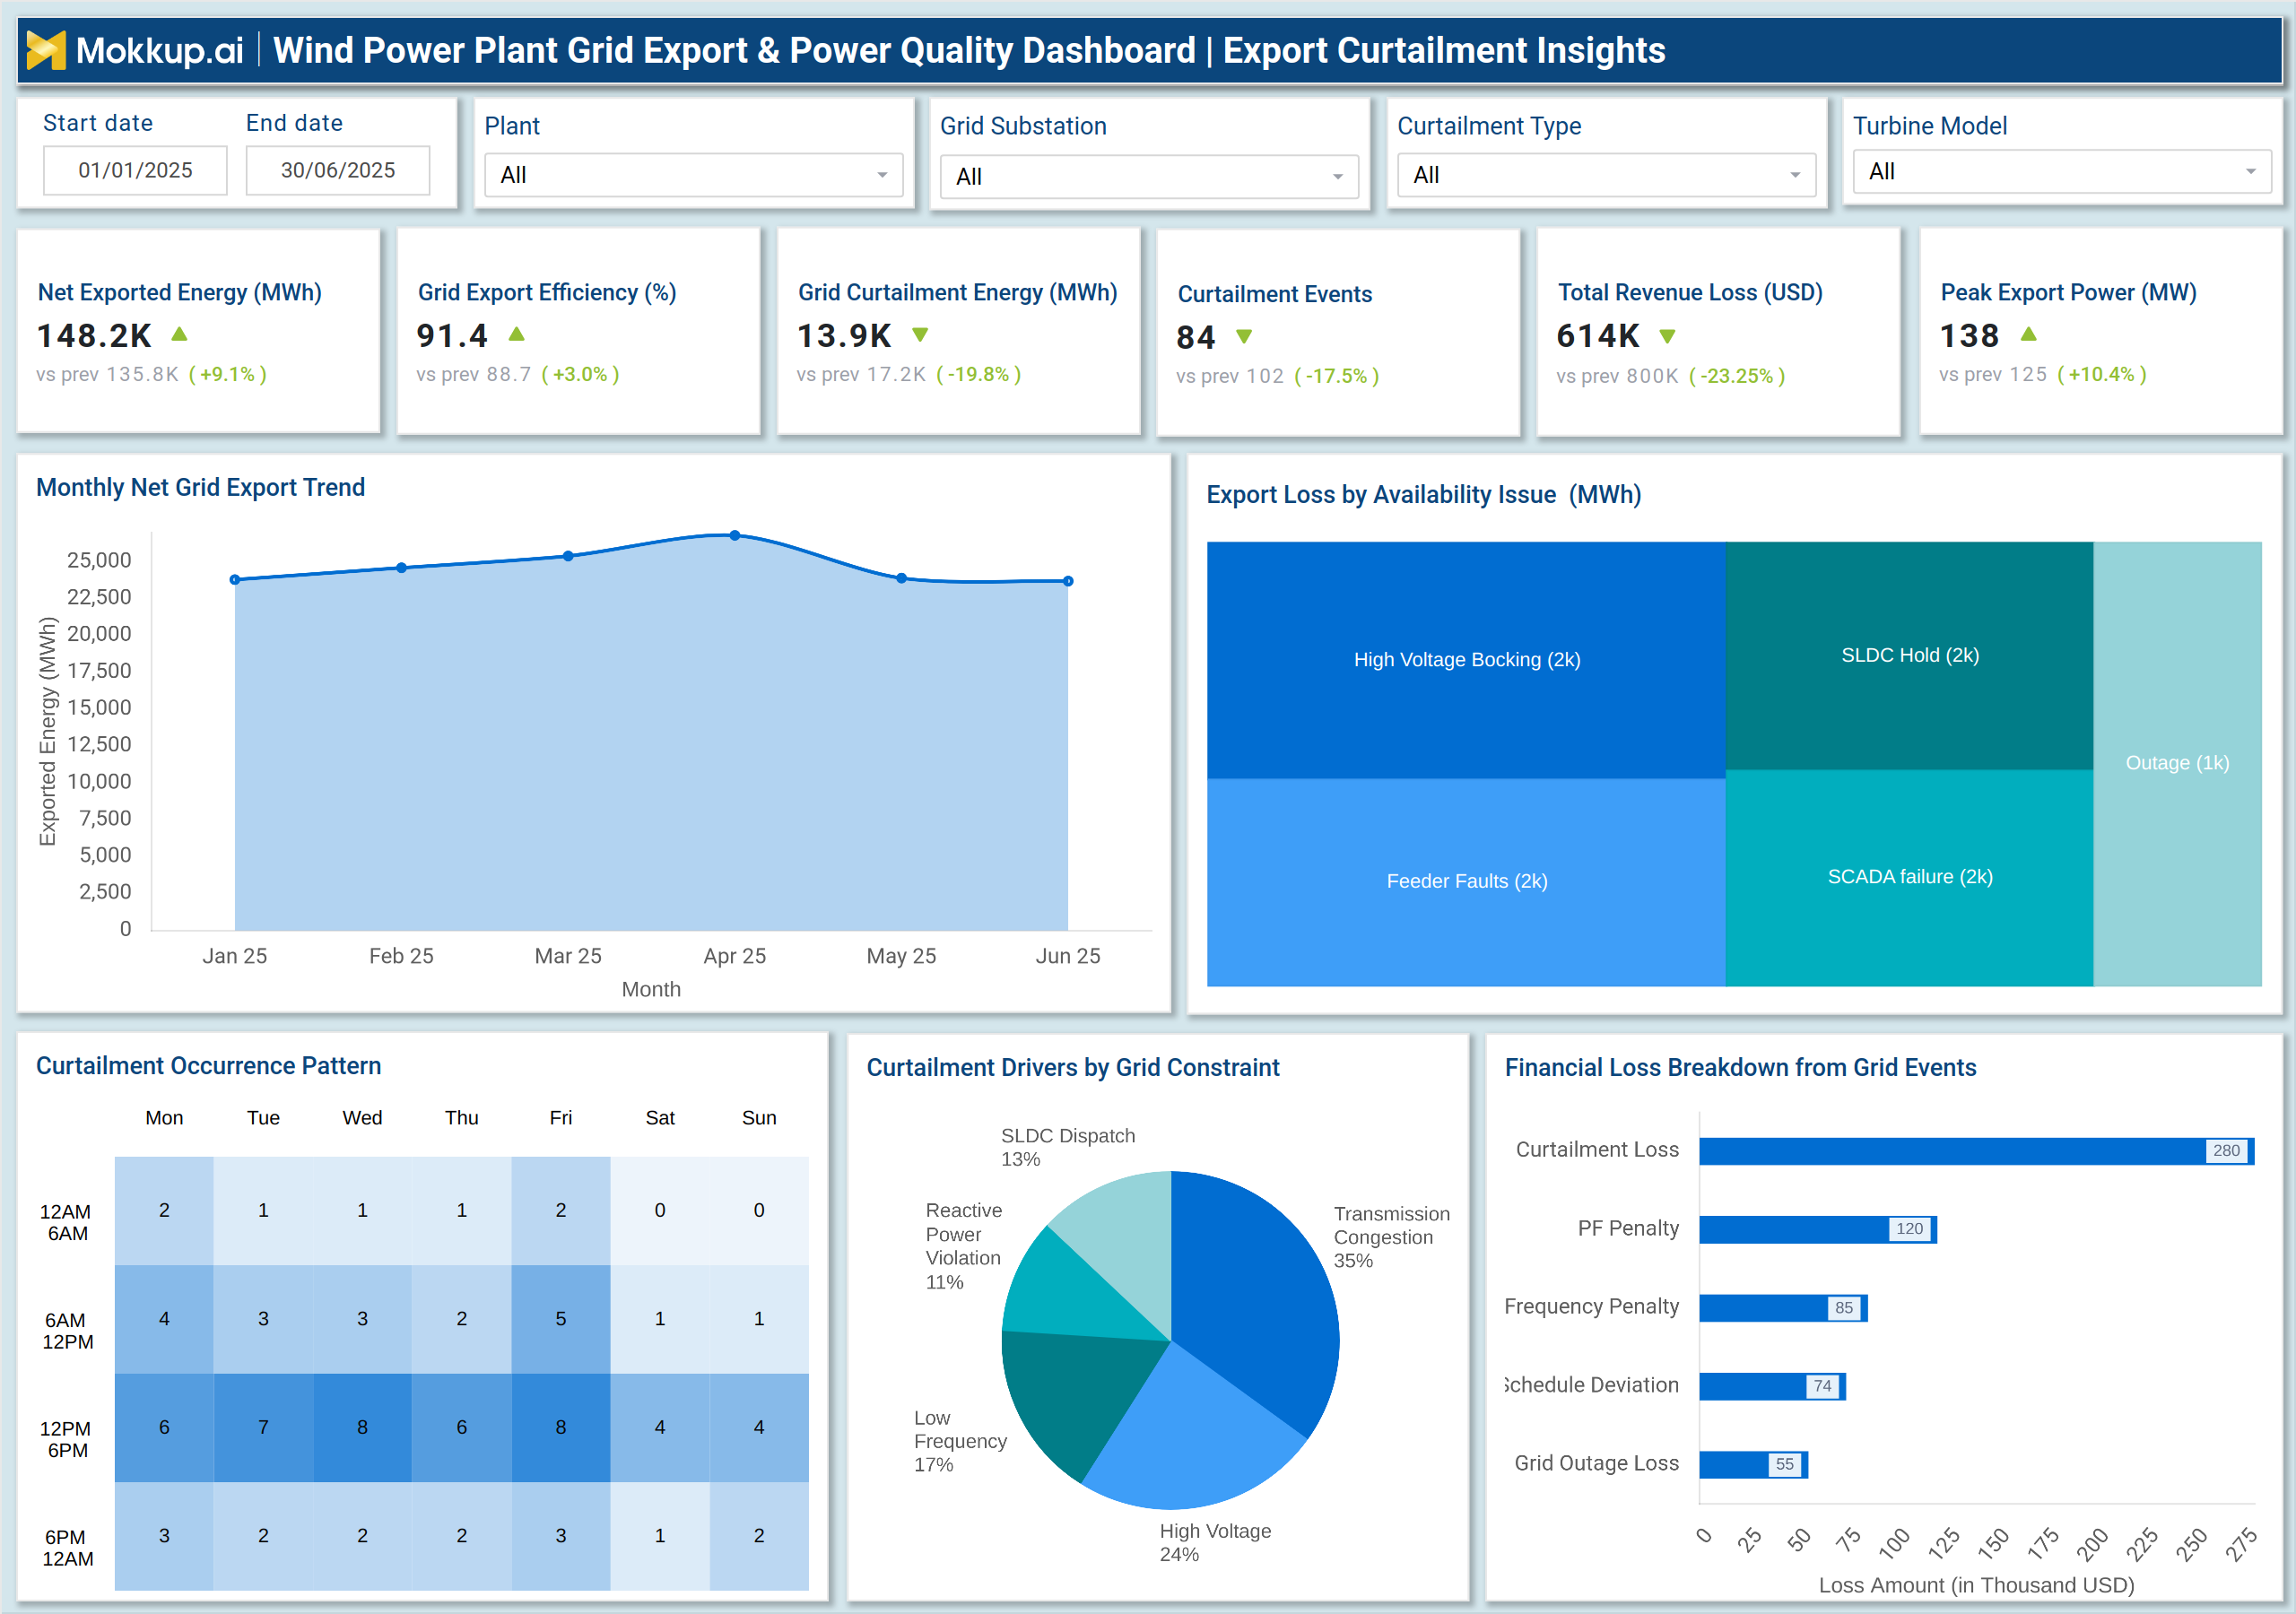
- Export Performance Optimization: Identifies curtailment patterns and grid constraints limiting power export.
- Regulatory Compliance Monitoring: Continuously tracks voltage, frequency, and harmonic limits.
- Revenue Loss Reduction: Highlights financial impacts of grid events and penalties.
- Operational Decision Support: Provides real-time insights for export and quality management.
- Improved Grid Stability: Analyzes disturbances and deviations to support stable grid interaction.
- Energy Delivery Optimization: Identifies peak export periods and constraint drivers.
- Unified Reporting: Supports both onshore and offshore wind assets in a single view.
- Power Injection Reliability: Reduces quality-related penalties and rejection risks.
- Grid Operator Transparency: Enables data-backed discussions with grid authorities.
- Export Forecasting Support: Uses historical trends to anticipate future export capacity.
What is a Wind Power Plant Grid Export & Power Quality Dashboard?
A Wind Power Plant Grid Export & Power Quality Dashboard template is an analytics system that tracks exported energy and monitors power quality across onshore and offshore wind farms. It functions as a wind power grid export dashboard, enabling utilities to evaluate export efficiency, curtailment energy, revenue loss, and peak export performance. The dashboard also serves as a wind plant power quality analytics tool, measuring voltage compliance, frequency stability, harmonic distortion, and power factor performance.
By combining export data with power quality indicators, it operates as a wind energy export performance tracker and a renewable grid integration monitoring tool. These insights support grid compliance, reduce penalties, improve operational reliability, and ensure wind plants deliver stable and high-quality power to the grid.
How to Create a Wind Power Plant Grid Export & Power Quality Dashboard
You don’t need to build your report from scratch, just start with a ready-to-use Wind Power Plant Grid Export & Power Quality dashboard template from Mokkup. Add in your data and export it however you like. Here’s how to do it:
1. Create or Log in to Your Mokkup Account
Start by signing up on Mokkup.ai using your email. If you already have an account, just log in, and you’ll be good to go.
2. Choose and Customize Your Dashboard Template
Find the Wind Power Plant Grid Export & Power Quality Dashboard template in the Templates section. Use the drag-and-drop editor to adjust KPIs, edit filters, or add elements based on your data.
3. Export to Your BI Tool
Once your dashboard wireframe is ready, use the BI Tool Export feature to send it directly to Power BI or Tableau for further analysis and enhancements. You can also download the dashboard as a PDF, PNG, or JPEG, embed it on a platform, or invite your team to collaborate.
Note: This is a Pro template. You’ll need a Pro subscription on Mokkup to use and customize this dashboard wireframe. Upgrade anytime to unlock full access.
Wind Power Plant Grid Export & Power Quality Dashboard Example
A typical dashboard is divided into two analytical areas: Export Curtailment Insights and Power Quality Stability. The Export section displays the net exported energy, export efficiency, curtailed energy, curtailed events, and revenue loss. A monthly export trend highlights seasonal patterns, while charts on availability issues show losses from high voltage blocking, feeder faults, SCADA failure, and SLDC holds. A curtailment occurrence heatmap reveals time periods with the most interruptions, and a driver chart identifies causes like transmission congestion, low frequency, and reactive power violations.
The Power Quality section tracks voltage, frequency, harmonics, power factor compliance, and disturbance events. Additional visuals show voltage deviation categories, frequency deviation patterns, harmonic distortion trends, and sag/swell events. These views offer valuable insights into wind turbine power quality, enabling utilities to maintain grid stability and meet compliance requirements.
How to Analyze Data in Wind Power Plant Grid Export & Power Quality Dashboard
Here is how you can analyze data from this dashboard:
- Assess Overall Export Performance: Begin with net exported energy and export efficiency to understand how effectively generated power is delivered to the grid.
- Identify Curtailment Impact: Review curtailment energy and event counts to identify operational or grid bottlenecks that affect exports.
- Quantify Revenue Loss: Analyze revenue loss values to measure the financial impact of grid constraints and curtailments.
- Track Export Trends: Study monthly export trends to identify seasonal patterns or recurring operational issues.
- Analyze Availability Loss: Utilize availability loss matrices to identify recurring export limitations across different time periods.
- Detect High-Risk Time Windows: Review curtailment heatmaps to identify hours or days with the highest curtailment risk.
- Understand Curtailment Drivers: Analyze driver breakdowns to distinguish between grid-side and plant-side causes.
- Evaluate Power Quality Compliance: Check voltage, frequency, harmonics, and power factor metrics against grid codes.
- Monitor Voltage Stability: Study voltage distribution charts to detect under-voltage or over-voltage conditions.
- Review Frequency Deviations: Use frequency heatmaps to monitor grid stability behavior over time.
- Track Harmonic Distortion: Analyze harmonic trends to identify deterioration in electrical quality.
- Isolate Grid Disturbances: Review disturbance breakdowns such as feeder trips, dips, or outages.
- Monitor Sag & Swell Events: Track sag and swell occurrences that may trigger turbine protection systems.
Benefits of Wind Power Plant Grid Export & Power Quality Dashboard
The following are the benefits of using this dashboard:
KPIs to Track in Wind Power Plant Grid Export & Power Quality Dashboard
The following key KPIs can be tracked by using this dashboard:
- Net Exported Energy (MWh): Total energy delivered to the grid.
- Grid Export Efficiency (%): Percentage of generated energy successfully exported.
- Grid Curtailment Energy (MWh): Energy lost due to grid constraints.
- Curtailment Events: Count of export interruptions.
- Total Revenue Loss (USD): Financial impact of curtailments and technical penalties.
- Peak Export Power (MW): Highest export achieved during the period.
- Voltage Compliance (%): Percentage of voltage values within threshold limits.
- Frequency Compliance (%): Degree of frequency stability during export.
- Harmonics Compliance (%): Adherence to limits for Total Harmonic Distortion (THD).
- Power Factor Compliance (%): Measures efficiency of reactive power usage.
- Grid Disturbance Events: Number of voltage dips, spikes, feeder trips, etc.
- Voltage Phase Imbalance (%): Indicates asymmetry across phases.
- Sag and Swell Event Counts: Tracks voltage fluctuations impacting equipment.
Frequently Asked Questions
Q1. Why is grid export monitoring important for wind plants?
It ensures stable energy delivery, reduces curtailment, and minimizes financial losses.
Q2. Can this dashboard support multiple substations or regions?
Yes, it aggregates export and quality data across all connected grid points.
Q3. How does power quality affect wind export?
Non-compliance with voltage, frequency, or harmonics can trigger penalties or curtailments.