
What is a Solar Plant Strategic Performance & Compliance Dashboard?
A Solar Plant Strategic Performance & Compliance Dashboard is a centralized analytical system that helps solar utilities monitor operational performance, strategic achievements, and regulatory adherence across assets. It functions as a solar plant strategic performance monitoring dashboard, enabling plant operators, compliance teams, and corporate leadership to evaluate core KPIs such as generation achievement, technical reliability, audit readiness, and regulatory compliance. This dashboard consolidates both operational and compliance data into a single interface, allowing electric utilities to track workforce readiness, risk exposure, corrective actions, and policy alignment. As a utility-scale solar compliance and operational oversight tool, it ensures that solar assets operate within regulatory frameworks while maintaining consistent performance. The platform also supports ESG-aligned reporting by integrating compliance alerts, environmental adherence, and governance metrics through a renewable energy governance and regulatory compliance reporting system.
How to Create a Solar Plant Strategic Performance & Compliance Dashboard
You don’t need to build your report from scratch—just start with a ready-to-use Solar Plant Strategic Performance & Compliance Dashboard template from Mokkup. Add in your data and export it however you like. Here’s how to do it:
1. Create or Log in to Your Mokkup Account
Start by signing up on Mokkup.ai using your email. If you already have an account, just log in, and you’ll be good to go.
2. Choose and Customize Your Dashboard Template
Find the Solar Plant Strategic Performance & Compliance Dashboard template in the Templates section. Use the drag-and-drop editor to adjust KPIs, edit filters, or add elements based on your data.
3. Export to Your BI Tool
Once your dashboard wireframe is ready, use the BI Tool Export feature to send it directly to Power BI or Tableau for further analysis and enhancements. You can also download the dashboard as a PDF, PNG, or JPEG, embed it on a platform, or invite your team to collaborate.
Note: This is a Pro template. You’ll need a Pro subscription on Mokkup to use and customize this dashboard wireframe. Upgrade anytime to unlock full access.
Solar Plant Strategic Performance & Compliance Dashboard Example
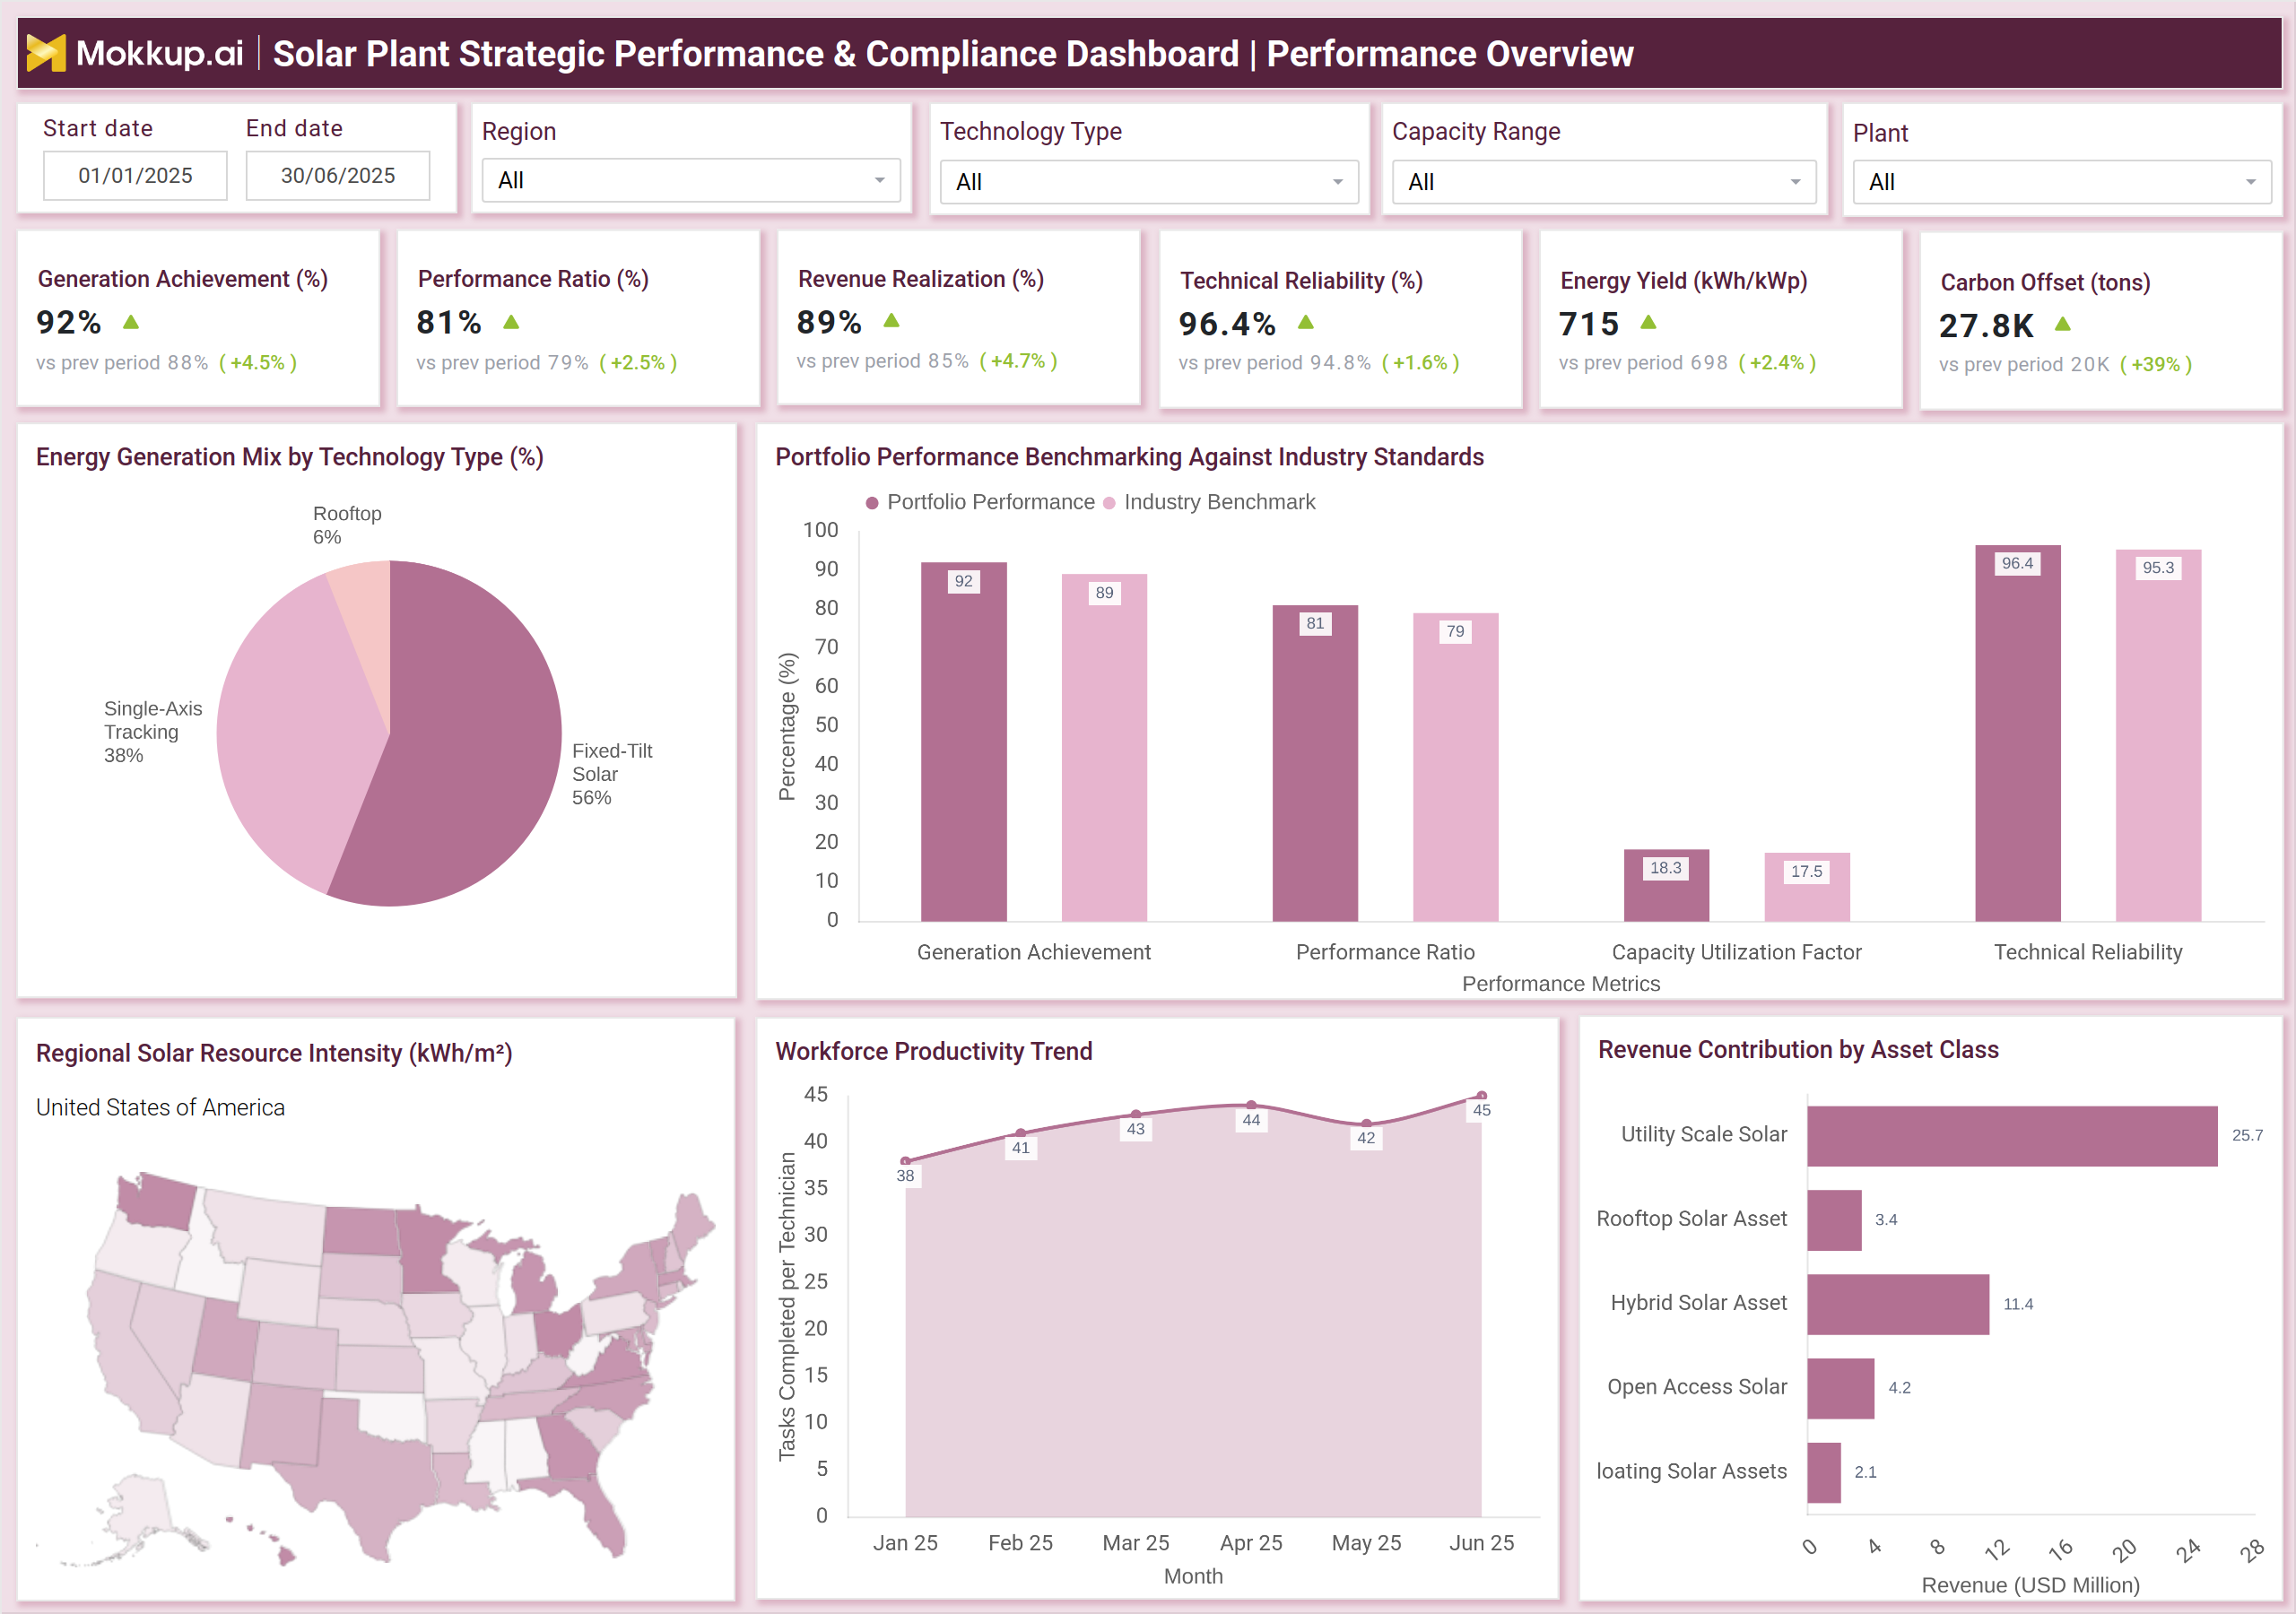
A practical example of the dashboard includes two major functional views: Performance Overview and Compliance & Risk Oversight, as shown in the reference visuals. In the Performance Overview, users can track strategic KPIs such as Generation Achievement, Revenue Realization, Technical Reliability, Performance Ratio, and Energy Yield. Benchmarking charts compare plant results against industry standards, making them a reliable tool for strategic KPI tracking and performance evaluation in solar power plants. Additional visuals—like energy mix distribution, resource intensity mapping, workforce productivity trends, and revenue contribution by asset class—provide a complete operational snapshot of the portfolio.
The Compliance & Risk Oversight screen adds visibility into adherence, audit readiness, policy compliance, incident-free days, environmental compliance, and risk exposure. Workforce training completion, non-compliance alerts, compliance activity distribution, and corrective action backlog analysis enable teams to monitor readiness across all units. This view functions as an electric utility solar portfolio compliance and audit analytics system, helping teams detect gaps, reduce risk, and improve governance quality. Together, these views create a unified solar energy operational performance and regulatory adherence dashboard for solar utilities seeking operational excellence and long-term compliance stability.
How to Analyze Data in a Solar Plant Strategic Performance & Compliance Dashboard
Here is how you can analyze data from this dashboard:
- Track generation achievement to confirm whether solar assets meet expected production levels.
- Analyze performance ratio trends to understand system efficiency across varying conditions.
- Review revenue realization to evaluate how operational output converts to financial performance.
- Assess technical reliability to identify performance stability and equipment readiness.
- Compare plant results against industry benchmarks to evaluate competitive standing.
- Interpret regional resource intensity to understand geographical conditions influencing generation.
- Evaluate workforce productivity to ensure maintenance and operations teams meet target activity levels.
- Review regulatory adherence metrics to confirm compliance with grid codes and renewable energy mandates.
- Track audit readiness and policy compliance to detect governance gaps.
- Monitor incident-free days and environmental compliance as indicators of operational safety and sustainability.
- Analyze non-compliance alerts to understand recurring issues and compliance patterns.
- Review the corrective action backlog to manage open items efficiently.
- Monitor risk exposure by category to identify operational, environmental, compliance, legal, and grid-related risks.
Benefits of Solar Plant Strategic Performance & Compliance Dashboard
The following are the benefits of using this dashboard:
- Provides consolidated transparency into performance, governance, and compliance.
- Enables faster decisions through real-time metrics and alerts.
- Supports regulatory submissions with structured compliance data.
- Improves plant reliability through trend-based performance evaluation.
- Enables workforce readiness tracking for safer operations.
- Reduces penalties through proactive regulatory adherence.
- Supports risk reduction by mapping exposure across operational and environmental categories.
- Helps utilities benchmark performance against industry standards.
- Improves audit preparation with centralized compliance documentation.
- Enhances asset-level profitability analysis using revenue contribution data.
KPIs to Track in a Solar Plant Strategic Performance & Compliance Dashboard
The following key KPIs can be tracked by using this dashboard:
- Generation Achievement (%) – Measures the actual vs. expected energy output.
- Performance Ratio (%) – Indicates system efficiency after losses.
- Revenue Realization (%) – Shows conversion of energy generation to revenue.
- Technical Reliability (%) – Tracks equipment uptime and consistency.
- Energy Yield (kWh/kWp) – Evaluates performance normalized to installed capacity.
- Carbon Offset (tons) – Measures environmental impact reduction.
- Regulatory Adherence Rate (%) – Monitors compliance with required standards.
- Audit Readiness Score (%) – Indicates preparedness for internal and external audits.
- Policy Compliance Index (%) – Measures alignment with corporate and regulatory policies.
- Incident-Free Days – Tracks operational safety performance.
- Environmental Compliance (%) – Ensures adherence to eco-regulations.
- Portfolio Risk Exposure Index – Quantifies risk impact across categories.
- Workforce Compliance Training (%) – Tracks training completion across topics.
- Non-Compliance Alerts Count – Measures recurring compliance deviations.
- Corrective Action Aging – Tracks progress in addressing open compliance issues.
Frequently Asked Questions
1. Who uses a strategic performance and compliance dashboard?
Operations teams, compliance officers, asset managers, ESG teams, auditors, and corporate leadership in solar utilities.
2. Why is compliance monitoring critical for solar plants?
It helps avoid penalties, ensures regulatory adherence, maintains grid stability, and supports safe operations.
3. How does this dashboard support governance frameworks?
It provides structured data for audits, environmental compliance, safety reporting, and policy tracking.