What is a Wind Power Plant Executive Performance Dashboard?
A Wind Power Plant Executive Performance Dashboard is a centralized performance intelligence system that enables utility leaders to monitor the operational, financial, and sustainability performance of onshore and offshore wind assets. As a wind power plant executive performance dashboard, it provides a consolidated view of generation output, turbine reliability, fleet availability, revenue performance, workforce readiness, and cost distribution.
The dashboard functions as a utility wind energy executive monitoring tool, offering strategic insights that help executives understand variations in asset performance, evaluate operational risks, and inform more informed decision-making. It also serves as a renewable wind farm KPI reporting system by integrating generation, safety, O&M cost, and sustainability indicators into a single executive view. Through visuals and multi-site analytics, the dashboard enhances leadership oversight across large wind portfolios.
How to Create a Wind Power Plant Executive Performance Dashboard
You don’t need to build your report from scratch, just start with a ready-to-use dashboard template from Mokkup. Add in your data and export it however you like. Here’s how to do it:
1. Create or Log in to Your Mokkup Account
Start by signing up on Mokkup.ai using your email. If you already have an account, just log in, and you’ll be good to go.
2. Choose and Customize Your Dashboard Template
Find the Wind Power Plant Executive Performance Dashboard template in the Templates section. Use the drag-and-drop editor to adjust KPIs, edit filters, or add elements based on your data.
3. Export to Your BI Tool
Once your dashboard wireframe is ready, use the BI Tool Export feature to send it directly to Power BI or Tableau for further analysis and enhancements. You can also download the dashboard as a PDF, PNG, or JPEG, embed it on a platform, or invite your team to collaborate.
Note: This is a Pro template. You’ll need a Pro subscription on Mokkup to use and customize this dashboard wireframe. Upgrade anytime to unlock full access.
Wind Power Plant Executive Performance Dashboard Example
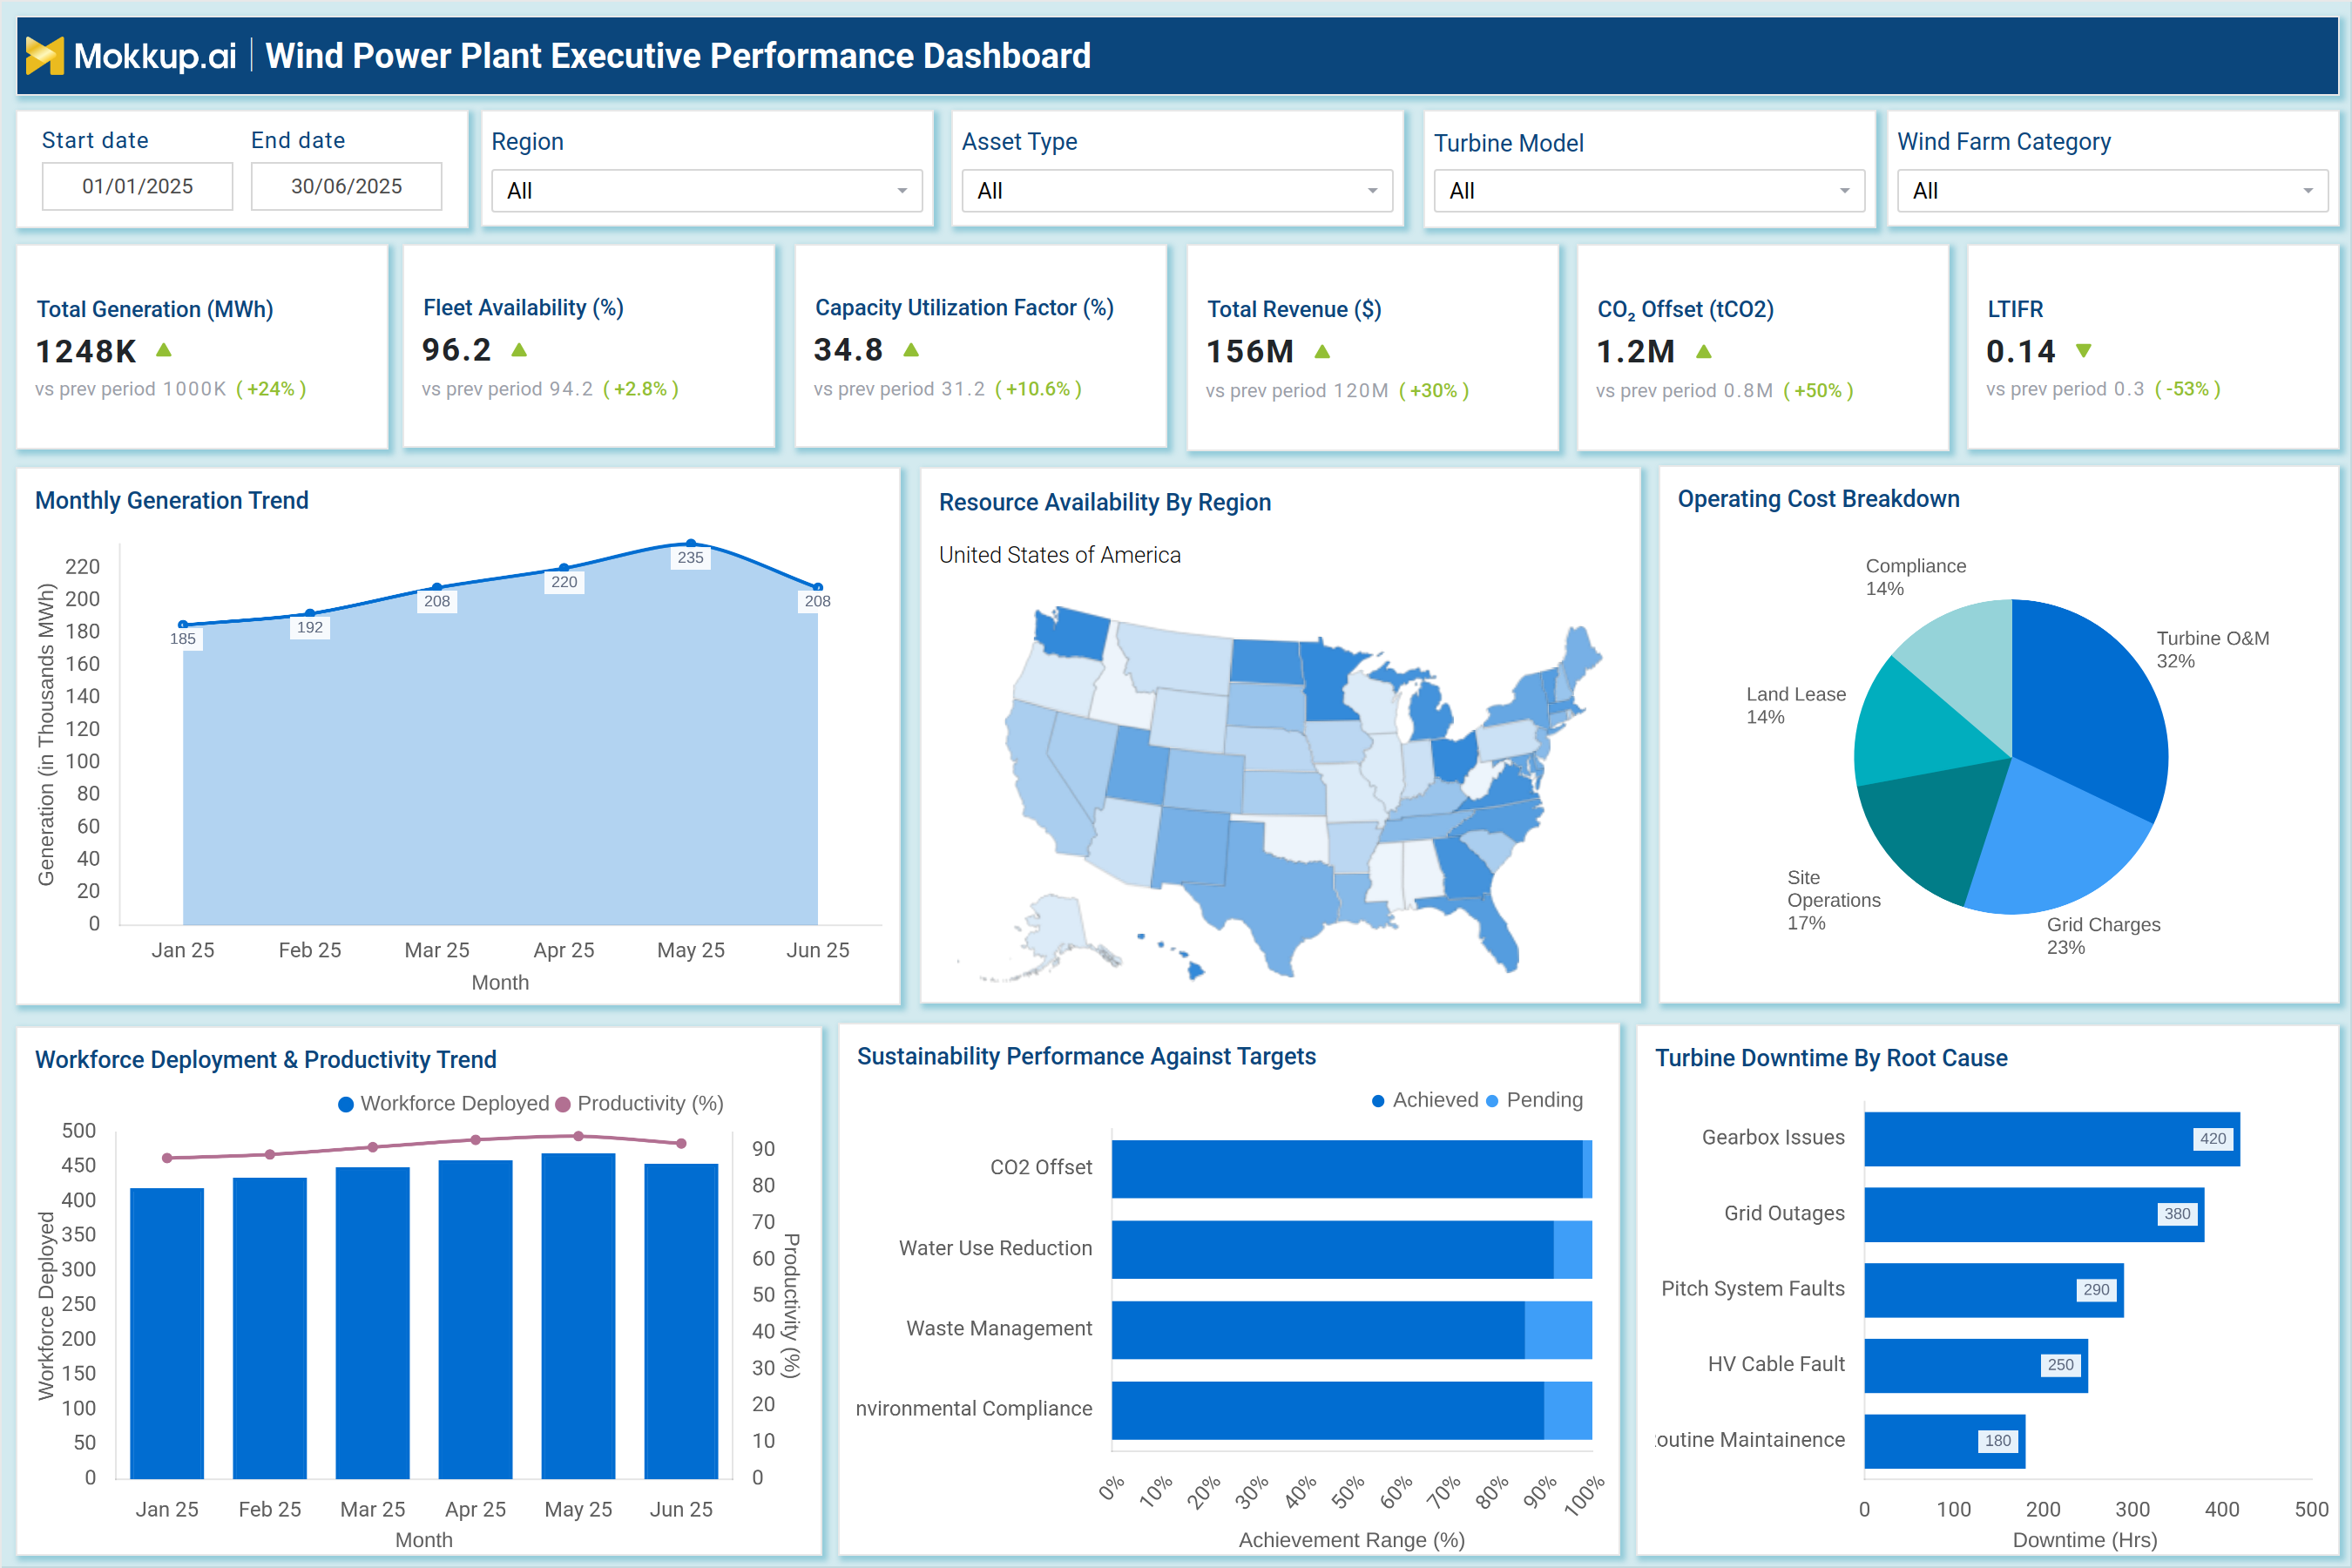
An example of this dashboard includes several key components designed for senior leadership visibility. Top-level KPIs, including Total Generation (MWh), Fleet Availability, Capacity Utilization Factor (CUF), Total Revenue, CO₂ Offset, and LTIFR, provide a strategic understanding of wind power performance. These indicators help determine whether wind assets are operating efficiently and producing expected output under varying wind resource conditions. This approach aligns with the purpose of an onshore offshore wind performance analytics system. The Monthly Generation Trend chart displays actual versus target generation, allowing for the identification of seasonal wind variations or turbine downtime events that impact output. A Resource Availability map highlights wind resource strength across regions, enabling executives to compare geographic production conditions.
The Operating Cost Breakdown chart provides transparency into OPEX across turbine operations and maintenance (O&M), grid charges, site operations, land lease, and compliance. Workforce Deployment & Productivity Trends show how staffing and skill levels influence operational output. Sustainability Performance visuals evaluate performance against targets, including CO₂ offset, waste management, environmental compliance, and water use reduction. Turbine Downtime by Root Cause highlights issues such as gearbox failures, pitch system faults, grid outages, HV cable faults, and maintenance delays, making this dashboard a practical tool for wind turbine reliability and availability. Finally, output and downtime analytics support wind energy curtailment and output reporting, essential for executives managing large wind portfolios.
How to Analyze Data in a Wind Power Plant Executive Performance Dashboard
Here is how you can analyze data from this wind turbine reliability and availability dashboard:
- Generation Performance Trends: Analyze how actual power output compares with targets to spot deviations and optimize operational planning.
- Fleet Availability (%): Track the uptime of all turbines to assess reliability and identify units requiring maintenance attention.
- Capacity Utilization Factor (CUF): Measures how efficiently each site and turbine is converting wind resources into actual energy production.
- Regional Wind Resource Availability: Evaluate how varying wind conditions across locations impact generation performance.
- Operating Cost Distribution: Identify which cost categories, maintenance, logistics, or spare parts are driving overall OPEX.
- Revenue Trends: Monitor income patterns to understand financial health and detect fluctuations tied to generation changes.
- CO₂ Offset Metrics: Assess how much carbon emission reduction the wind operations are delivering toward sustainability goals.
- Workforce Productivity: Analyze workforce efficiency to understand how manpower levels correlate with energy output and maintenance quality.
- Downtime Root Causes: Identify recurring mechanical, environmental, or grid-related issues that are reducing turbine availability.
- Sustainability Target Achievement: Review progress toward environmental and ESG commitments at both site and organizational levels.
Benefits of a Wind Power Plant Executive Performance Dashboard
- Centralized Visibility Across All Wind Sites: Provides a unified view of onshore and offshore assets, simplifying multi-site monitoring and management.
- Better Executive Decision-Making: Delivers actionable KPIs that help leaders prioritize investments and interventions.
- Enhanced Turbine Reliability Tracking: Supports detailed analysis of turbine performance and availability patterns.
- Identification of Production Losses: Helps detect curtailments, low-wind events, and inefficiencies that impact overall generation.
- Stronger Financial Oversight: Offers clear visibility into revenue, OPEX, and profitability drivers.
- Improved Sustainability Management: Tracks environmental performance indicators to align with ESG and compliance metrics.
- Optimized Workforce & Resource Allocation: Helps allocate manpower and resources based on productivity insights and operational needs.
- Early Risk Detection: Enables timely identification of mechanical failures, grid issues, and operational hazards.
- Benchmarking Across Regions & Turbine Types: Facilitates comparison of performance metrics to highlight best-performing sites and assets.
- Better Long-Term Asset Planning: Supports forecasting, life cycle management, and performance improvement strategies.
KPIs to Track in a Wind Power Plant Executive Performance Dashboard
The following key KPIs can be tracked by using this dashboard:
- Total Generation (MWh) – Measures energy produced across wind assets.
- Fleet Availability (%) – Indicates operational readiness of turbine fleets.
- Capacity Utilization Factor (%) – Evaluates efficiency relative to installed capacity.
- Total Revenue ($) – Tracks income from energy sales.
- CO₂ Offset (tCO₂) – Measures environmental impact reduction.
- LTIFR (Lost Time Injury Frequency Rate) – Tracks workforce safety performance.
- Operating Cost Breakdown – Identifies cost contributions from key O&M categories.
- Regional Resource Availability – Shows wind resource strength and production potential.
- Workforce Productivity (%) – Measures how effectively staff support operations.
- Downtime by Root Cause – Reveals reasons for turbine underperformance.
- Sustainability Target Achievement – Tracks environmental and compliance metrics.
Frequently Asked Questions
1. Who uses this dashboard?
Utility executives, asset managers, commercial teams, O&M leadership, sustainability officers, and performance analysts in wind power companies.
2. Does this dashboard support both onshore and offshore assets?
Yes. It provides unified KPI reporting across both asset categories.
3. How does it help with turbine performance issues?
Downtime enables mapping and reliability KPIs, making it easier to identify and address turbine-specific failures.