
What is an Environmental Compliance Dashboard?
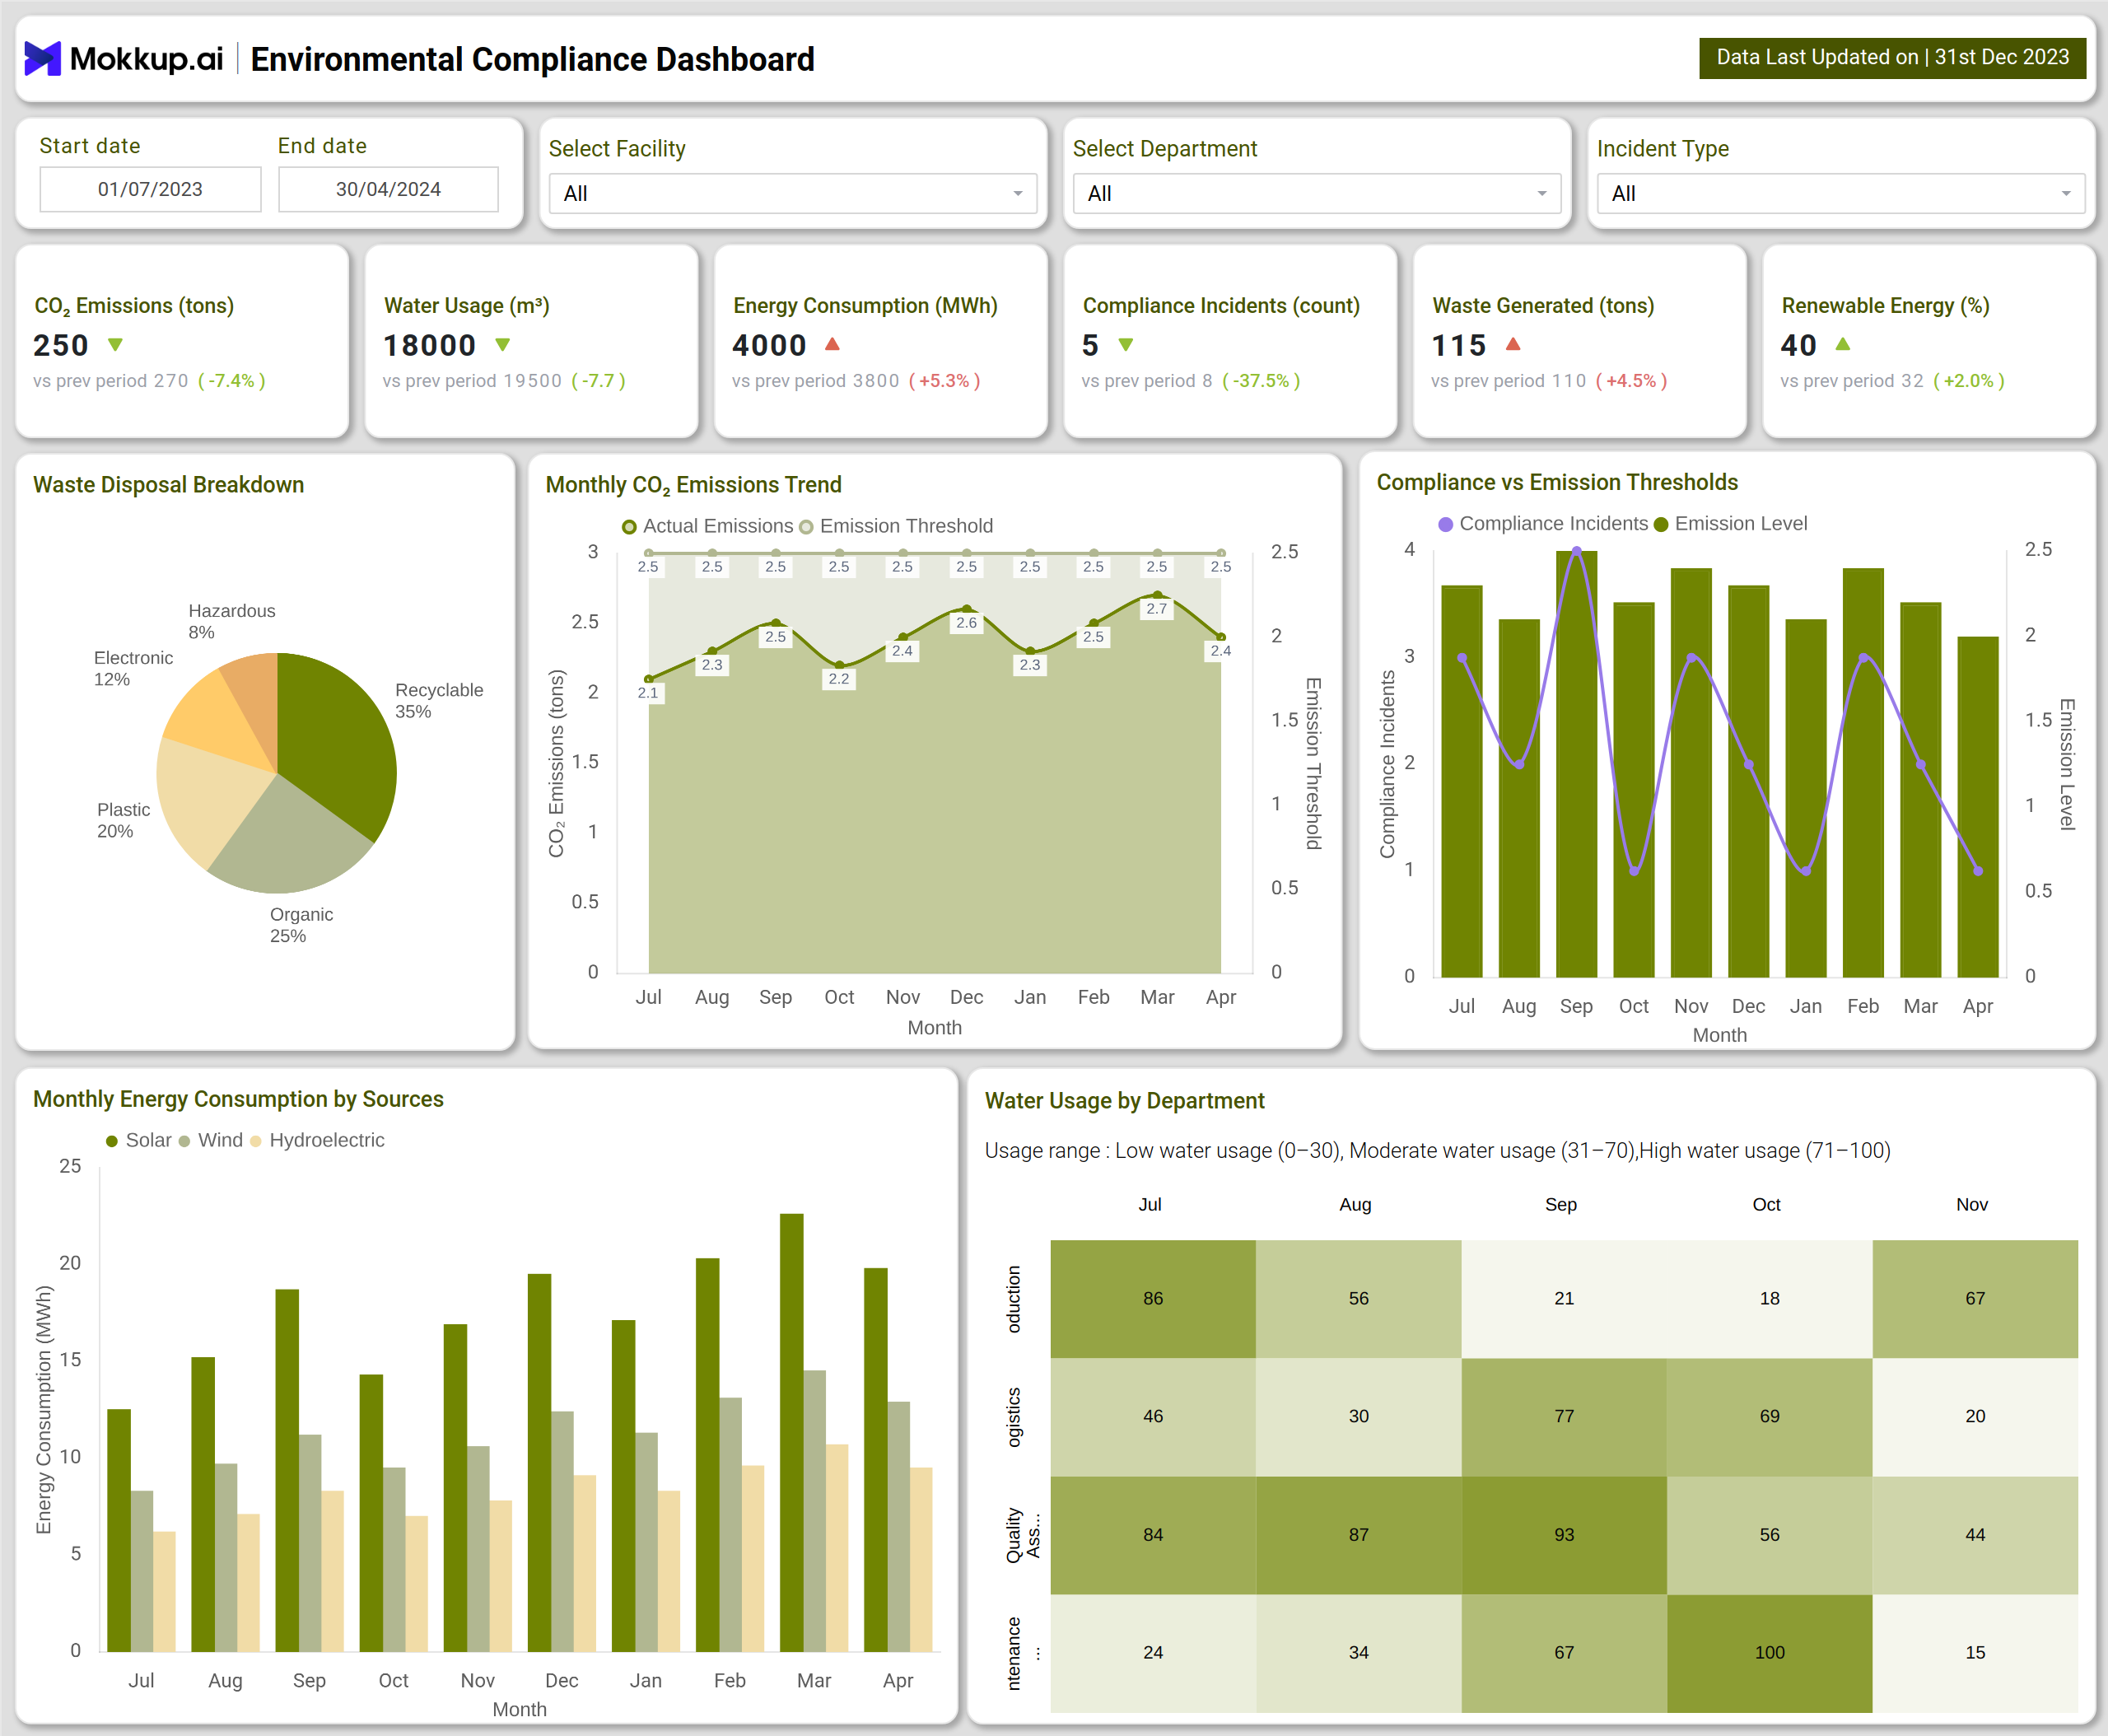
An Environmental Compliance Dashboard is a monitoring and reporting tool that helps organizations track their sustainability performance. It consolidates compliance KPIs such as CO₂ emissions, water usage, energy consumption, waste generation, renewable energy adoption, and compliance incidents into a single, real-time view.
The environmental compliance dashboard template centralizes this data, enabling organizations to assess resource efficiency, manage risks, and ensure regulatory alignment. For industries subject to strict environmental regulations, this real-time compliance monitoring dashboard is critical in achieving sustainability goals and avoiding costly penalties.
How To Create Environmental Compliance Dashboards
You don’t need to build your report from scratch—just start with a ready-to-use sample Environmental Compliance Dashboard template from Mokkup. Plug in your own data and export it however you like. Here’s how to do it:
1. Create or Log in to Your Mokkup Account
Start by signing up on Mokkup.ai using your email. Already have an account? Just log in, and you’re good to go.
2. Choose and Customize Your Dashboard Template
Find the Environmental Compliance Dashboard Template in the Templates section. Use the drag-and-drop editor to adjust KPIs, edit filters, or add elements based on your data.
3. Export to Your BI Tool
Once your dashboard is ready, use the BI Tool Export feature to send it directly to Power BI or Tableau for further analysis and enhancements. You can also download the dashboard as a PDF, PNG, or JPEG, embed it on a platform, or invite your team to collaborate.
Note: This is a Pro template. To use and customize this dashboard wireframe, you’ll need a Pro subscription on Mokkup. Upgrade anytime to unlock full access.
Environmental Compliance Dashboard Example
The dashboard also includes a Waste Disposal Breakdown pie chart that categorizes hazardous, recyclable, organic, plastic, and electronic waste. A Monthly CO₂ Emissions Trend chart compares actual emissions with defined thresholds, making it easier to detect risks early. The Compliance vs Emission Thresholds chart provides insight into how compliance incidents align with emission levels over time. In addition, the Monthly Energy Consumption by Sources chart helps organizations track renewable versus non-renewable energy use. At the same time, the Water Usage by Department heatmap identifies which departments consume the most water and require efficiency improvements.
This Environmental compliance dashboard provides organizations with actionable insights, helping them balance compliance, cost efficiency, and environmental responsibility.
How to Analyze Data in Environmental Compliance Dashboards
Organizations can analyze sustainability and compliance data more effectively with a compliance monitoring dashboard template by following these steps:
- Track CO₂ Emissions vs Thresholds – Identify whether actual emissions exceed regulatory limits.
- Monitor Water Usage – Compare department-level usage with efficiency benchmarks.
- Analyze Energy Consumption by Source – Review renewable vs non-renewable mix to increase sustainability adoption.
- Review Waste Generation Trends – Assess how waste categories change over time to support recycling initiatives.
- Evaluate Compliance Incidents – Treat the tool as an incident tracking and compliance dashboard to link compliance failures with resource management practices.
- Correlate Data Across KPIs – Use multi-chart analysis to find connections between energy consumption, emissions, and compliance rates.
Benefits of Environmental Compliance Dashboard
An Environmental Compliance Dashboard delivers several advantages for organizations:
- Regulatory Alignment: A compliance tracking dashboard simplifies reporting and ensures adherence to environmental laws.
- Sustainability Performance: Track emissions, water usage, and waste to improve efficiency and reduce environmental impact.
- Resource Optimization: Identify high energy and water consumers with real-time monitoring.
- Risk Reduction: Early detection of compliance incidents through an incident tracking and compliance dashboard minimizes penalties.
- Data-Driven Strategy: Insights from the environmental compliance dashboard template guide investment in renewables and efficiency programs.
- Transparency: Enables organizations to report progress to stakeholders and regulators with confidence.
This dashboard helps organizations adopt sustainable practices and achieve long-term environmental goals.
KPIs to Track in the Environmental Compliance Dashboard
Key KPIs in the sustainability compliance dashboard include:
- CO₂ Emissions (tons) – Measures greenhouse gas output and compares it to emission thresholds to ensure regulatory compliance.
- Water Usage (m³) – Tracks total water consumption and highlights department-level inefficiencies to support conservation goals.
- Energy Consumption (MWh) – Monitors electricity usage by source, showing the balance between renewable and non-renewable energy.
- Compliance Incidents (count) – Records environmental violations or non-compliance events, helping organizations minimize regulatory risks.
- Waste Generated (tons) – Measures total waste output while categorizing hazardous, recyclable, and organic materials for better waste management.
By monitoring these KPIs, businesses can ensure progress toward sustainability targets while minimizing environmental risks.
Frequently Asked Questions
1. Why is an Environmental Compliance Dashboard important?
It helps organizations monitor sustainability KPIs, ensure regulatory compliance, and make informed decisions to reduce environmental risks.
2. Which industries benefit most from using this dashboard?
The manufacturing, energy, logistics, and construction industries benefit most from their high environmental impact and regulatory exposure.
3. Can this dashboard integrate with BI tools?
Yes. The environmental compliance dashboard template can be exported to BI platforms such as Power BI or Tableau for advanced analysis and reporting.