What is a Coal Power Generation Workforce Dashboard?
A Coal Power Generation Workforce Dashboard is a performance monitoring solution used by electric power utilities and coal power plants to measure the effectiveness of labor resources across plant operations. This dashboard enables HR and operations teams to monitor labor performance, staffing levels, skill availability, hiring progress, and workforce output in relation to production needs. Coal power generation demands labor resources across maintenance, control room operations, fuel handling, cleaning, and mechanical support. Without structured visibility, inefficiencies result in lost output, increased overtime costs, and productivity gaps.
Electric power utilities utilize this dashboard to track labor productivity metrics, including labor hours per MWh, crew availability, shift coverage, and maintenance task completion. It also supports compliance tracking by monitoring certifications and job qualifications. Since coal power plants operate on fixed production targets and scheduled outages, workforce utilization analytics allow teams to optimize manpower distribution without compromising safety or output. The dashboard makes workforce planning measurable and supports manpower decisions backed by HR productivity metrics for coal power generation.
How to Create a Coal Power Generation Workforce Dashboard
You don’t need to build your report from scratch—just start with a ready-to-use dashboard template from Mokkup. Add in your data and export it however you like. Here’s how to do it:
1. Create or Log in to Your Mokkup Account
Start by signing up on Mokkup.ai using your email. If you already have an account, just log in, and you’ll be good to go.
2. Choose and Customize Your Dashboard Template
Find the Coal Power Generation Workforce Dashboard template in the Templates section. Use the drag-and-drop editor to adjust KPIs, edit filters, or add elements based on your data.
3. Export to Your BI Tool
Once your dashboard wireframe is ready, use the BI Tool Export feature to send it directly to Power BI or Tableau for further analysis and enhancements. You can also download the dashboard as a PDF, PNG, or JPEG, embed it on a platform, or invite your team to collaborate.
Note: This is a Pro template. You’ll need a Pro subscription on Mokkup to use and customize this dashboard wireframe. Upgrade anytime to unlock full access.
Coal Power Generation Workforce Dashboard Example
Consider a coal power plant operating multiple generating units, each requiring maintenance crews, operational staff, and safety-certified technicians. HR teams in electric power utilities require continuous workforce efficiency tracking to ensure that enough employees are available for scheduled shifts, turbine shutdowns, inspections, and emergency breakdown work.
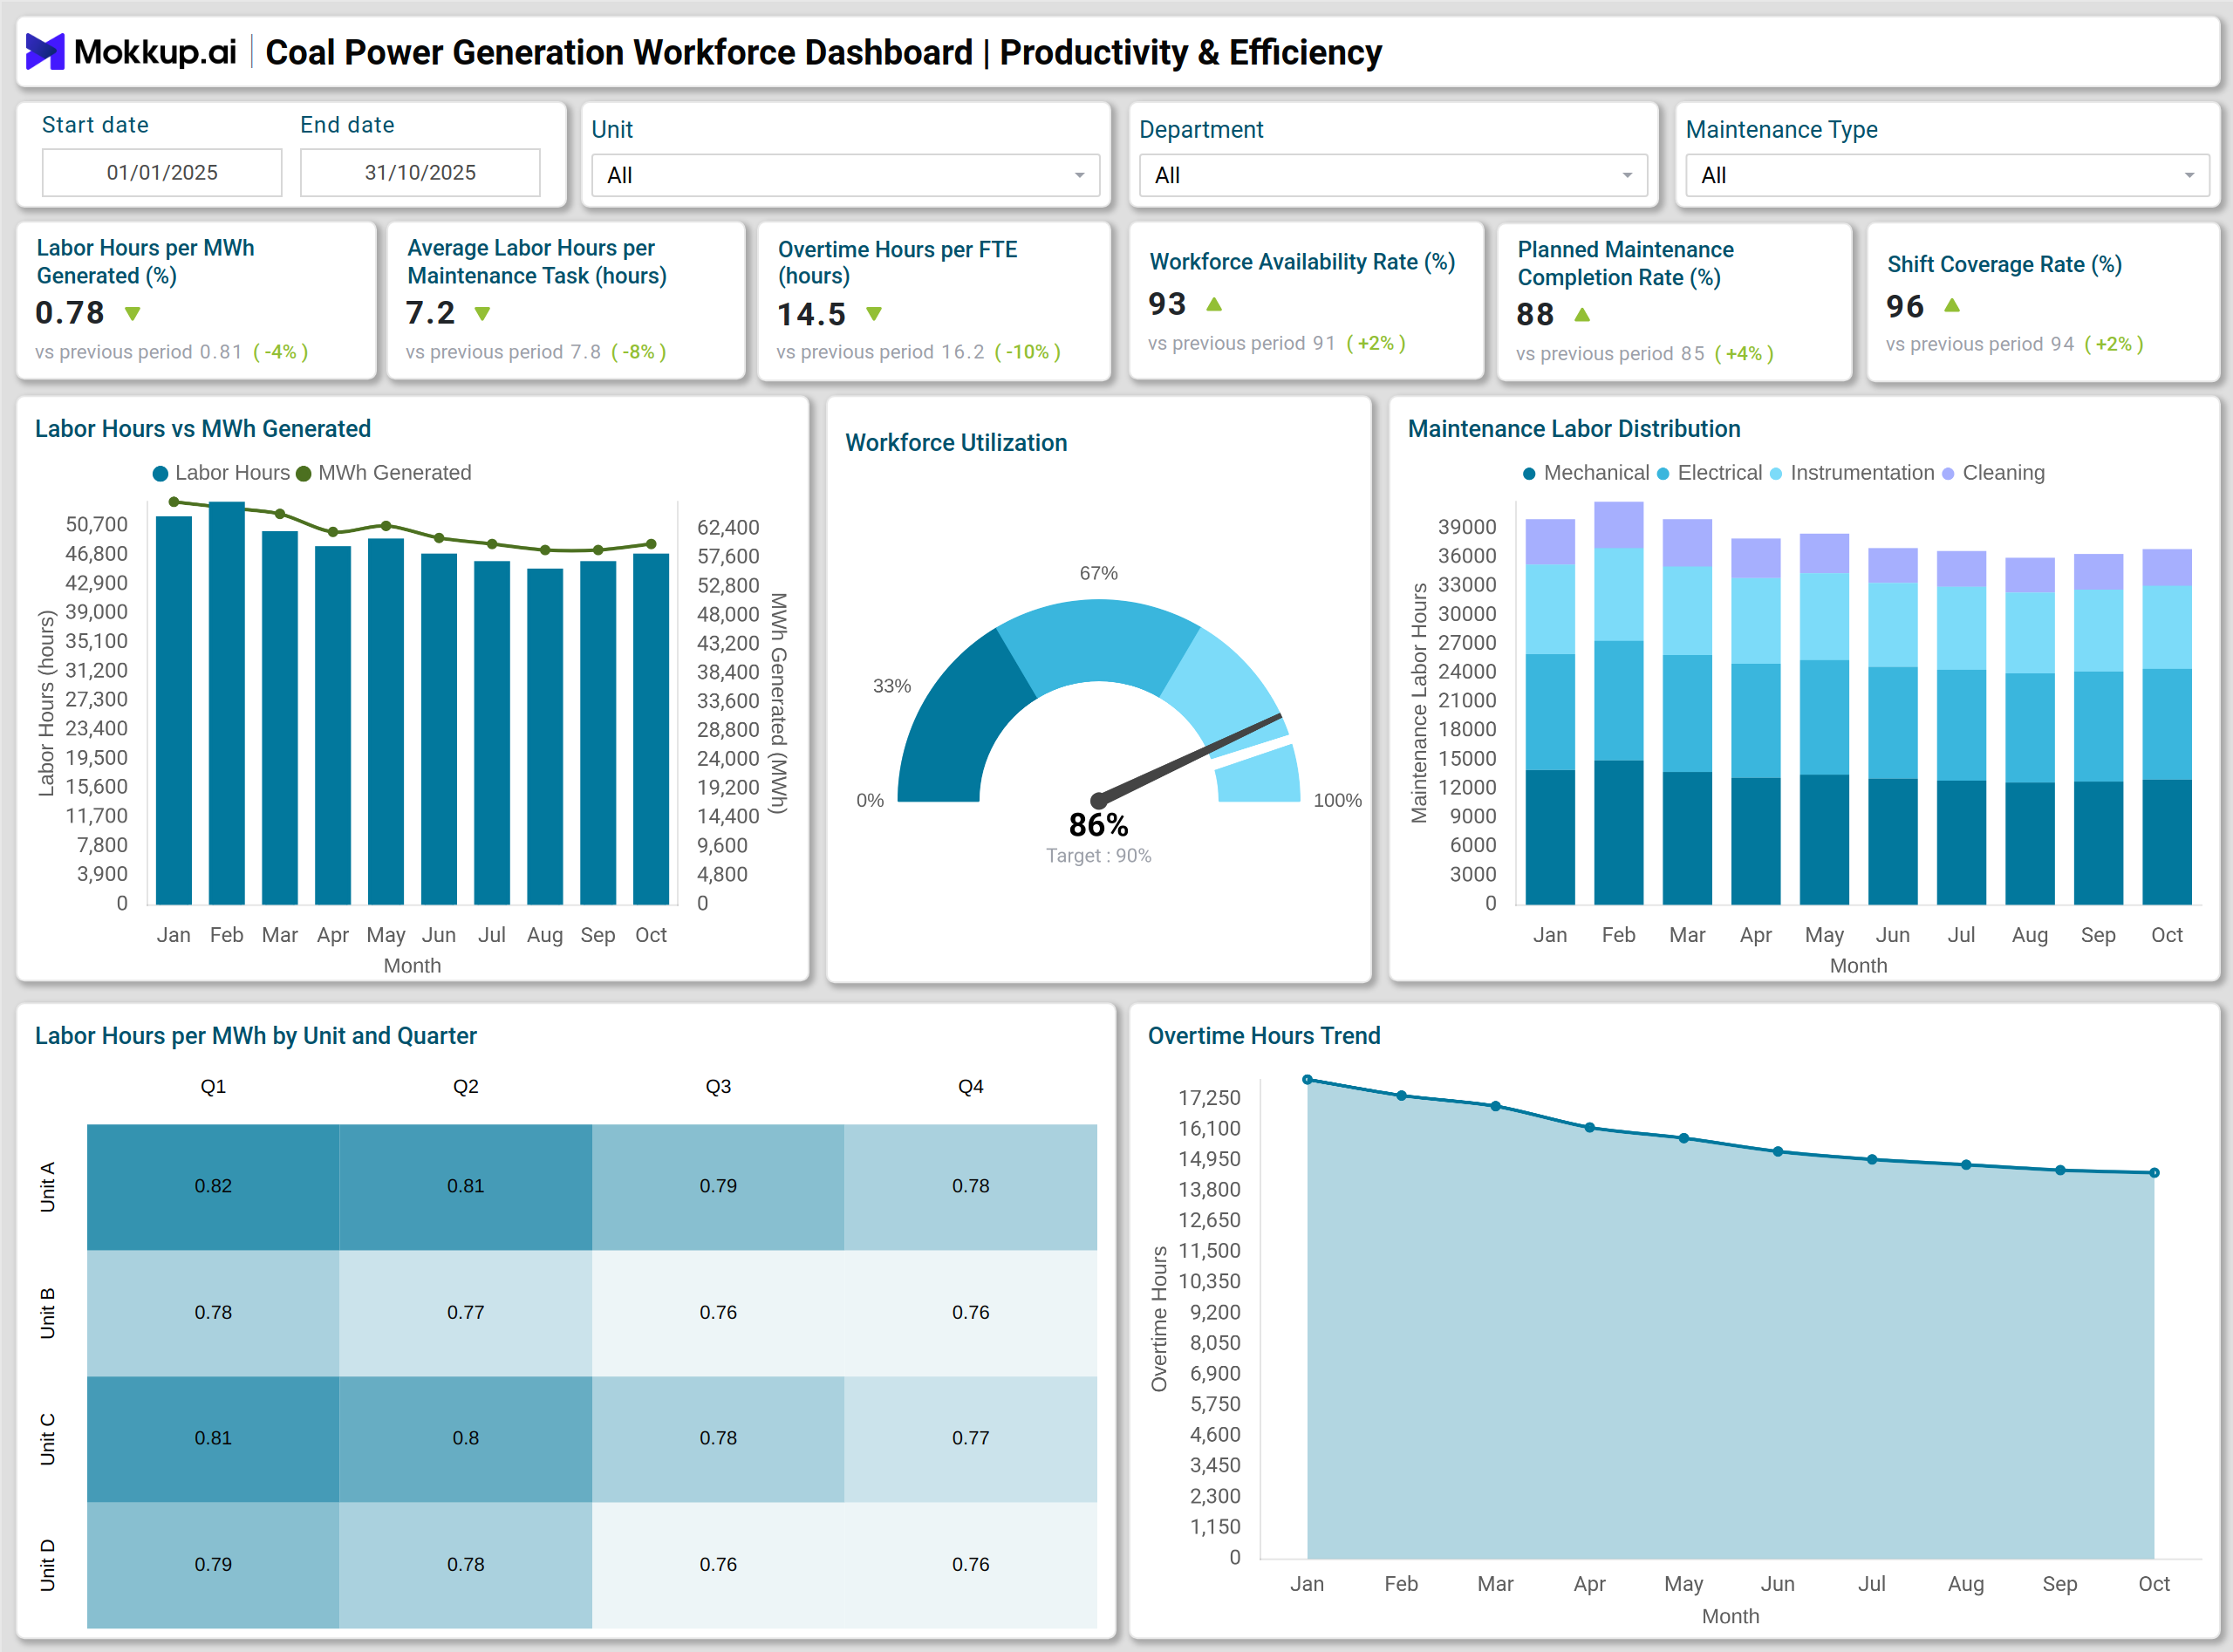
A Coal Power Generation Workforce Dashboard shows labor hours per MWh generated across all units. If one unit consumes substantially higher labor hours than others, it signals skill gaps, higher breakdown events, or possible scheduling inefficiencies. A stacked column chart displays workforce availability by unit, highlighting shortages or underutilized manpower. The hiring funnel supports recruitment by tracking conversions from applicants to hired employees, while vacancy metrics show departments at risk of resource failure. Maintenance managers review planned maintenance completion performance through a gauge chart to ensure tasks are completed within approved timelines. Certification compliance by job role helps prevent safety risks and enables plant heads to ensure technicians are qualified for critical equipment. Through these insights, coal utilities avoid unplanned outages, maintain consistent manpower, and protect production output.
This example illustrates how labor performance monitoring for thermal power stations reduces cost pressure, enhances labor allocation, and ensures safe operational continuity.
How to Analyze Data in Coal Power Generation Workforce Dashboards
- Compare Labor Hours per MWh across generating units to identify areas of low productivity.
- Track Average Labor Hours per Maintenance Task to differentiate between routine workload and complex tasks requiring redesign or additional staffing.
- Monitor Overtime Hours per FTE to detect workload imbalances and risk of fatigue.
- Assess Workforce Availability Rate against shift coverage to ensure staffing stability.
- Use Planned Maintenance Completion Rate to evaluate adherence to maintenance schedules.
- Review the Vacancy Rate and Time-to-Fill to measure hiring efficiency and future manpower gaps.
- Track Certification Compliance Rate to verify skills and safety eligibility.
- Examine Waterfall Chart outputs to view workforce gains and losses across hiring, exits, and promotions.
- Study heatmaps by unit to uncover seasonal performance patterns and improve productivity.
- Analyze overtime and absenteeism trends to identify stress points that affect workforce morale.
Benefits of Coal Power Generation Workforce Dashboards
- Improves staffing visibility for electric utilities by showing gaps, overstaffing, and underutilization.
- Reduces overtime cost by balancing workload and monitoring fatigue risk.
- Supports manpower planning dashboard needs for coal-based utilities by predicting future workforce shortages.
- Enhances labor performance monitoring for thermal power stations through measurable KPIs.
- Strengthens maintenance reliability by tracking completion of scheduled tasks.
- Enhances hiring efficiency by identifying and addressing delays in recruitment pipelines.
- Protects compliance and safety standards by monitoring certifications and qualified personnel.
- Helps HR and operations teams make decisions using workforce utilization analytics.
- Prevents production disruption caused by absenteeism, vacancies, or skill shortages.
- Delivers clear workforce accountability through transparent performance metrics.
KPIs to Track in Coal Power Generation Workforce Dashboards
- Labor Hours per MWh Generated – Measures labor effort required to produce one MWh and helps detect productivity gaps across units.
- Average Labor Hours per Maintenance Task – Shows the average time spent on maintenance work to evaluate workload complexity and efficiency.
- Overtime Hours per FTE – Tracks excess working hours per employee and identifies workload pressure or staffing shortages.
- Workforce Availability Rate – Indicates the percentage of employees available for duty after accounting for absenteeism and leave.
- Planned Maintenance Completion Rate – Measures how many scheduled maintenance tasks were completed within planned timelines.
- Shift Coverage Rate – Tracks the percentage of shifts filled as per staffing requirements to ensure operational continuity.
- Time-to-Fill – Calculates hiring duration from job posting to onboarding and highlights recruitment delays.
Frequently Asked Questions
1. Why do coal power utilities need a Coal Power Generation Workforce Dashboard?
Coal power plants rely on continuous manpower to manage boilers, turbines, conveyors, emission systems, and maintenance tasks. The dashboard ensures labor resources are aligned with operational needs and production goals.
2. Which teams benefit from this dashboard?
HR, plant operations, maintenance management, and compliance teams use the dashboard to improve staffing, scheduling, skill readiness, and workforce planning.
3. How does the dashboard support maintenance efficiency?
By tracking planned maintenance completion rates, maintenance labor hours, and task distribution, teams can forecast manpower requirements and reduce delays.