
What is a Wind Power Plant CSR & Community Engagement Dashboard?
A Wind Power Plant CSR & Community Engagement Dashboard is a reporting tool that tracks social responsibility programs, community outreach, and stakeholder engagement across onshore and offshore wind farms. It serves as a wind power CSR reporting dashboard, enabling utilities to measure CSR spend utilization, project outcomes, beneficiary reach, and satisfaction levels. The dashboard also serves as a wind plant community impact analytics system, illustrating how CSR initiatives impact social development indicators. It supports both onshore CSR compliance and offshore community engagement, consolidating activities, grievances, partner contributions, and SDG alignment in one platform. With structured CSR metrics and community feedback, it becomes a renewable energy CSR performance tracker that strengthens planning, compliance, and impact measurement.
Wind Power Plant CSR & Community Engagement Dashboard
You don’t need to build your report from scratch—just start with a ready-to-use dashboard template from Mokkup. Add in your data and export it however you like. Here’s how to do it:
1. Create or Log in to Your Mokkup Account
Start by signing up on Mokkup.ai using your email. If you already have an account, just log in, and you’ll be good to go.
2. Choose and Customize Your Dashboard Template
Find the Wind Power Plant CSR & Community Engagement Dashboard template in the Templates section. Use the drag-and-drop editor to adjust KPIs, edit filters, or add elements based on your data.
3. Export to Your BI Tool
Once your dashboard wireframe is ready, use the BI Tool Export feature to send it directly to Power BI or Tableau for further analysis and enhancements. You can also download the dashboard as a PDF, PNG, or JPEG, embed it on a platform, or invite your team to collaborate.
Note: This is a Pro template. You’ll need a Pro subscription on Mokkup to use and customize this dashboard wireframe. Upgrade anytime to unlock full access.
Wind Power Plant CSR & Community Engagement Dashboard Example
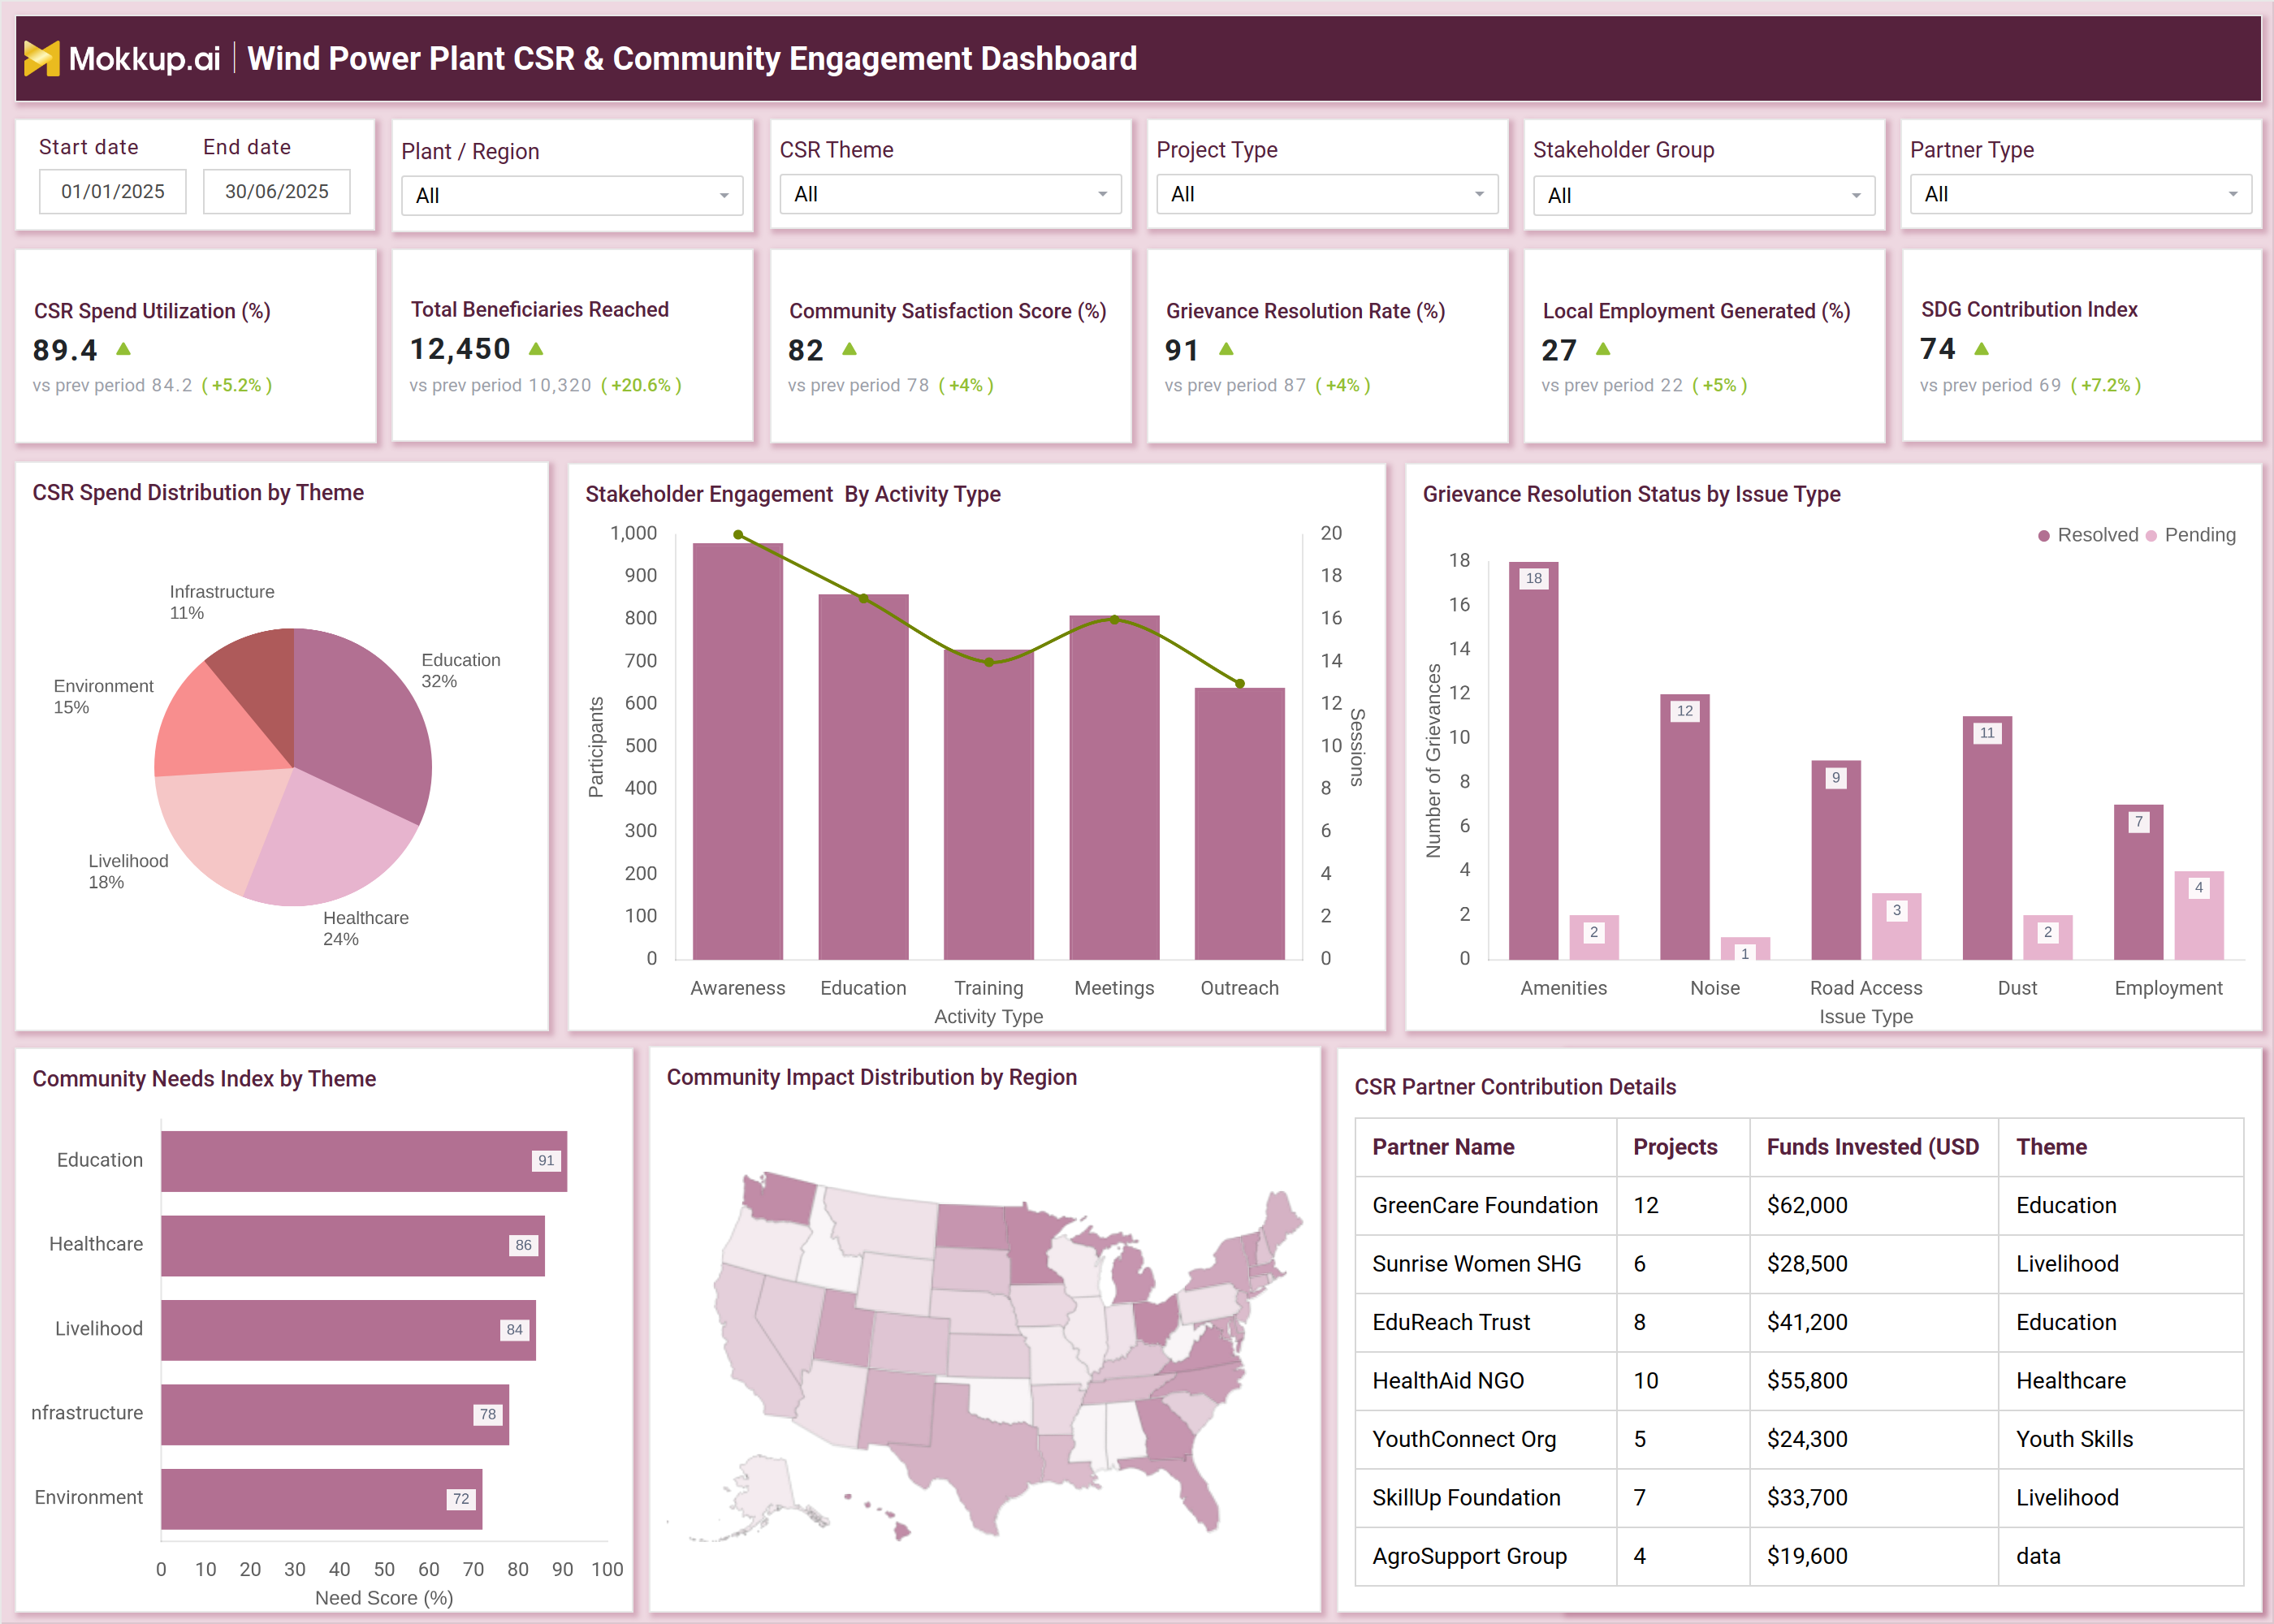
A typical example of this dashboard includes a mix of strategic KPIs, activity-based visuals, and insights into geographic impact. The top section tracks core CSR performance indicators, including CSR spend utilization, total beneficiaries reached, community satisfaction score, grievance resolution rate, local employment generated, and SDG contribution index. These metrics demonstrate the wind plant's effectiveness in delivering community impact in relation to planned initiatives. The dashboard further categorizes CSR investments through a CSR Spend Distribution chart, which displays allocations across various themes, including education, healthcare, livelihood, infrastructure, and the environment.
A Stakeholder Engagement chart illustrates participation levels across awareness events, training sessions, meetings, and outreach programs, which are essential for assessing community involvement. Grievance management is illustrated with a resolution status chart, which helps utilities track resolved versus pending issues for common topics, such as amenities, noise, road access, dust, and employment. A Community Needs Index highlights priority focus areas based on local assessments, while a geographic heatmap illustrates the distribution of impact across regions. Partner contribution tables provide details on NGO involvement, funds deployed, and thematic alignment. This example demonstrates how a wind farm stakeholder engagement dashboard centralizes all CSR activities, enabling utilities to evaluate impact, compliance, and community response.
How to Analyze Data in Wind Power Plant CSR & Community Engagement Dashboard
Here is how you can analyze data from this onshore wind CSR compliance tool:
- Begin by evaluating CSR spend utilization to determine whether projects are executed as planned.
- Review beneficiary reach to measure the scale of community impact.
- Check community satisfaction scores to understand public sentiment toward CSR programs.
- Analyze grievance resolution rate to assess responsiveness and issue-handling quality.
- Track local employment metrics to quantify economic participation enabled by wind projects.
- Study the distribution of CSR themes to ensure investments align with priority needs, such as education or healthcare.
- Examine engagement activity participation to assess which programs attract the highest community involvement.
- Compare resolved vs. pending grievances to identify bottlenecks in community communications.
- Utilize the community needs index to refine CSR strategies in alignment with high-priority themes.
- Interpret regional impact maps to understand how benefits are spread geographically.
- Review partner contribution details to evaluate the effectiveness and alignment of CSR partners.
Benefits of Wind Power Plant CSR & Community Engagement Dashboard
The following are the benefits of using this offshore wind community engagement platform:
- Improves CSR planning with data-driven insights into needs, impact, and outcomes.
- Enhances community trust through transparent reporting of CSR activities and results.
- Strengthens stakeholder engagement by tracking participation across multiple activity types.
- Supports compliance requirements for both onshore and offshore wind assets.
- Improves grievance management with clear visibility into issue types and resolution status.
- Optimizes fund allocation by highlighting high-impact CSR themes.
- Measures SDG alignment for sustainability reporting and regulatory submissions.
- Enhances partner performance by providing data on contributions and thematic outcomes.
- Enables consistent evaluation across multiple wind sites and community groups.
- Supports long-term community development with structured impact tracking and needs assessment.
KPIs to Track in Wind Power Plant CSR & Community Engagement Dashboard
The following key KPIs can be tracked by using this dashboard:
- CSR Spend Utilization (%) – Measures how effectively allocated CSR budgets are deployed.
- Total Beneficiaries Reached – Quantifies the number of people impacted by CSR programs.
- Community Satisfaction Score (%) – Indicates overall perception of CSR initiatives.
- Grievance Resolution Rate (%) – Tracks efficiency of issue handling.
- Local Employment Generated (%) – Measures job creation supported by wind projects.
- SDG Contribution Index – Indicates how initiatives align with the Sustainable Development Goals.
- CSR Spend Distribution – Breaks down investment across themes like education or healthcare.
- Engagement Activity Participation – Tracks attendance in awareness, training, and outreach events.
- Grievance Status by Issue Type – Distinguishes between resolved and pending community issues.
- Community Needs Index – Prioritizes areas requiring immediate intervention.
- Regional Impact Distribution – Highlights geographic spread of CSR benefits.
- Partner Contribution Metrics – Tracks project count, funds invested, and thematic alignment by CSR partners.
Frequently Asked Questions
1. Who uses this CSR dashboard?
CSR managers, sustainability teams, operations leaders, compliance officers, and external reporting teams.
2. Can it be used for both onshore and offshore wind projects?
Yes. It works as both an onshore CSR compliance tool and an offshore community engagement platform.
3. Does the dashboard support regulatory reporting?
Yes. It centralizes CSR and stakeholder data required for sustainability and compliance submissions.