
What is a Solar Plant CSR & Community Impact Dashboard?
A Solar Plant CSR & Community Impact Dashboard is a unified reporting system designed to help solar utilities monitor CSR investments, measure beneficiary outreach, evaluate environmental contributions, and track community development initiatives. It functions as a solar plant CSR performance tracking dashboard, providing structured insights into CSR spending, program reach, local employment contributions, and stakeholder satisfaction scores. The dashboard also serves as a renewable energy CSR and ESG compliance reporting tool, consolidating regulatory compliance data, partner engagement metrics, and policy adherence indicators in a single view. By integrating multiple social, environmental, and governance parameters, this dashboard enables solar utilities to measure the effectiveness of their CSR strategy in supporting rural development, education, health, environmental sustainability, and livelihood improvement. It serves as a solar plant community impact monitoring dashboard, allowing teams to understand how CSR initiatives translate into measurable community outcomes. Combined with ESG frameworks, the dashboard supports renewable energy community development impact reporting, ensuring transparency for internal leadership, regulators, and partner organizations.
How to Create a Solar Plant CSR & Community Impact Dashboard
You don’t need to build your report from scratch; just start with a ready-to-use Solar Plant CSR & Community Impact dashboard template from Mokkup. Add in your data and export it however you like. Here’s how to do it:
1. Create or Log in to Your Mokkup Account
Start by signing up on Mokkup.ai using your email. If you already have an account, just log in, and you’ll be good to go.
2. Choose and Customize Your Dashboard Template
Find the Solar Plant CSR & Community Impact Dashboard template in the Templates section. Use the drag-and-drop editor to adjust KPIs, edit filters, or add elements based on your data.
3. Export to Your BI Tool
Once your dashboard wireframe is ready, use the BI Tool Export feature to send it directly to Power BI or Tableau for further analysis and enhancements. You can also download the dashboard as a PDF, PNG, or JPEG, embed it on a platform, or invite your team to collaborate.
Note: This is a Pro template. You’ll need a Pro subscription on Mokkup to use and customize this dashboard wireframe. Upgrade anytime to unlock full access.
Solar Plant CSR & Community Impact Dashboard Example
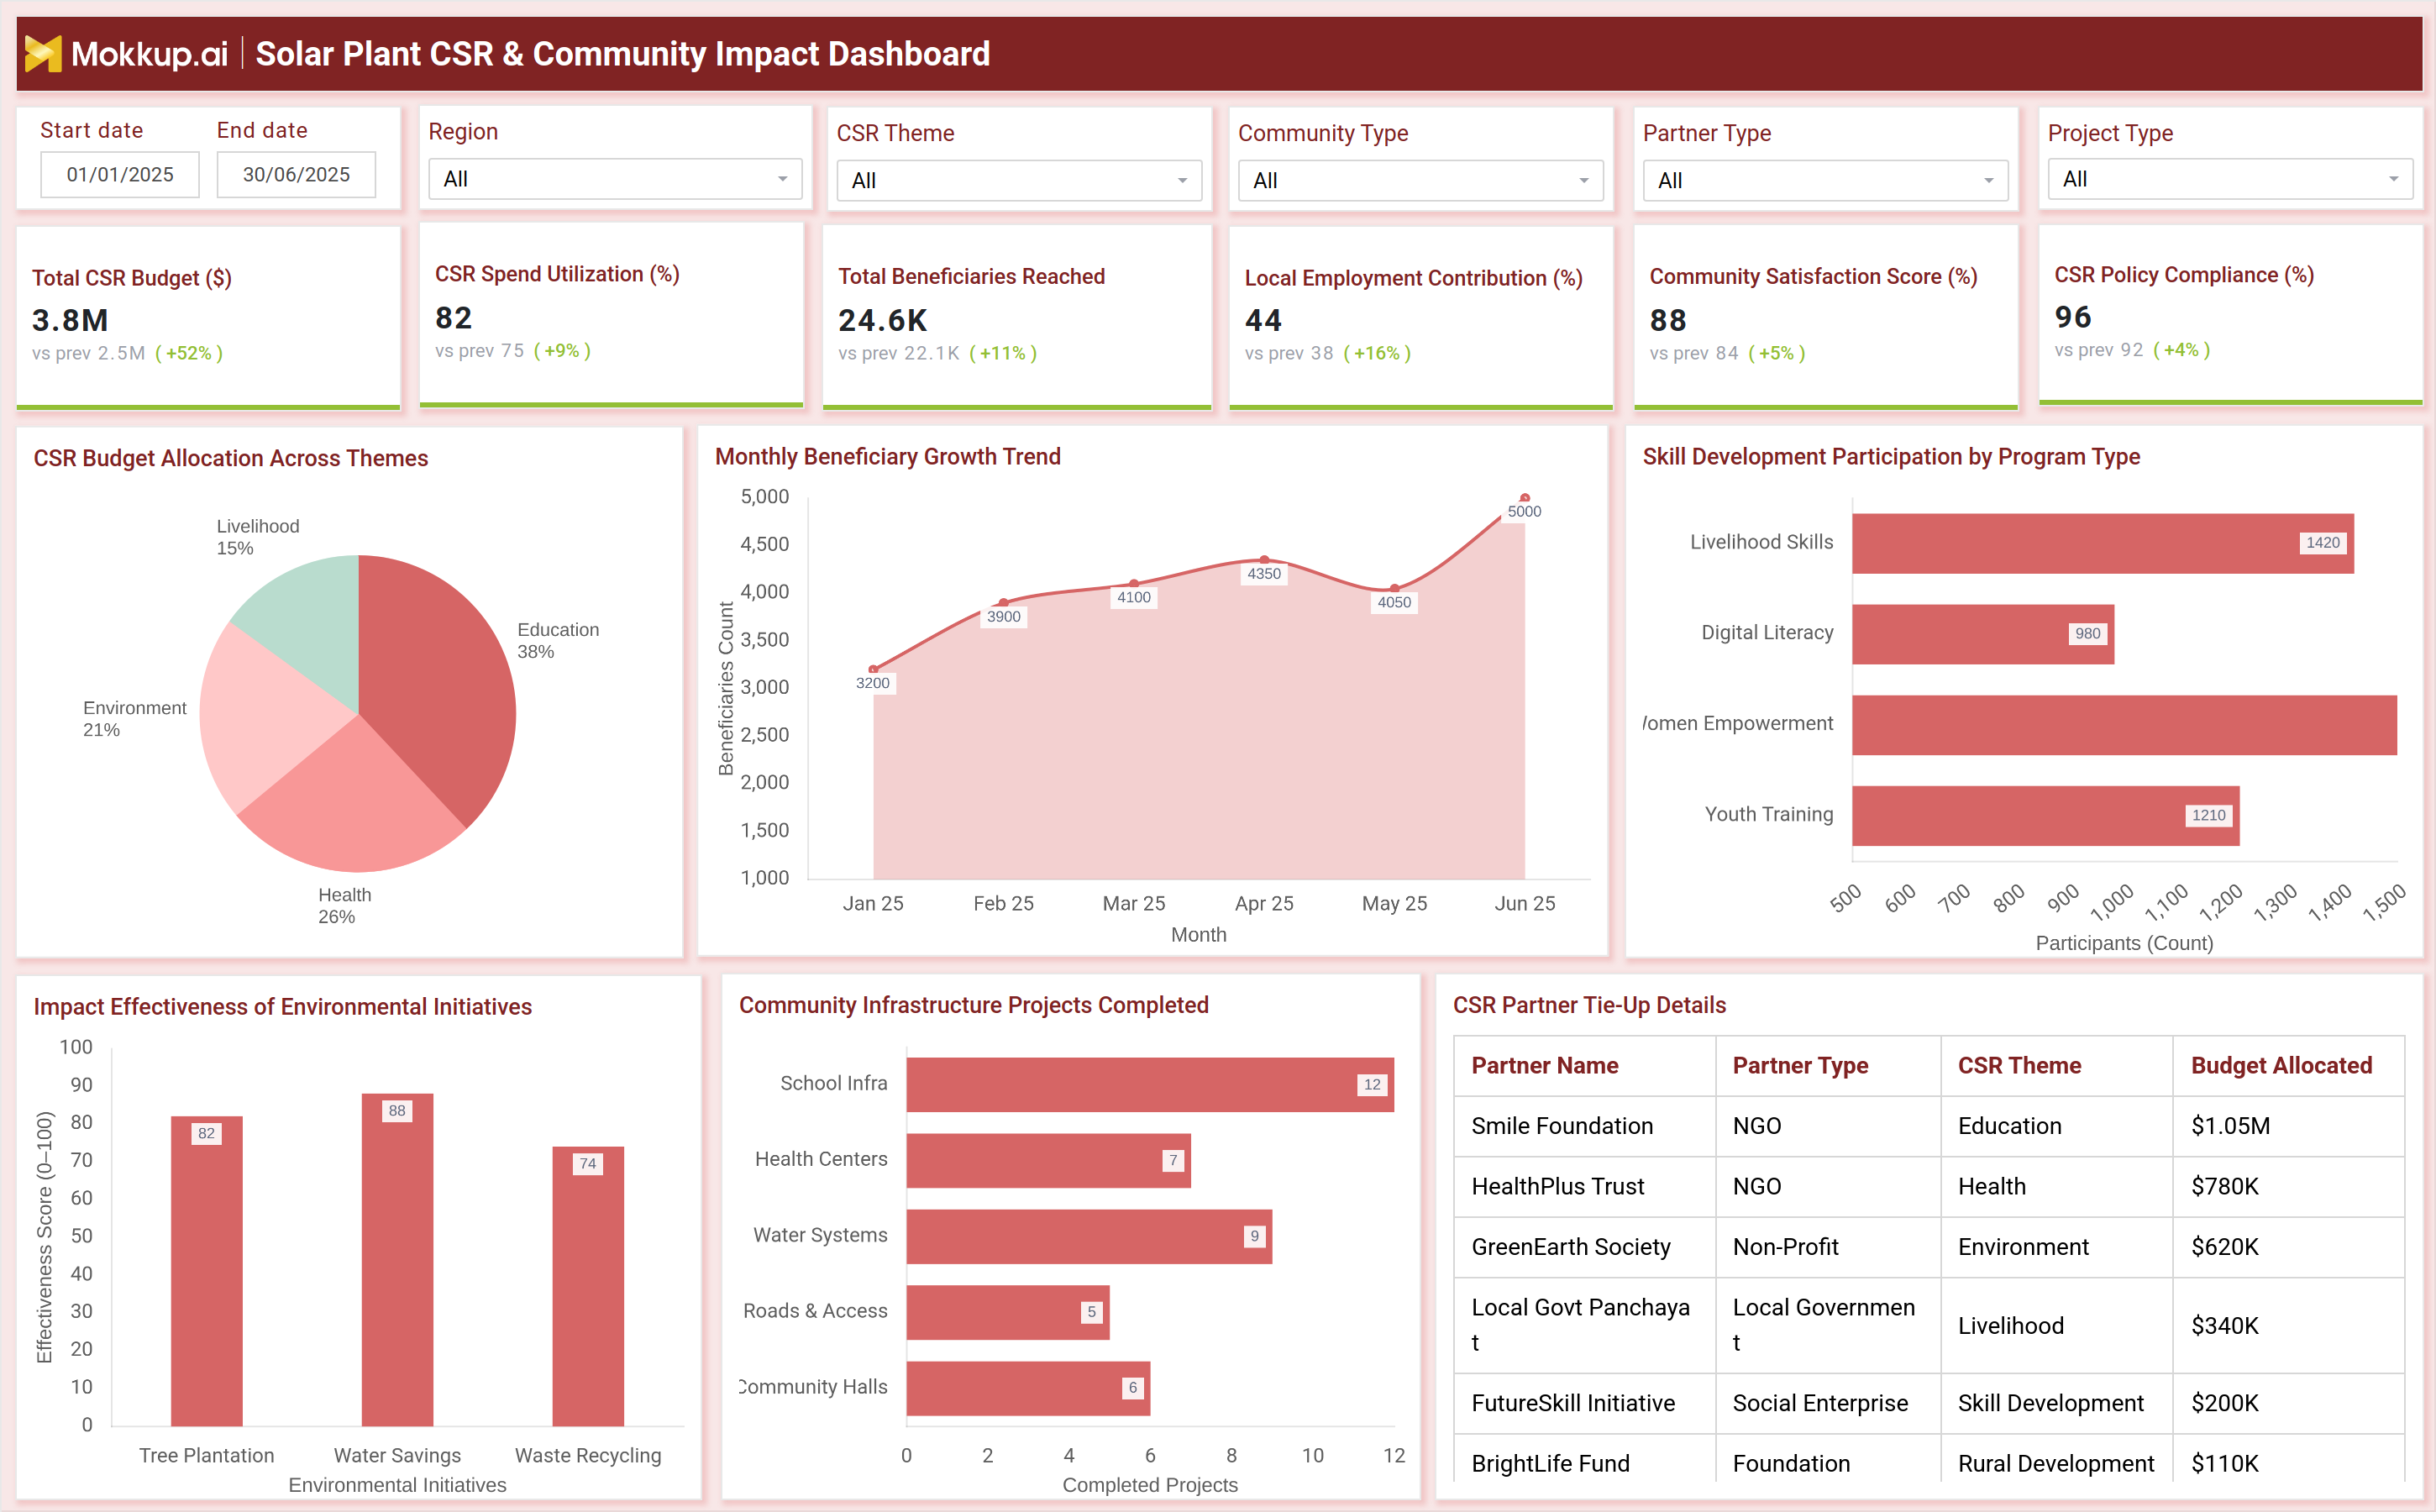
A practical example of this dashboard includes multiple analytical components that reflect CSR performance across programs and regions. At the top level, users can track key metrics such as Total CSR Budget, CSR Spend Utilization, Total Beneficiaries Reached, Local Employment Contribution, Community Satisfaction Score, and CSR Policy Compliance. These indicators provide a quick overview of resource allocation efficiency and community-level impact. This makes the dashboard suitable as a sustainability performance dashboard for solar utilities, offering clarity on how funds and initiatives align with sustainability goals. Visuals, such as the CSR Budget Allocation Across Themes, show the spending distribution across Education, Health, Environment, Livelihood, and Skill Development. Monthly Beneficiary Growth Trend charts help evaluate how beneficiary engagement evolves over time. Participation metrics highlight involvement in skill development programs, including digital literacy, livelihood skills, youth training, and women's empowerment. Environmental impact indicators measure the effectiveness of sustainability initiatives, such as tree plantations, water savings, and waste recycling.
Meanwhile, infrastructure progress bars indicate the completion of projects related to school infrastructure, community halls, water systems, health centers, and access roads. Partner tie-up tables offer visibility into NGOs, foundations, government bodies, and social enterprises that support CSR activities. This integrated view enables solar plants to align CSR strategy with measurable outcomes, while also supporting audit and governance requirements through a solar energy CSR audit and compliance reporting tool.
How to Analyze Data in a Solar Plant CSR & Community Impact Dashboard
Here is how you can analyze data from this dashboard:
- Review CSR Budget Utilization (%) to understand whether spending aligns with planned allocations.
- Analyze Total Beneficiaries Reached to measure the community reach of programs.
- Track Local Employment Contribution (%) to assess opportunities created for nearby communities.
- Interpret the Community Satisfaction Score to understand public perception and program effectiveness.
- Monitor CSR Policy Compliance (%) for governance and regulatory alignment.
- Study beneficiary growth trends to identify seasonal engagement patterns.
- Evaluate budget allocation by theme to confirm alignment with CSR priorities.
- Track participation across skill development programs to measure workforce capability improvement.
- Review environmental initiative effectiveness for sustainability evaluation.
- Analyze completed infrastructure projects to assess community development delivery.
- Evaluate partner tie-up details to understand collaboration strength, funding allocation, and program ownership.
Benefits of Solar Plant CSR & Community Impact Dashboard
The following are the benefits of using this dashboard:
- Improves visibility into spending, performance, and CSR outcomes.
- Strengthens ESG compliance through structured reporting.
- Helps measure whether CSR investments support community priorities.
- Enables data-driven decisions on future social initiatives.
- Enhances stakeholder confidence through transparent documentation.
- Supports governance frameworks by tracking compliance and partner contributions.
- Simplifies beneficiary reporting and audit support.
- Identifies high-impact initiatives through trend and effectiveness analytics.
- Enhances alignment between CSR objectives and community needs.
- Improves long-term sustainability planning for solar utilities.
KPIs to Track in a Solar Plant CSR & Community Impact Dashboard
The following key KPIs can be tracked by using this dashboard:
- Total CSR Budget ($) – Total allocated funds for CSR programs.
- CSR Spend Utilization (%) – Measures spending efficiency across initiatives.
- Total Beneficiaries Reached – Number of people impacted through CSR programs.
- Local Employment Contribution (%) – Workforce engagement from nearby regions.
- Community Satisfaction Score (%) – Measures community perception and feedback.
- CSR Policy Compliance (%) – Tracks adherence to CSR and ESG rules.
- Beneficiary Growth Trend – Engagement growth across months.
- Skill Development Participation – Measures training impact across program types.
- Environmental Initiative Effectiveness – Evaluates outcomes of sustainability actions.
- Infrastructure Projects Completed – Tracks progress of community development assets.
- Partner Tie-Up Metrics – Monitors contributions and budget allocations by partners.
Frequently Asked Questions
1. Who uses a Solar Plant CSR & Community Impact Dashboard?
CSR teams, sustainability officers, ESG reporting teams, plant managers, community engagement teams, and corporate leadership in solar utilities.
2. Why is CSR tracking important for solar plants?
It ensures transparency, strengthens community relations, supports regulatory compliance, and aligns solar operations with sustainability commitments.
3. How does the dashboard support ESG reporting?
It provides structured data for environmental initiatives, social impact metrics, and governance compliance, enabling accurate ESG documentation.