
What is a Hydroelectric Power Plant Stakeholder Relations Dashboard?
A Hydroelectric Power Plant Stakeholder Relations Dashboard template is a centralized tool designed for sustainability managers, public affairs teams, and plant leadership to monitor and manage relationships with key stakeholders. It provides visibility into stakeholder satisfaction, compliance adherence, engagement coverage, sentiment trends, and issue resolution metrics.
Unlike scattered reports, this dashboard wireframe serves as a Comprehensive stakeholder relations tracking tool for Hydroelectric Power Plant stakeholders, helping organizations maintain positive relationships, ensure regulatory compliance, and effectively address community and environmental concerns.
How to Create a Hydroelectric Power Plant Stakeholder Relations Dashboard
You don’t need to build your report from scratch—just start with a ready-to-use Hydroelectric Power Plant stakeholder relations dashboard template from Mokkup. Add in your data and export it however you like. Here’s how to do it:
1. Create or Log in to Your Mokkup Account
Start by signing up on Mokkup.ai using your email. If you already have an account, just log in, and you’ll be good to go.
2. Choose and Customize Your Dashboard Template
Find the Hydroelectric Power Plant Stakeholder Relations Dashboard template in the Templates section. Use the drag-and-drop editor to adjust KPIs, edit filters, or add elements based on your data.
3. Export to Your BI Tool
Once your dashboard wireframe is ready, use the BI Tool Export feature to send it directly to Power BI or Tableau for further analysis and enhancements. You can also download the dashboard as a PDF, PNG, or JPEG, embed it on a platform, or invite your team to collaborate.
Note: This is a Pro template. You’ll need a Pro subscription on Mokkup to use and customize this dashboard wireframe. Upgrade anytime to unlock full access.
Hydroelectric Power Plant Stakeholder Relations Dashboard Example
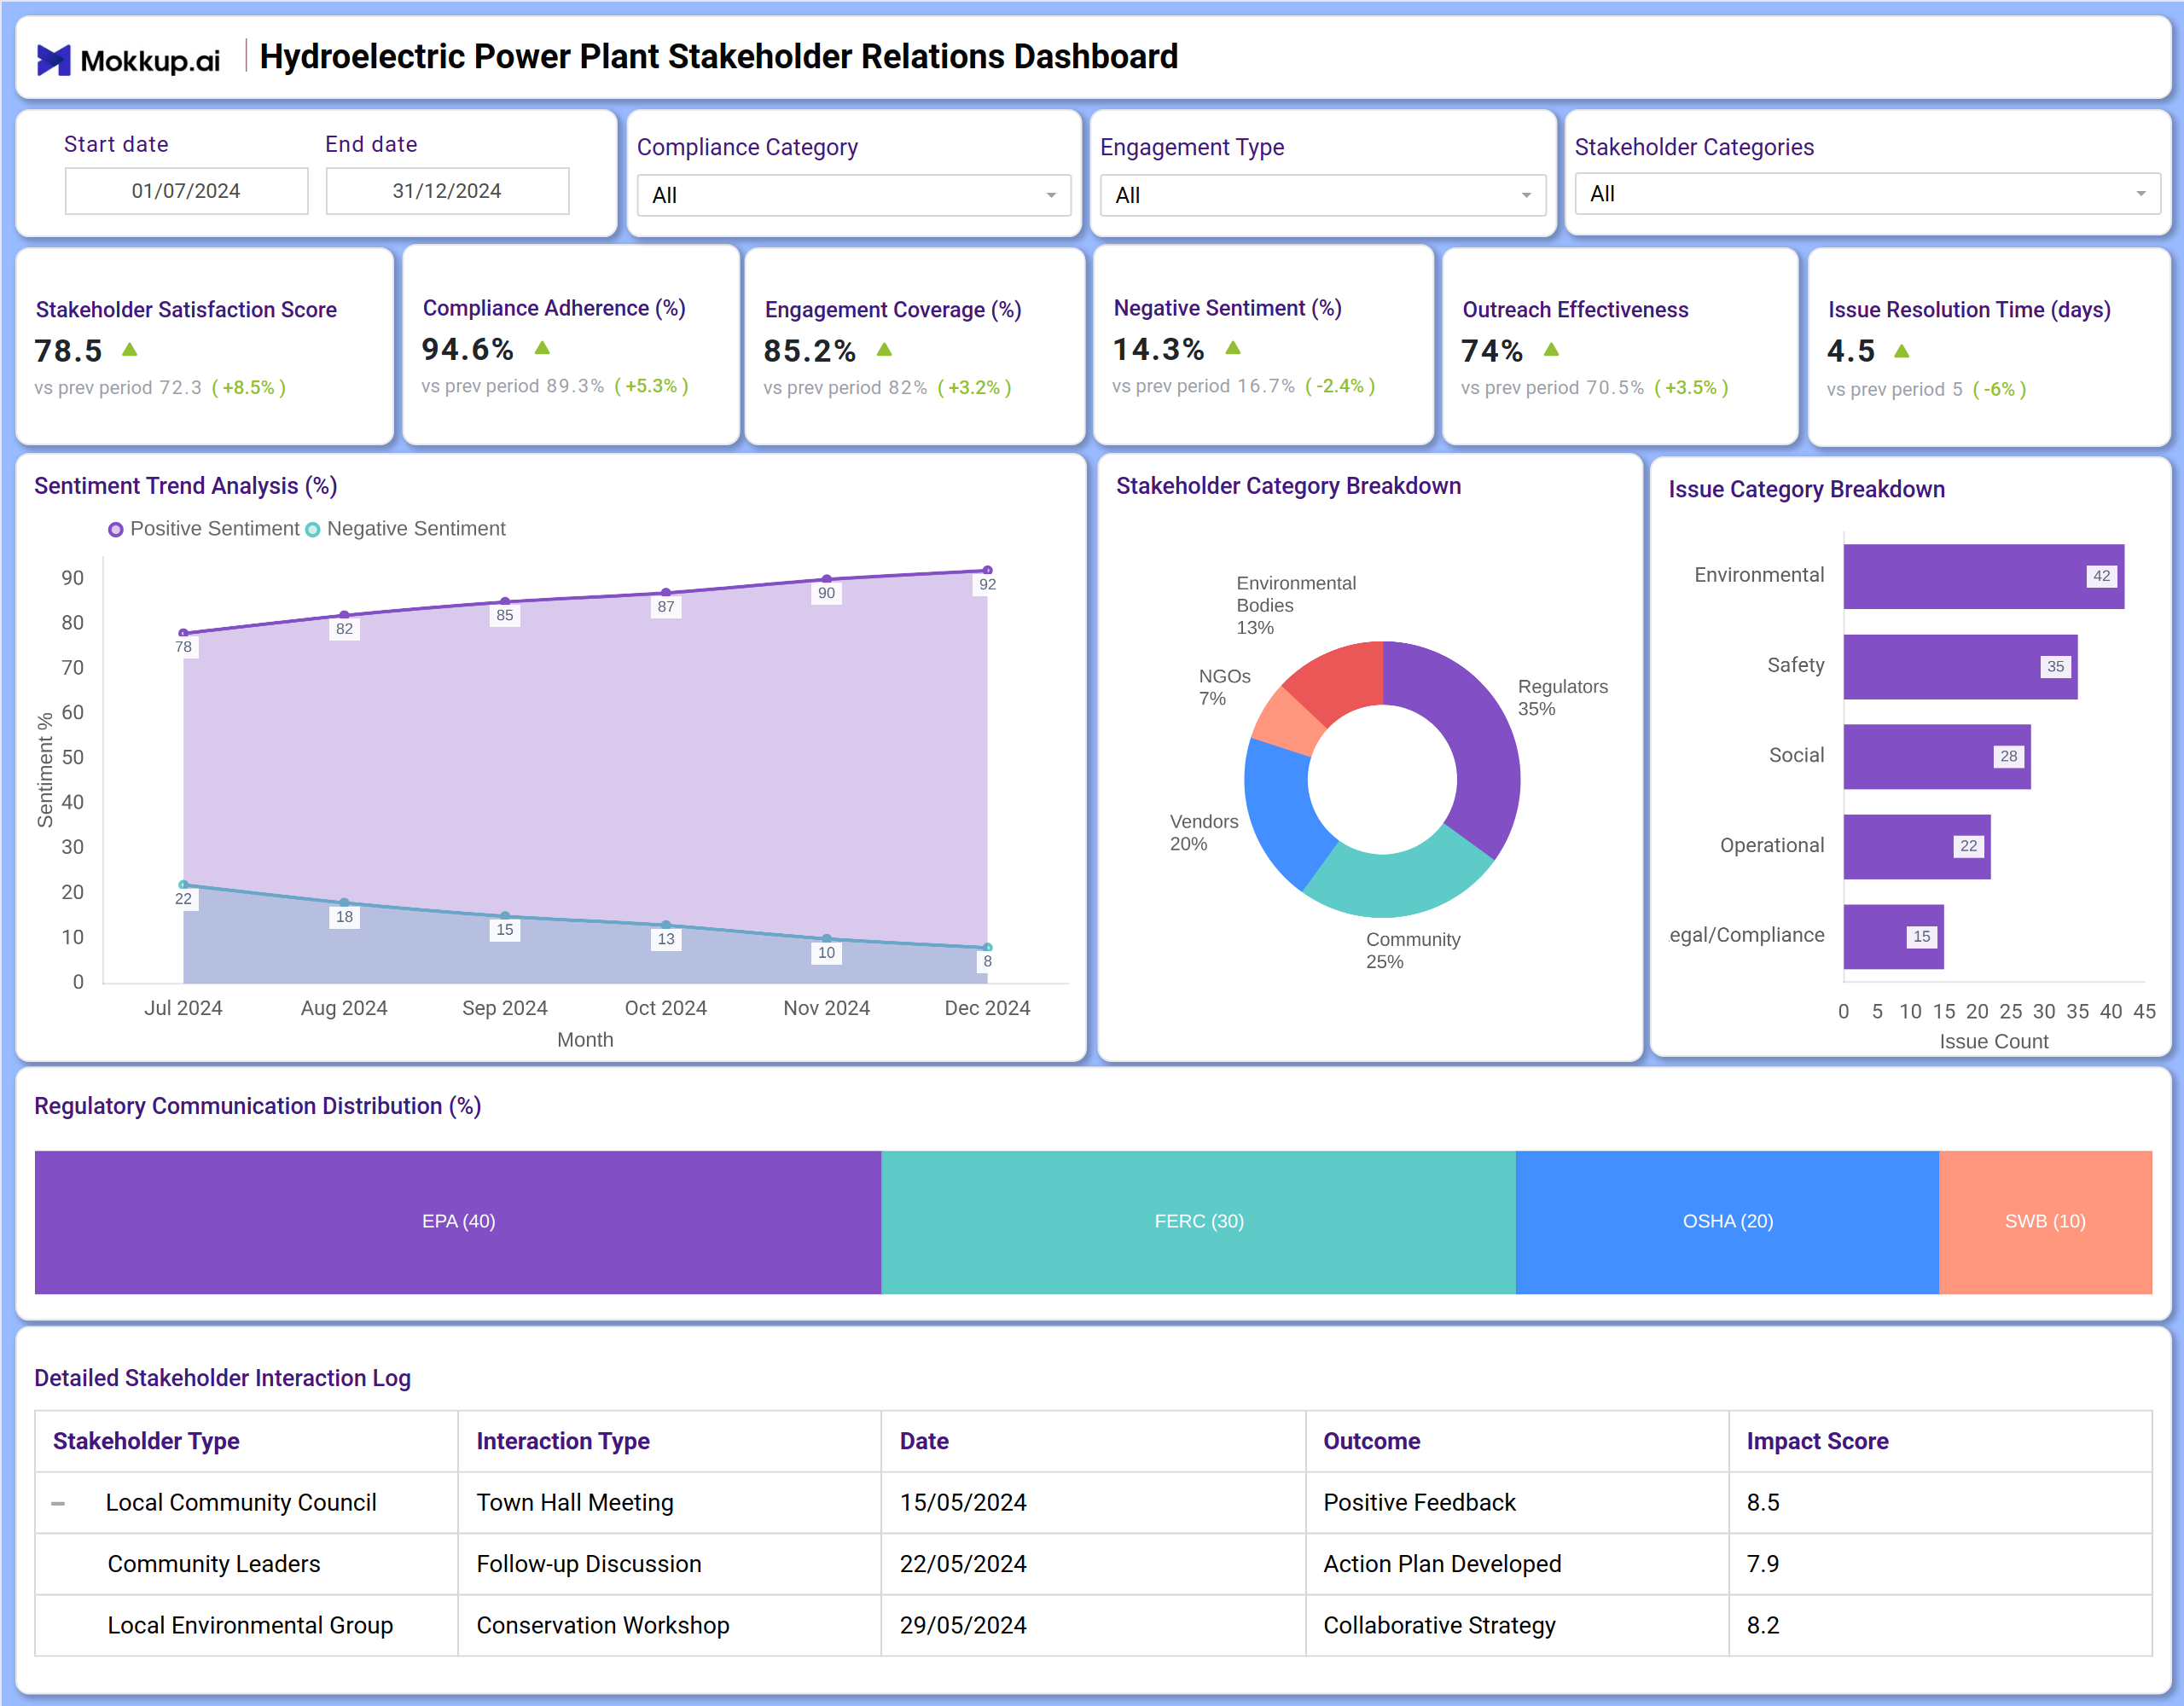
You can create a Hydroelectric Power Plant Stakeholder Relations Dashboard that combines KPI tiles and visualizations. At the top, KPI cards track key metrics, including Stakeholder Satisfaction Score, Compliance Adherence, Engagement Coverage, Negative Sentiment, Outreach Effectiveness, and Issue Resolution Time. Below that, charts display sentiment trends over time, stakeholder category breakdowns, issue category distributions, and regulatory communication percentages. Together, this dashboard works as a stakeholder management dashboard for hydroelectric plants, ensuring leadership maintains strong relationships and meets compliance standards.
How to Analyze Data in Hydroelectric Power Plant Stakeholder Relations Dashboards
Here’s how plant managers and stakeholder teams can make the most of the data available on the Hydroelectric Power Plant stakeholder relations dashboard:
- Track Stakeholder Satisfaction: Monitor the Stakeholder Satisfaction Score to gauge the overall health of the relationship.
- Ensure Regulatory Compliance: Review Compliance Adherence percentages to avoid legal risks.
- Measure Engagement Reach: Use Engagement Coverage to ensure all stakeholder groups are involved.
- Monitor Sentiment Trends: Analyze Positive and Negative Sentiment trends to address concerns early.
- Evaluate Outreach Impact: Assess Outreach Effectiveness to Enhance Communication Strategies.
- Resolve Issues Efficiently: Track Issue Resolution Times to Enhance Responsiveness.
- Review Stakeholder Diversity: Use the Stakeholder Category Breakdown to ensure balanced engagement.
- Identify Common Issues: Analyze Issue Category Breakdown to prioritize actions.
- Manage Regulatory Communications: Review Regulatory Communication Distribution to ensure proper reporting.
Benefits of Hydroelectric Power Plant Stakeholder Relations Dashboards
This dashboard helps hydro plant teams monitor relationships, compliance, communication, and community sentiment in a single, structured view:
- Improved Stakeholder Relationships: Tracks satisfaction and sentiment to maintain trust.
- Enhanced Compliance Management: Monitors adherence to regulatory requirements.
- Better Engagement Planning: Measures coverage and effectiveness of outreach efforts.
- Faster Issue Resolution: Reduces resolution time for operational and social concerns.
- Informed Decision-Making: Provides insights into stakeholder categories and common issues.
- Regulatory Transparency: Tracks communication with bodies like EPA, FERC, and OSHA.
- Proactive Sentiment Management: Identifies negative trends early for timely intervention.
Together, these elements help leadership maintain positive stakeholder relations and ensure the plant operates responsibly and sustainably. That’s why many energy leaders consider it the best stakeholder relations dashboard for hydroelectric plants, aiming to improve community trust and regulatory compliance.
KPIs to Track in Hydroelectric Power Plant Stakeholder Relations Dashboards
These KPIs help teams assess satisfaction, compliance, communication quality, and issue trends across all stakeholder groups:
- Stakeholder Satisfaction Score: Measures overall satisfaction levels among key stakeholders.
- Compliance Adherence (%): Tracks the level of adherence to regulatory and legal requirements.
- Engagement Coverage (%): Monitors the percentage of stakeholders actively engaged.
- Negative Sentiment (%): Tracks the proportion of interactions with negative feedback.
- Outreach Effectiveness: Measures the success rate of outreach and communication efforts.
- Issue Resolution Time (days): Tracks the average time taken to resolve stakeholder issues.
- Stakeholder Category Breakdown: Shows the distribution of stakeholders across groups like Community, Vendors, NGOs, and Environmental Bodies.
- Issue Category Breakdown: Highlights common issue types, including Environmental Safety, Social, Operational, and Legal/Compliance.
- Regulatory Communication Distribution: Tracks engagement with regulatory agencies, including the EPA, FERC, OSHA, and state bodies.
Frequently Asked Questions
Q1. Who should use a Hydroelectric Power Plant Stakeholder Relations Dashboard?
Sustainability managers, public relations teams, compliance officers, and plant managers are responsible for stakeholder engagement and regulatory adherence.
Q2. Can this dashboard help improve community relations?
Yes. By tracking satisfaction, sentiment, and issue resolution, teams can address concerns proactively and build stronger community trust.
Q3. How does it support compliance management?
It provides clear visibility into compliance adherence and regulatory communication, helping teams stay aligned with legal requirements.
Q4. Is this dashboard useful for reporting?
Yes, because a Hydroelectric Power Plant stakeholder relations workflow and compliance dashboard supports governance, transparency, and audit readiness.