What is a Wind Power Plant Cost and Profitability Dashboard ?
A Wind Power Plant Cost and Profitability Dashboard is a financial performance monitoring tool used by electric power utilities to track generation costs, operating expenses, revenue, and margins across onshore and offshore wind assets. It consolidates key financial and operational data such as cost of generation per MWh, tariff rates, EBITDA margin, OPEX, CAPEX utilization, and regional revenue contribution into a single analytical view. This dashboard enables finance, operations, and leadership teams to understand how efficiently wind power assets convert capital and operating investments into revenue and profit. By providing time based, region based, and contract based analysis, it supports informed decision making for cost optimization and long term profitability improvement in wind energy operations.
How to Create a Wind Power Plant Cost and Profitability Dashboard
You don’t need to build your report from scratch, just start with a ready to use dashboard template from Mokkup. Add in your data and export it however you like. Here’s how to do it:
1. Create or Log in to Your Mokkup Account
Start by signing up on Mokkup.ai using your email. If you already have an account, just log in, and you’ll be good to go.
2. Choose and Customize Your Dashboard Template
Find the Wind Power Plant Cost and Profitability Dashboard template in the Templates section. Use the drag and drop editor to adjust KPIs, edit filters, or add elements based on your data.
3. Export to Your BI Tool
Once your dashboard wireframe is ready, use the BI Tool Export feature to send it directly to Power BI or Tableau for further analysis and enhancements. You can also download the dashboard as a PDF, PNG, or JPEG, embed it on a platform, or invite your team to collaborate.
Note: This is a Pro template. You’ll need a Pro subscription on Mokkup to use and customize this dashboard wireframe. Upgrade anytime to unlock full access.
Wind Power Plant Cost and Profitability Dashboard Example
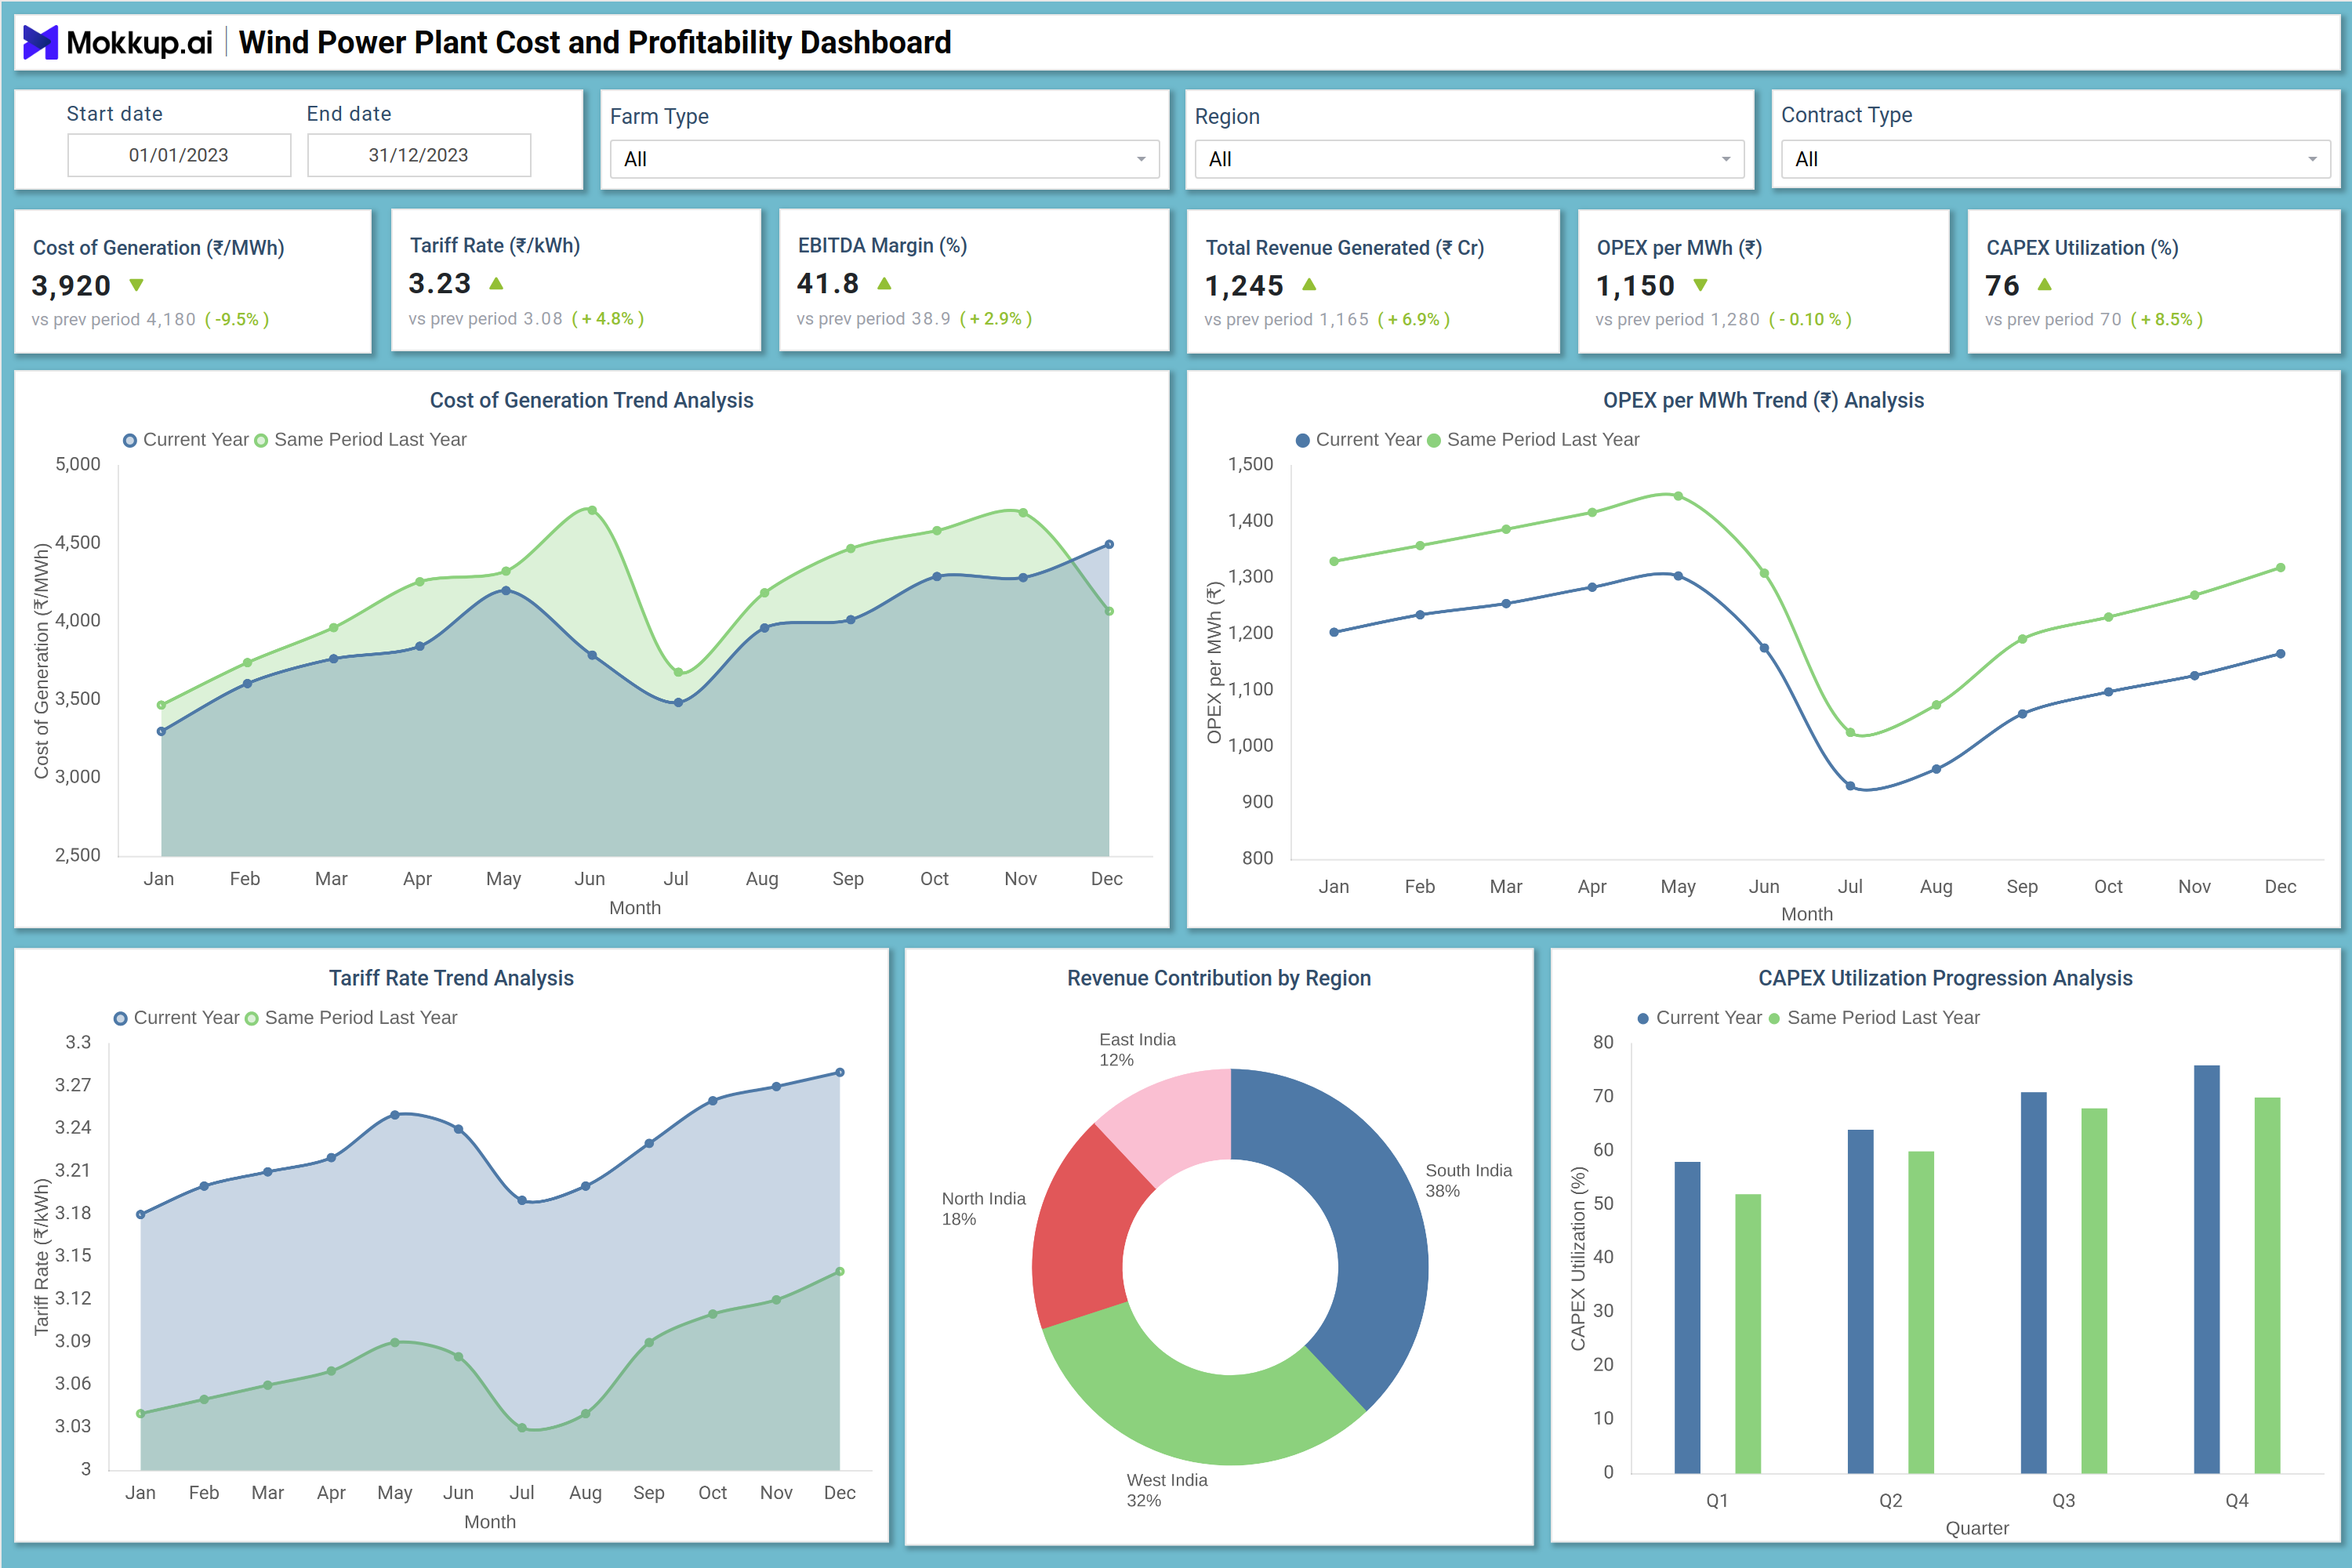
The Wind Power Plant Cost and Profitability Dashboard example highlights how financial performance can be analyzed across a full operating year. At the top level, filters such as date range, farm type, region, and contract type allow users to isolate specific wind assets or portfolios. KPI cards summarize core metrics including cost of generation per MWh, tariff rate, EBITDA margin, total revenue generated, OPEX per MWh, and CAPEX utilization, along with period over period comparisons. Trend charts visualize monthly cost of generation and OPEX movements against the previous year, helping identify seasonal cost fluctuations and efficiency improvements. Tariff rate trends show pricing stability or contract improvements over time. A regional revenue contribution donut chart breaks down income across wind rich regions, while CAPEX utilization analysis tracks quarterly capital deployment efficiency. Together, these visuals provide a structured financial narrative for understanding profitability drivers across onshore and offshore wind power plants.
How to Analyze Data in a Wind Power Plant Cost and Profitability Dashboard
Here is how you can analyze data from this dashboard:
- Compare cost of generation per MWh with the previous year to identify operational efficiency gains or losses
- Analyze OPEX per MWh trends to detect maintenance cost spikes, logistics inefficiencies, or vendor cost increases
- Track tariff rate trends to understand revenue stability across power purchase agreements
- Review EBITDA margin changes to assess overall financial health of wind power assets
- Evaluate CAPEX utilization by quarter to ensure capital investments are aligned with generation output
- Use regional revenue contribution to identify high performing wind corridors
- Segment data by farm type to compare onshore versus offshore cost behavior
- Filter by contract type to assess profitability differences across regulated and merchant contracts
Benefits of a Wind Power Plant Cost and Profitability Dashboard
The following are the benefits of using this dashboard:
- Improves visibility into wind power generation costs and margins
- Enables proactive cost optimization across operations and maintenance
- Supports financial planning and budgeting for wind energy portfolios
- Helps utilities evaluate tariff effectiveness and contract performance
- Identifies underperforming regions or assets quickly
- Aligns CAPEX investments with financial returns
- Enhances executive level reporting with clear financial KPIs
- Strengthens profitability forecasting for wind power projects
KPIs to Track in a Wind Power Plant Cost and Profitability Dashboard
Here is how you can analyze data from this dashboard:
- Monitor Cost of Generation per MWh: Track how efficiently electricity is produced and identify periods of rising production costs.
- Analyze OPEX per MWh: Understand ongoing operational expenses and spot opportunities for cost optimization.
- Review Tariff Rate per kWh: Evaluate pricing effectiveness and its impact on overall revenue.
- Track EBITDA Margin (%): Assess profitability after operating expenses to measure financial health.
- Evaluate Total Revenue Generated: Identify revenue growth trends across time periods.
- Analyze CAPEX Utilization (%): Measure how effectively capital investments are being used to generate returns.
Frequently Asked Questions
1. What is the purpose of a wind power plant cost and profitability dashboard?
The dashboard helps electric utilities monitor generation costs, operating expenses, and revenue to improve financial performance and profitability of wind assets.
2. Who should use this dashboard?
It is designed for finance teams, plant managers, operations leaders, and executives managing wind power generation portfolios.
3. Why is regional revenue analysis important in wind energy?
Regional analysis helps utilities identify high performing wind corridors and prioritize investments accordingly.