What is a Urology Center Financial Performance Dashboard?
A urology clinic financial performance tracking dashboard is a comprehensive financial analytics tool designed to track revenue performance, operational costs, patient volumes, and billing efficiency within a urology practice or multispecialty medical center. It consolidates financial KPIs, payor insights, procedure-level revenue patterns, and payment trends into a centralized platform, helping administrators improve economic outcomes and operational effectiveness.
This healthcare revenue intelligence dashboard enables teams to monitor revenue per patient visit, evaluate operating margins, observe monthly patient flow, and understand payor distribution across Medicare, Medicaid, private insurance, and self-pay categories. With advanced visualizations and trend analysis, medical practices can optimize reimbursement strategies, streamline billing performance, and drive data-driven decisions to elevate the financial health of the organization.
How to Create a Urology Center Financial Performance Dashboard
You don’t need to build your report from scratch—just start with a ready-to-use dashboard template from Mokkup. Add in your data and export it however you like. Here’s how to do it:
1. Create or Log in to Your Mokkup Account
Sign up on Mokkup.ai using your email. If you already have an account, simply log in to begin.
2. Choose and Customize Your Dashboard Template
Select the Urology Center Financial Performance Dashboard template from the Templates section. Use Mokkup’s drag-and-drop editor to tailor KPIs, adjust charts, and refine filters according to your practice’s operational and financial needs.
3. Export to Your BI Tool
Once your dashboard wireframe is complete, export it directly to Power BI or Tableau using the BI Tool Export feature. You can also download your dashboard as a PDF, PNG, or JPEG, embed it on your preferred platform, or collaborate with your team.
Note: This is a Pro template. A Mokkup Pro subscription is required to access and customize this dashboard wireframe.
Urology Center Financial Performance Dashboard Example
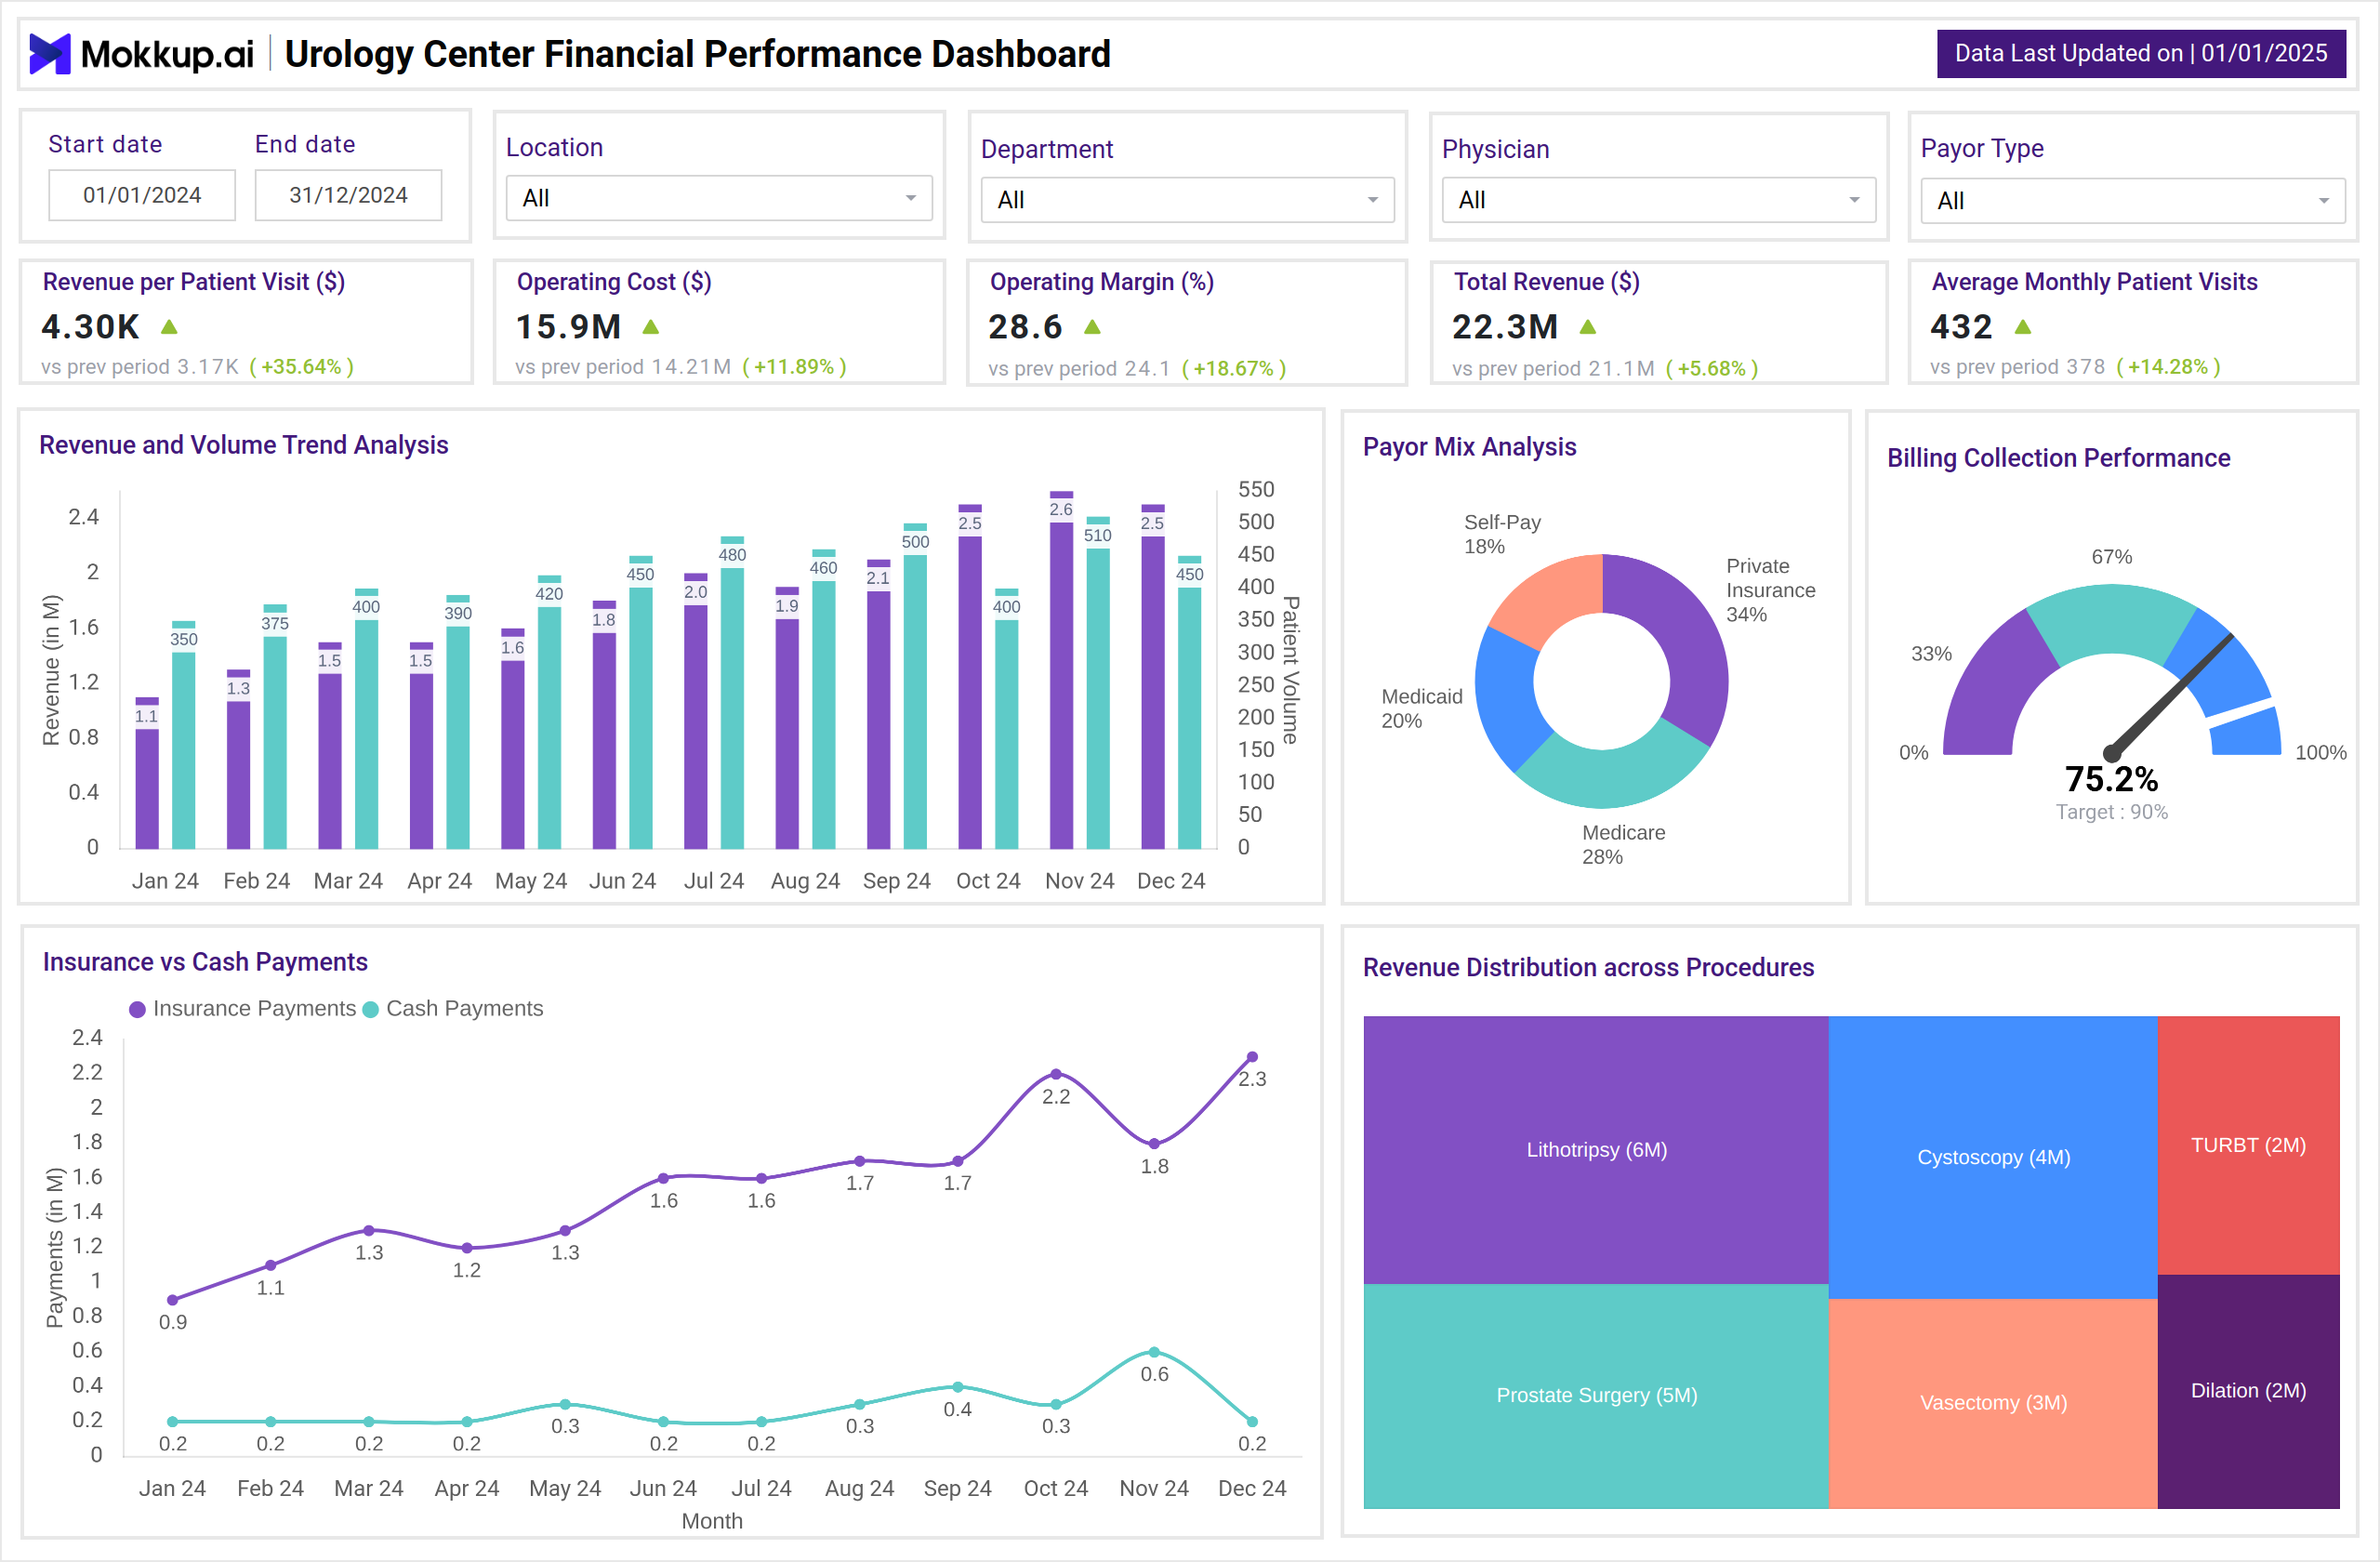
A Urology Center Financial Performance Dashboard can unify revenue metrics, operational KPIs, payer distributions, billing effectiveness, and procedure-level financial insights into a single, comprehensive view. This example dashboard features key metrics, including revenue per patient visit, operating cost, operating margin, total revenue, and average monthly patient visits, each of which is compared against previous periods for precise trend evaluation. Monthly revenue and patient volume charts reveal growth patterns and seasonal shifts, while payor mix analytics highlight the distribution of Medicare, Medicaid, private insurance, and self-pay.
Additionally, billing performance is tracked through a collection efficiency gauge, and payment behavior is visualized with insurance versus cash payment trends. A dedicated procedure revenue block further breaks down financial contributions from procedures such as lithotripsy, cystoscopy, prostate surgery, vasectomy, dilation, and TURBT, providing administrators with complete visibility into clinical profitability.
How to Analyze Data in a Urology Center Financial Performance Dashboard
Here is how you can analyze data from this dashboard:
- Monitor Revenue per Patient Visit: Identify growth trends and evaluate the financial value generated per encounter.
- Track Operating Margin (%): Assess profitability after accounting for operational expenses.
- Analyze Monthly Patient Volume: Detect seasonal patterns or referral shifts affecting workflow.
- Review Payor Mix Composition: Understand reimbursement reliability across insurance types.
- Evaluate Billing Collection Performance: Compare actual collections versus targets to detect revenue cycle bottlenecks.
- Track Insurance vs Cash Payment Trends: Forecast income stability and adjust billing strategies.
- Analyze Procedure Revenue Contribution: Focus resources on top-performing urology procedures.
- Correlate Costs with Revenue Trends: Identify months when operational spending has a more significant impact on margins.
Benefits of a Urology Center Financial Performance Dashboard
The following are benefits of using this dashboard:
- Comprehensive Financial Visibility: Centralizes all key revenue and operational indicators.
- Improved Revenue Cycle Management: Helps reduce denials and improve payment collection rates.
- Enhanced Forecasting and Budgeting: Historical patterns support predictive planning.
- Data-Driven Decision Making: Enables financial leaders to optimize profitability with actionable insights.
- Optimized Resource Allocation: Identifies high-revenue procedures for strategic investment.
- Stronger Payor Negotiation Leverage: Provides clarity on payor mix performance and reimbursement behavior.
- Operational Efficiency Monitoring: Tracks patient flow patterns for better staffing and scheduling.
- Transparent Practice Performance: Makes it easier to communicate financial status across teams.
KPIs to Track in a Urology Center Financial Performance Dashboard
You can track the following Urology Center Financial Performance metrics from this dashboard:
- Revenue per Patient Visit ($) – Measures the average financial return generated for each patient encounter.
- Total Revenue ($) – Tracks overall earnings from clinical services within a defined period.
- Operating Margin (%) – Indicates profitability after accounting for operational expenses.
- Operating Cost ($) – Monitors total expenditures required to run the urology center.
- Average Monthly Patient Visits – Evaluates patient flow and service demand across months.
- Billing Collection Rate (%) – Reflects how effectively the practice converts billed charges into payments.
- Revenue by Procedure ($) – Highlights financial contribution from key urology procedures.
- Revenue & Patient Volume Trend – Demonstrates how monthly earnings and visits fluctuate over time.
- Month-over-Month Growth (%) – Measures performance momentum by comparing monthly financial changes.
Frequently Asked Questions
1. What is the purpose of a Urology Center Financial Performance Dashboard?
To monitor revenue, operational metrics, payor mix, and procedure profitability in urology practices.
2. How does this dashboard help improve revenue cycle performance?
By tracking collection rates, insurance payments, and payor mix to reveal inefficiencies and opportunities.
3. Does this dashboard help improve operational planning?
Absolutely! Patient volume trends and cost insights assist with staffing, scheduling, and budgeting.
4. Who benefits from using this dashboard?
Practice administrators, financial officers, billing teams, revenue cycle managers, and healthcare executives.