What is a Wind Power Plant Corporate Strategy & KPI Monitoring Dashboard?
A Wind Power Plant Corporate Strategy & KPI Monitoring Dashboard is a centralized corporate performance dashboard for wind power utilities used by electric power companies to track strategic, financial, and operational performance across onshore and offshore wind assets. It consolidates enterprise-level metrics such as installed capacity growth, revenue performance, EBITDA margin, return on capital employed (ROCE), and levelized cost of energy (LCOE) into a single view. This dashboard supports executive leadership, corporate strategy teams, and utility management by enabling data-driven decision-making aligned with long-term growth, profitability, and cost efficiency goals. By integrating data across geographies, asset types, and business segments, it ensures consistent monitoring of corporate performance at scale.
How to Create a Wind Power Plant Corporate Strategy & KPI Monitoring Dashboard
You don’t need to build your report from scratch, just start with a ready-to-use dashboard template from Mokkup. Add in your data and export it however you like. Here’s how to do it:
1. Create or Log in to Your Mokkup Account
Start by signing up on Mokkup.ai using your email. If you already have an account, just log in, and you’ll be good to go.
2. Choose and Customize Your Dashboard Template
Find the Wind Power Plant Corporate Strategy & KPI Monitoring Dashboard template in the Templates section. Use the drag and drop editor to adjust KPIs, edit filters, or add elements based on your data.
3. Export to Your BI Tool
Once your dashboard wireframe is ready, use the BI Tool Export feature to send it directly to Power BI or Tableau for further analysis and enhancements. You can also download the dashboard as a PDF, PNG, or JPEG, embed it on a platform, or invite your team to collaborate.
Note: This is a Pro template. You’ll need a Pro subscription on Mokkup to use and customize this dashboard wireframe. Upgrade anytime to unlock full access.
Wind Power Plant Corporate Strategy & KPI Monitoring Dashboard Example
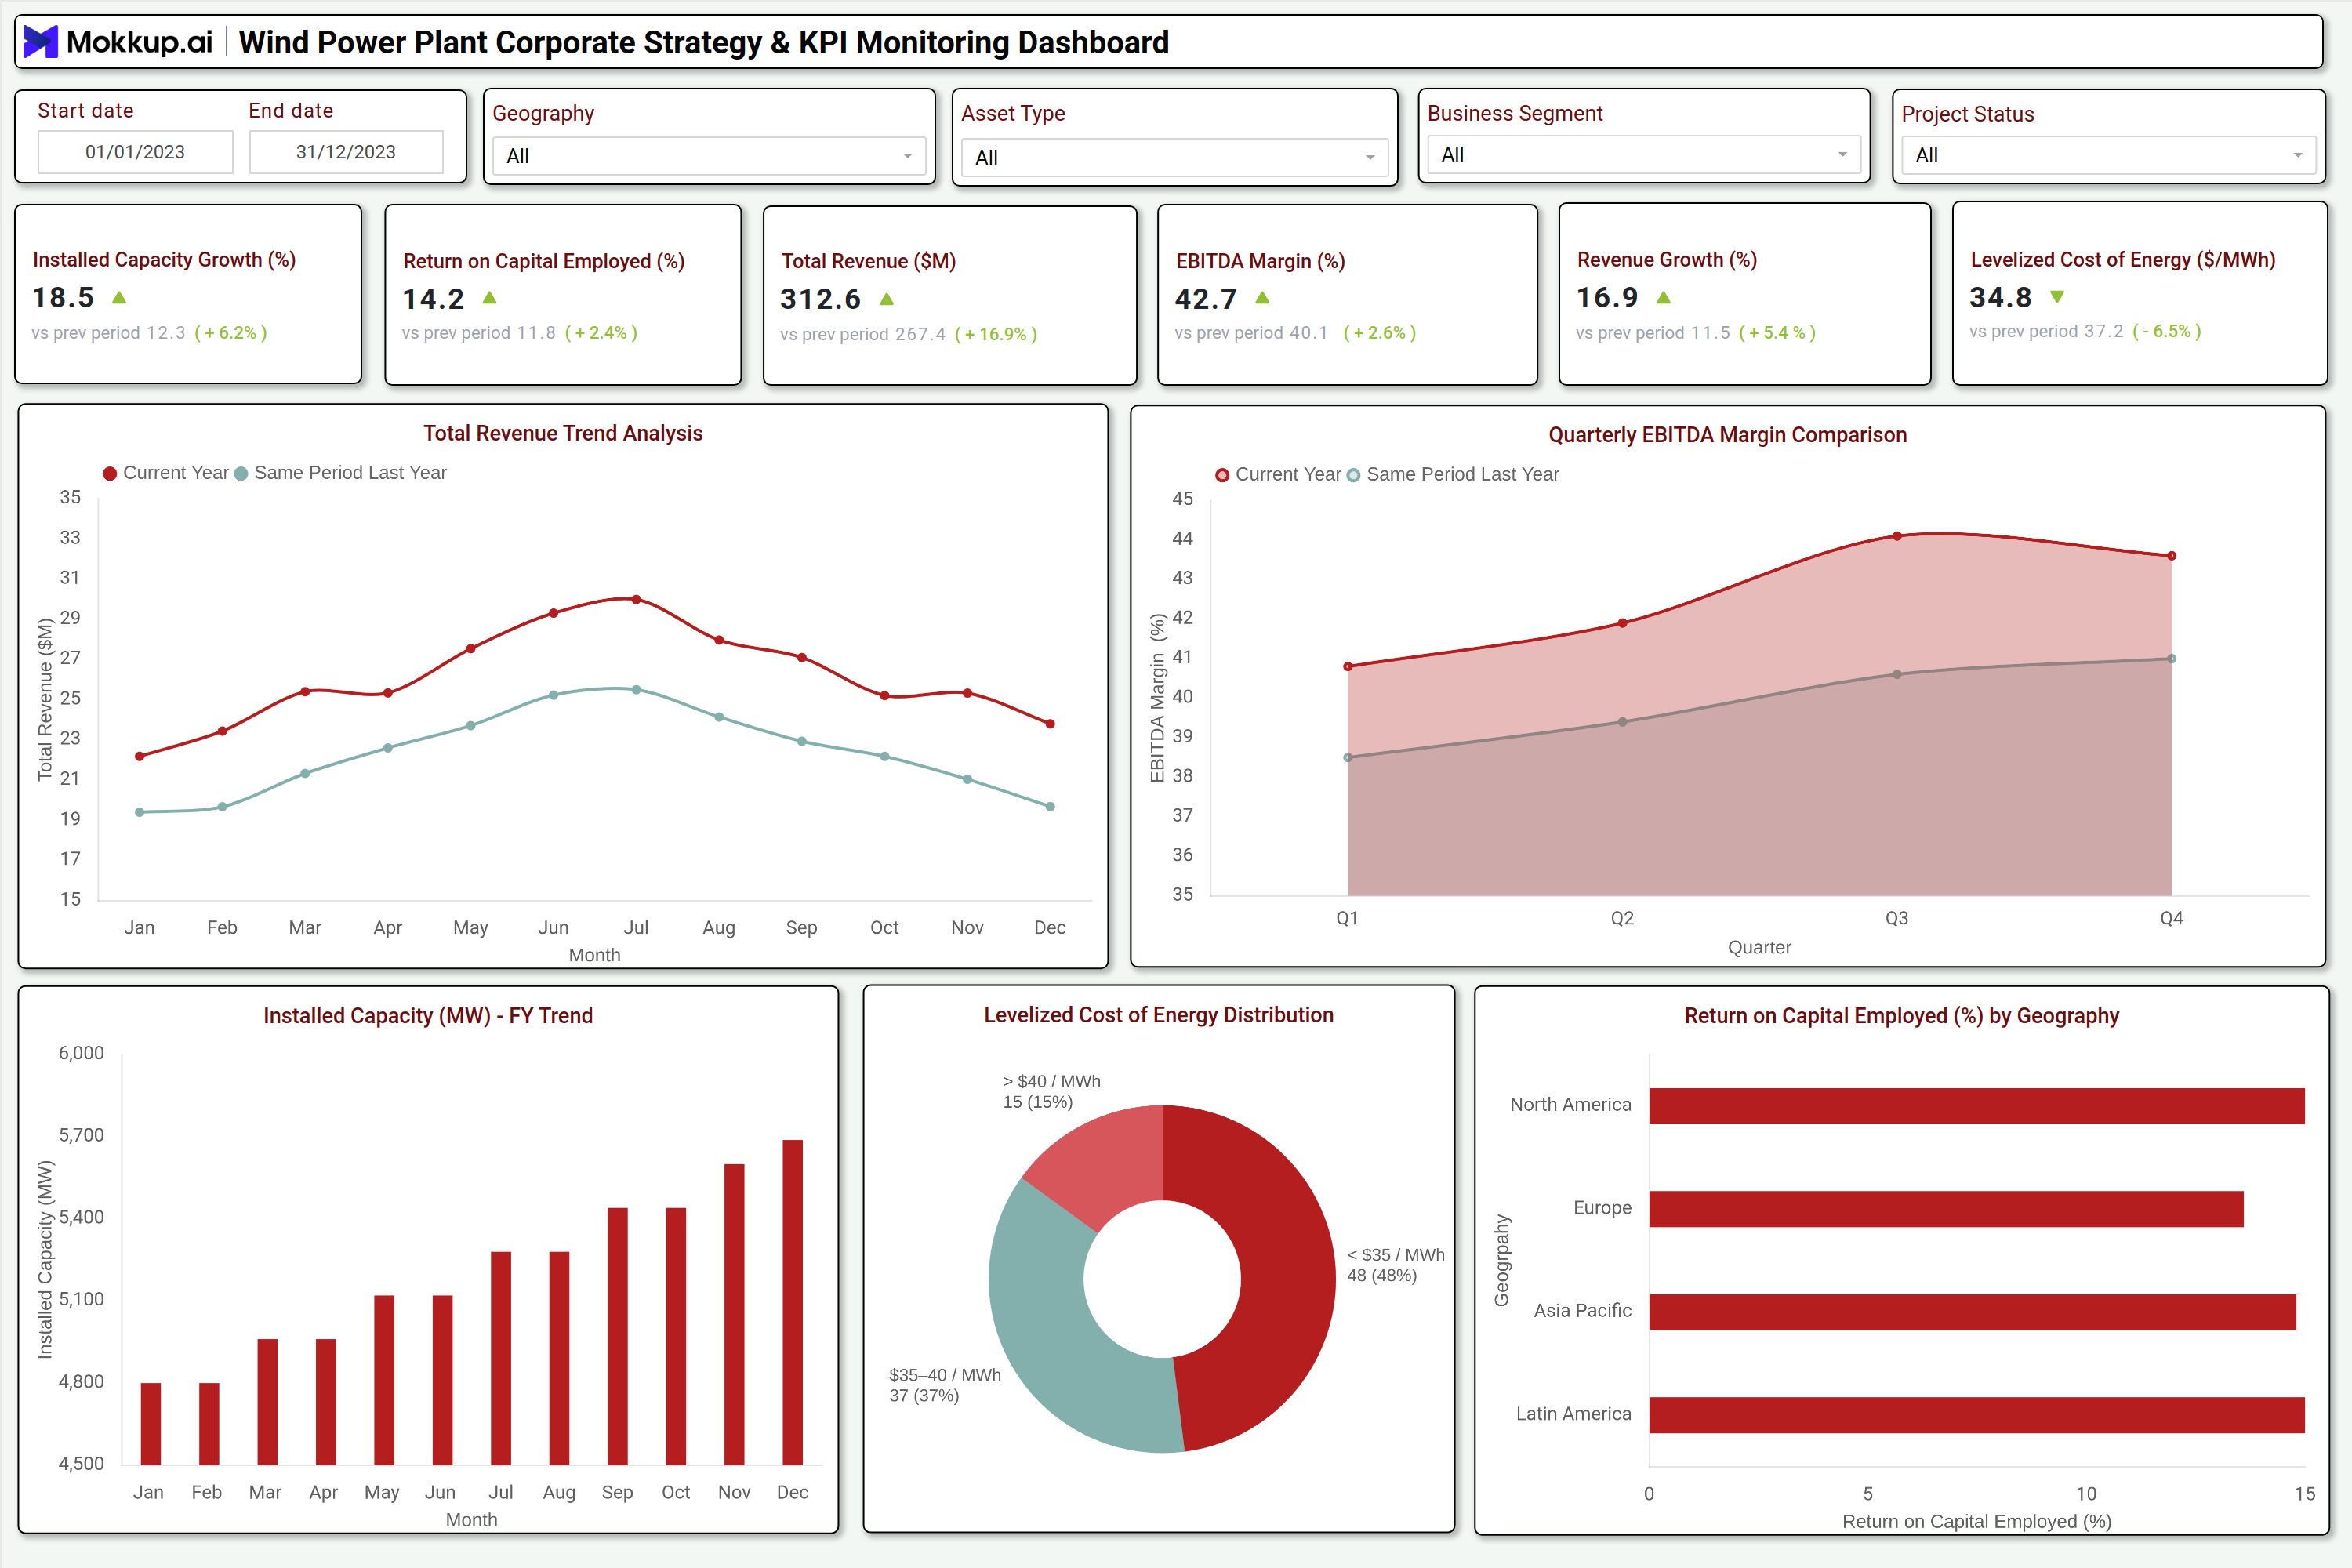
A typical wind power plant corporate strategy dashboard presents high-level KPIs at the top, including installed capacity growth percentage, total revenue, EBITDA margin, revenue growth, ROCE, and LCOE. Interactive filters, including date range, geography, asset type, business segment, and project status, enable users to analyze performance across utility-scale wind portfolios. Trend charts compare current-year revenue to the previous year's revenue to highlight growth consistency. Quarterly EBITDA margin analysis reveals profitability trends, while installed capacity trends track the progress of expansion. A donut chart visualizes LCOE distribution, supporting cost benchmarking, and regional ROCE comparisons highlight capital efficiency across markets. This structure enables executives to assess strategic alignment and identify performance gaps quickly.
How to Analyze Data in a Wind Power Plant Corporate Strategy & KPI Monitoring Dashboard
Here is how you can analyze data from this wind energy KPI monitoring dashboard for utilities:
- Review installed capacity growth: Check how capacity has expanded over time to understand whether current growth aligns with long-term corporate expansion goals.
- Compare total revenue and revenue growth: Evaluate both absolute revenue and year-over-year growth to measure the commercial strength and financial trajectory of the wind portfolio.
- Analyze quarterly EBITDA margin trends: Study EBITDA margins each quarter to determine profitability consistency and identify periods of financial volatility.
- Monitor ROCE by geography: Assess Return on Capital Employed across different regions to find high-return areas and pinpoint underperforming markets.
- Use LCOE distribution for benchmarking: Compare Levelized Cost of Energy (LCOE) across assets to understand cost efficiency and overall competitiveness.
- Compare current-year metrics with those of past periods: Examine year-on-year or quarter-on-quarter changes to assess whether strategic initiatives are yielding measurable improvements.
- Segment performance by asset type: Break down results for onshore vs. offshore assets to understand how each category contributes to returns and risk.
- Track deviations in KPIs: Spot abnormalities or sudden shifts in key indicators early to prevent or mitigate strategic and operational risks.
Benefits of a Wind Power Plant Corporate Strategy & KPI Monitoring Dashboard
The following are the benefits of using this wind power plant strategic planning dashboard:
- Provides a single source of truth for KPIs: Centralizes all high-level wind power metrics to ensure consistency across reporting and decision-making.
- Improves executive visibility: Gives leadership clear, real-time insights into corporate, financial, and operational performance.
- Supports long-term strategic planning: Helps leadership make informed decisions regarding capital allocation, expansion, and investment.
- Enables early risk identification: Highlights variations in cost, output, or profitability before they escalate.
- Enhances regional and asset-type comparisons: Facilitates benchmarking across geographies and between onshore and offshore portfolios.
- Aligns operations with corporate goals: Ensures day-to-day performance stays in line with growth, sustainability, and profitability objectives.
- Strengthens governance and reporting: Improves transparency and ensures leadership receives accurate, structured insights.
- Reduces manual reporting time: Automates data consolidation, speeding up decision cycles and enabling faster analysis.
KPIs to Track in a Wind Power Plant Corporate Strategy & KPI Monitoring Dashboard
The following key KPIs can be tracked by using this wind power plant executive KPI dashboard:
- Installed Capacity Growth (%) – Percentage increase in total installed wind power capacity over a defined period.
- Total Revenue ($M) – Total income generated from wind power operations during the reporting period.
- Revenue Growth (%) – Percentage change in total revenue compared to a previous period.
- EBITDA Margin (%) – EBITDA expressed as a percentage of total revenue, indicating operating profitability.
- Return on Capital Employed (ROCE%) – Operating profit generated as a percentage of capital employed in wind assets.
- Levelized Cost of Energy (LCOE $/MWh) – Average lifetime cost of generating one megawatt hour of electricity from wind assets.
Frequently Asked Questions
1. What is the primary purpose of a wind power corporate strategy dashboard?
It enables electric power utilities to monitor strategic, financial, and operational KPIs in one place, supporting executive decision-making.
2. Who uses this dashboard in a wind power utility?
Executive leadership, corporate strategy teams, finance heads, and utility management teams use it for performance tracking.
3. Why is LCOE important in a corporate strategy dashboard?
LCOE helps utilities benchmark the cost efficiency and competitiveness of their wind assets and regions.