What is a Wind Power Plant Carbon Offset & Sustainability Dashboard?
A Wind Power Plant Carbon Offset & Sustainability Dashboard is a centralized analytics system used by electric power utilities to monitor carbon offset performance, measure emissions avoided, and track renewable energy sustainability metrics across onshore and offshore wind farms. This wind power plant carbon offset monitoring dashboard captures both historical and real-time data related to carbon dioxide avoided (CDA), renewable energy generation, carbon intensity, carbon credit revenue, and progress toward net zero. It enables utilities to perform carbon emission reduction reporting for wind farms, supporting both regulatory compliance and ESG disclosures. By consolidating environmental metrics, green energy output, and verified carbon credits into a single interface, the dashboard serves as a sustainability analytics dashboard for a renewable energy utility, validating the long-term environmental and financial value of wind power assets.
How to Create a Wind Power Plant Carbon Offset & Sustainability Dashboard
You don’t need to build your report from scratch. Start with a ready to use wind energy sustainability performance tracking tool from Mokkup and customize it with your data:
1. Create or Log in to Your Mokkup Account
Start by signing up on Mokkup.ai using your email. If you already have an account, just log in, and you’ll be good to go.
2. Choose and Customize Your Dashboard Template
Find the Wind Power Plant Carbon Offset & Sustainability Dashboard template in the Templates section. Use the drag and drop editor to adjust KPIs, edit filters, or add elements based on your data.
3. Export to Your BI Tool
Once your dashboard wireframe is ready, use the BI Tool Export feature to send it directly to Power BI or Tableau for further analysis and enhancements. You can also download the dashboard as a PDF, PNG, or JPEG, embed it on a platform, or invite your team to collaborate.
Note: This is a Pro template. You’ll need a Pro subscription on Mokkup to use and customize this dashboard wireframe. Upgrade anytime to unlock full access.
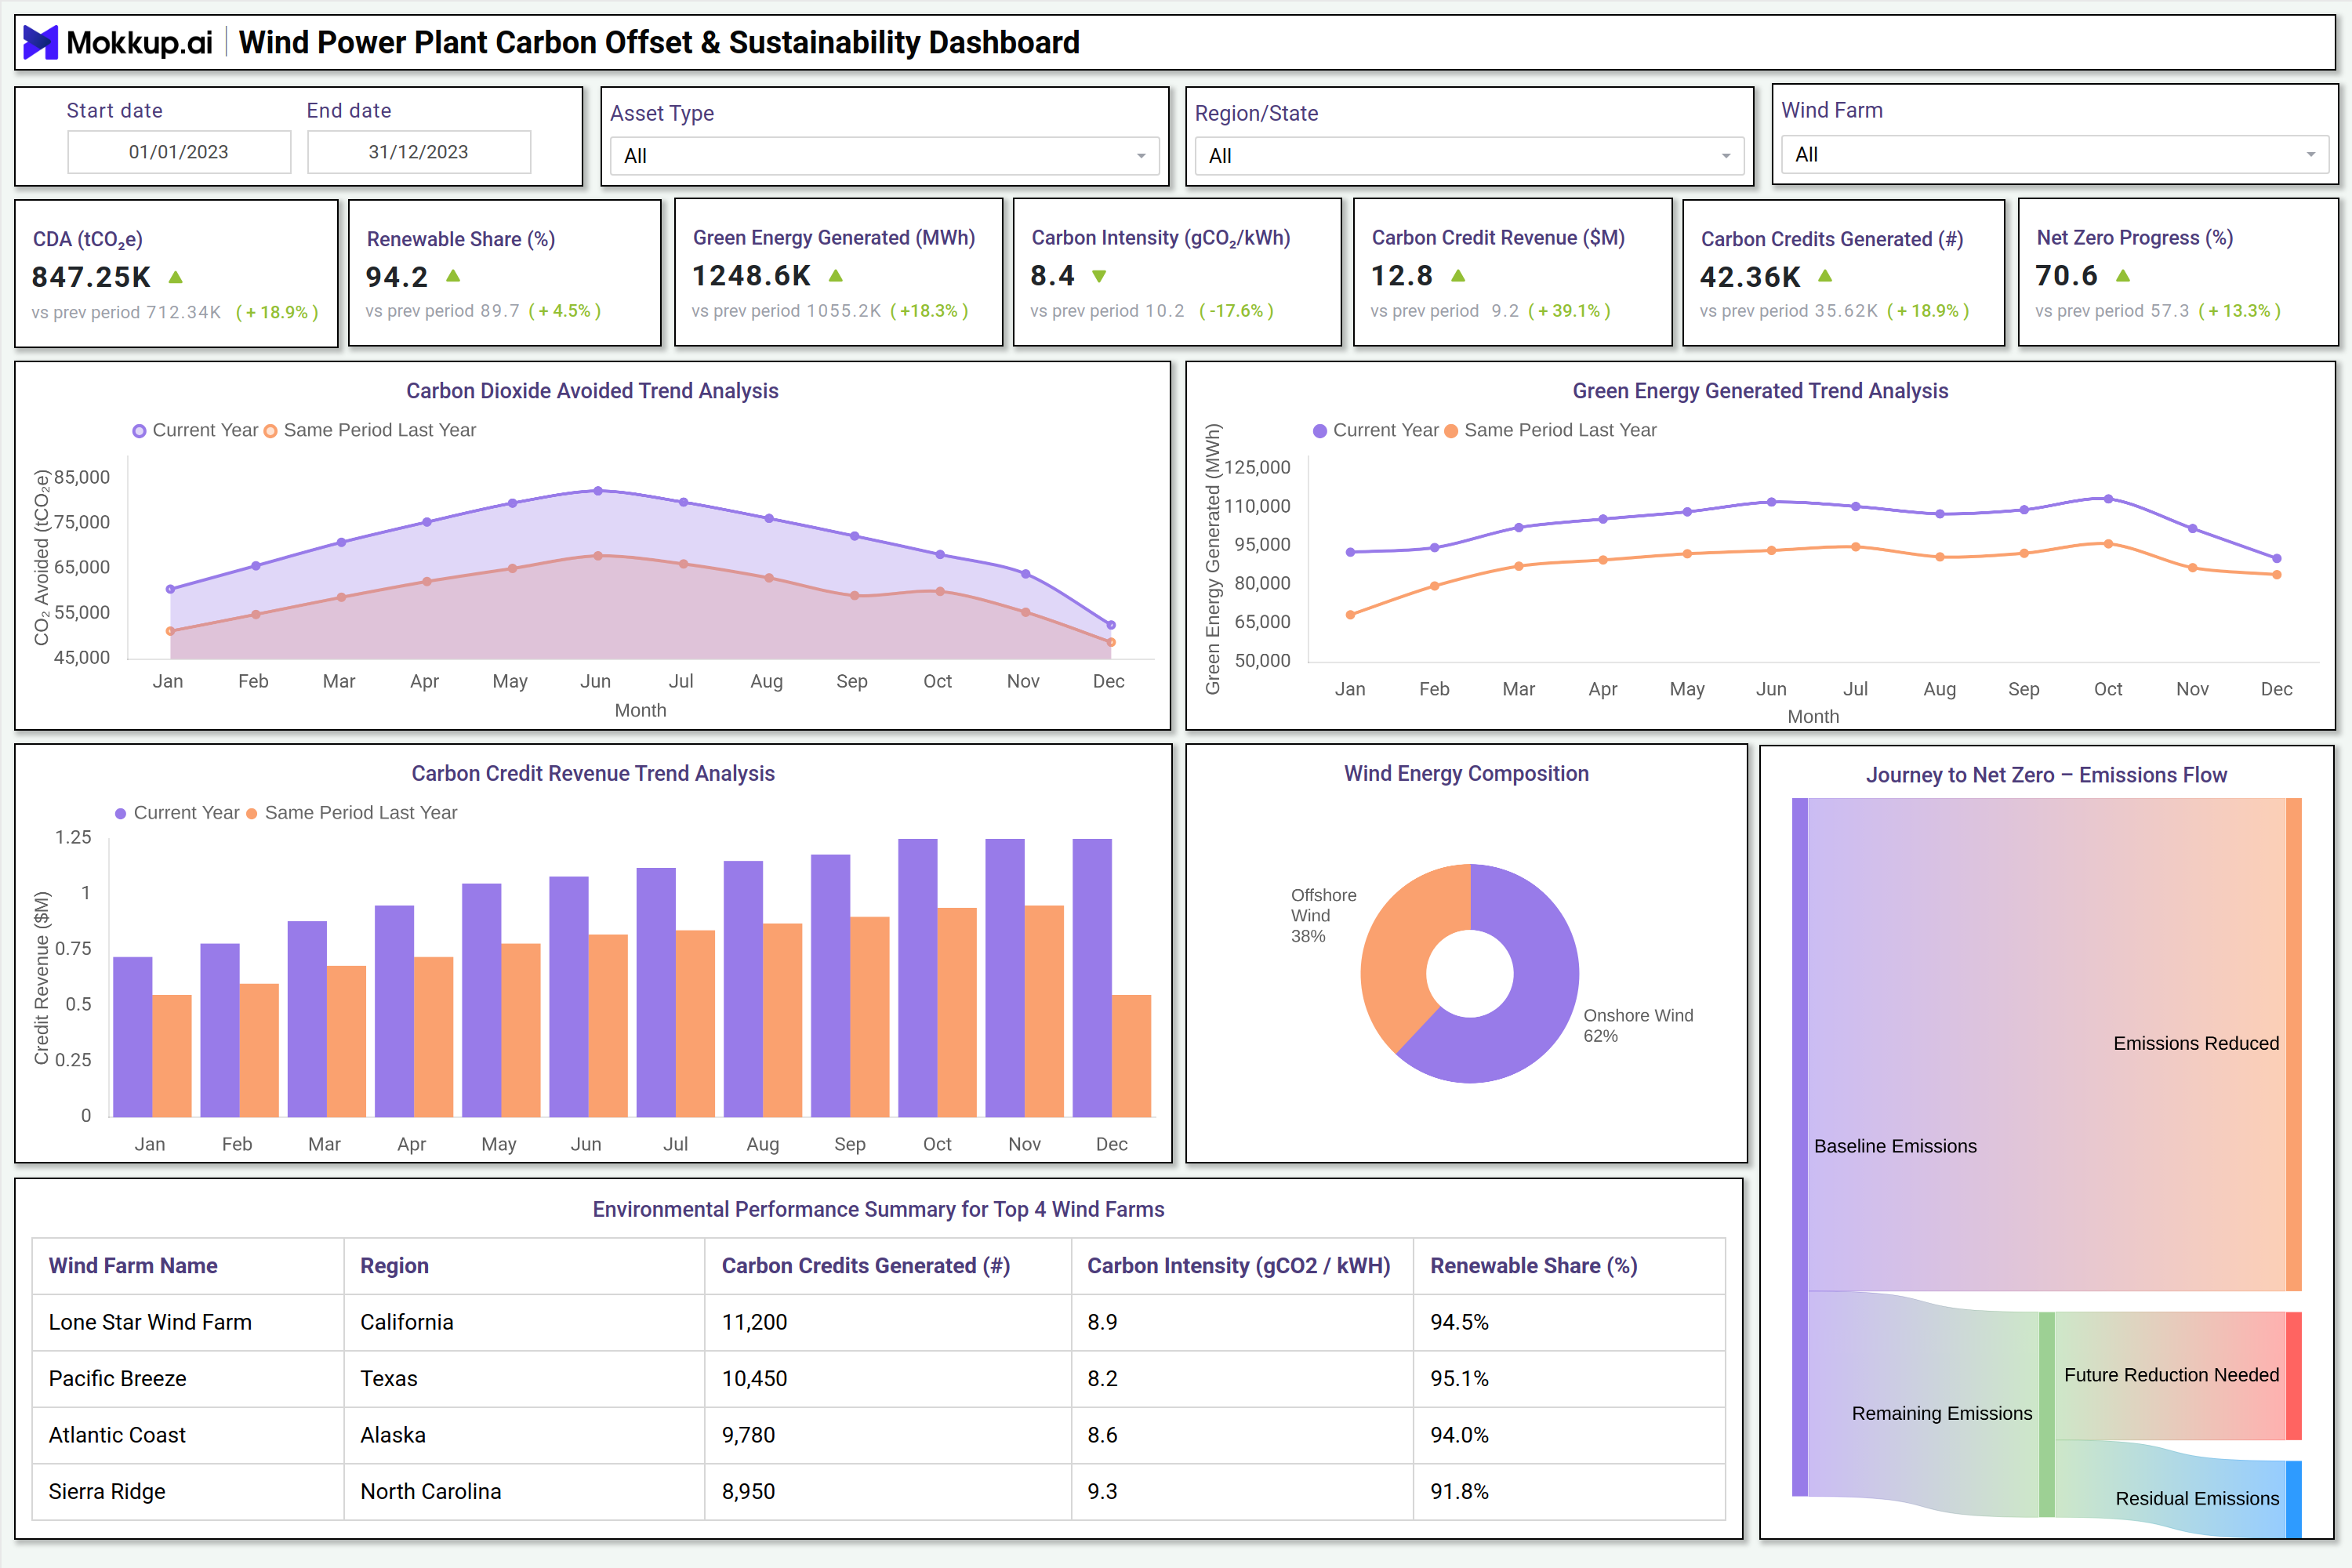
Wind Power Plant Carbon Offset & Sustainability Dashboard Example
The dashboard example shown above displays how electric power utilities can visualize wind energy performance across multiple locations. It includes trend graphs for carbon dioxide avoided, renewable energy generated, and carbon credit revenue over the year. The interface highlights key metrics, including CDA (Carbon Dioxide Avoided), renewable share, green energy generated, carbon intensity, and progress toward net zero. The design also includes a breakdown of wind energy composition (onshore vs. offshore) and an emissions flow visualization that shows baseline emissions, reductions achieved, remaining emissions, and future reductions required. A summary table compares top wind farms by carbon credits generated, carbon intensity, region, and renewable share. This structured layout helps operators understand where sustainability gains are coming from, how revenue from carbon credits is progressing, and what actions are needed to improve carbon reduction efficiency.
How to Analyze Data in a Wind Power Plant Carbon Offset & Sustainability Dashboard
Here is how you can analyze data from this dashboard:
- Review CDA (tCO₂e): Understand the total emissions avoided through wind power generation and assess how effectively the plant offsets carbon.
- Compare Renewable Share (%): Check how the share of wind power in the total energy mix has changed over time to evaluate clean energy adoption.
- Evaluate Green Energy Generated (MWh): Identify monthly or seasonal variations in wind performance to understand production patterns and capacity utilization.
- Analyze Carbon Intensity (gCO₂/kWh): Measure improvements in emissions efficiency across onshore and offshore assets to track sustainability progress.
- Track Carbon Credit Revenue ($M): Determine financial returns generated from verified carbon offsets and understand their contribution to profitability.
- Use the Wind Energy Composition Chart: Assess how much each asset type: onshore vs. offshore contributes to total wind energy production.
- Refer to Net Zero Progress (%): Check how close the utility is to achieving long-term decarbonization goals and whether additional actions are needed.
- Examine the Environmental Performance Summary Table: Compare wind farms across key metrics, including carbon credits generated, carbon intensity, and renewable energy share and identify top and low performers.
Benefits of a Wind Power Plant Carbon Offset & Sustainability Dashboard
The following are the benefits of using this dashboard:
- Provides a unified view of sustainability metrics: Integrates energy generation, emissions reduction, and environmental performance into a single source of truth.
- Supports accurate GHG reduction calculations: Helps utilities measure and report greenhouse gas reductions across distributed wind farm locations.
- Quantifies financial gains from carbon credits: Shows how much revenue is generated through verified carbon offset mechanisms.
- Strengthens ESG transparency: Delivers verifiable, traceable data for stakeholders, auditors, and sustainability reporting frameworks.
- Identifies performance gaps in wind assets: Highlights operational inefficiencies across onshore and offshore wind farms.
- Enhances regulatory compliance: Supports environmental reporting requirements and sustainability audits with continuous tracking.
- Aids in strategic net-zero planning: Provides insights required for roadmap execution and long-term decarbonization strategy.
- Improves operational decision-making: Guides turbine optimization, maintenance planning, and energy dispatch decisions with real-time insights.
KPIs to Track in a Wind Power Plant Carbon Offset & Sustainability Dashboard
The following key KPIs can be tracked by using this offshore wind power carbon footprint management system:
- CDA (Carbon Dioxide Avoided) – Total CO₂ emissions reduced from wind power generation.
- Renewable Share (%) – Percentage of total power output sourced from wind assets.
- Green Energy Generated (MWh) – Wind energy output for onshore and offshore plants.
- Carbon Intensity (gCO₂/kWh) – Emissions per unit of electricity generated.
- Carbon Credit Revenue ($M) – Verified revenue earned from carbon offsets.
- Carbon Credits Generated (#) – Number of certified carbon credits produced.
- Net Zero Progress (%) – Percentage completion toward long-term emission reduction goals.
Frequently Asked Questions
1. What is the purpose of a wind power plant's carbon offset monitoring dashboard?
It helps utilities track emissions avoided, renewable energy generated, and carbon credits earned from wind operations.
2. Can this dashboard be used for both onshore and offshore wind farms?
Yes. The dashboard tracks performance and emissions metrics for both asset types, individually and in combination.
3. How does the dashboard support sustainability reporting?
It provides verified metrics such as carbon intensity, carbon credits, renewable share, and CO₂ avoided, which are essential for ESG disclosure.