What is a Nuclear Power Plant Sustainability & Compliance Dashboard?
A Nuclear Power Plant Sustainability & Compliance Dashboard template is a digital system designed to track environmental impact, sustainability performance, and regulatory compliance across nuclear power operations. It consolidates data related to emissions, waste management, water consumption, thermal discharge, and carbon intensity into a single visual platform.
By integrating nuclear plant sustainability performance, environmental compliance monitoring, and nuclear emissions reporting analytics, the dashboard enables plant operators to maintain transparency, optimize resource utilization, and meet national and international environmental standards. The dashboard wireframe acts as a central tool for tracking compliance trends, evaluating reactor energy efficiency, and identifying areas that require corrective or preventive actions.
How to Create a Nuclear Power Plant Sustainability & Compliance Dashboard
You don’t need to build your report from scratch—just start with a ready-to-use Nuclear Power Plant Sustainability & Compliance dashboard template from Mokkup. Add in your data and export it however you like. Here’s how to do it:
1. Create or Log in to Your Mokkup Account
Start by signing up on Mokkup.ai using your email. If you already have an account, just log in, and you’ll be good to go.
2. Choose and Customize Your Dashboard Template
Find the Nuclear Power Plant Sustainability & Compliance Dashboard template in the Templates section. Use the drag-and-drop editor to adjust KPIs, edit filters, or add elements based on your data.
3. Export to Your BI Tool
Once your dashboard wireframe is ready, use the BI Tool Export feature to send it directly to Power BI or Tableau for further analysis and enhancements. You can also download the dashboard as a PDF, PNG, or JPEG, embed it on a platform, or invite your team to collaborate.
Note: This is a Pro template. You’ll need a Pro subscription on Mokkup to use and customize this dashboard wireframe. Upgrade anytime to unlock full access.
Nuclear Power Plant Sustainability & Compliance Dashboard Example
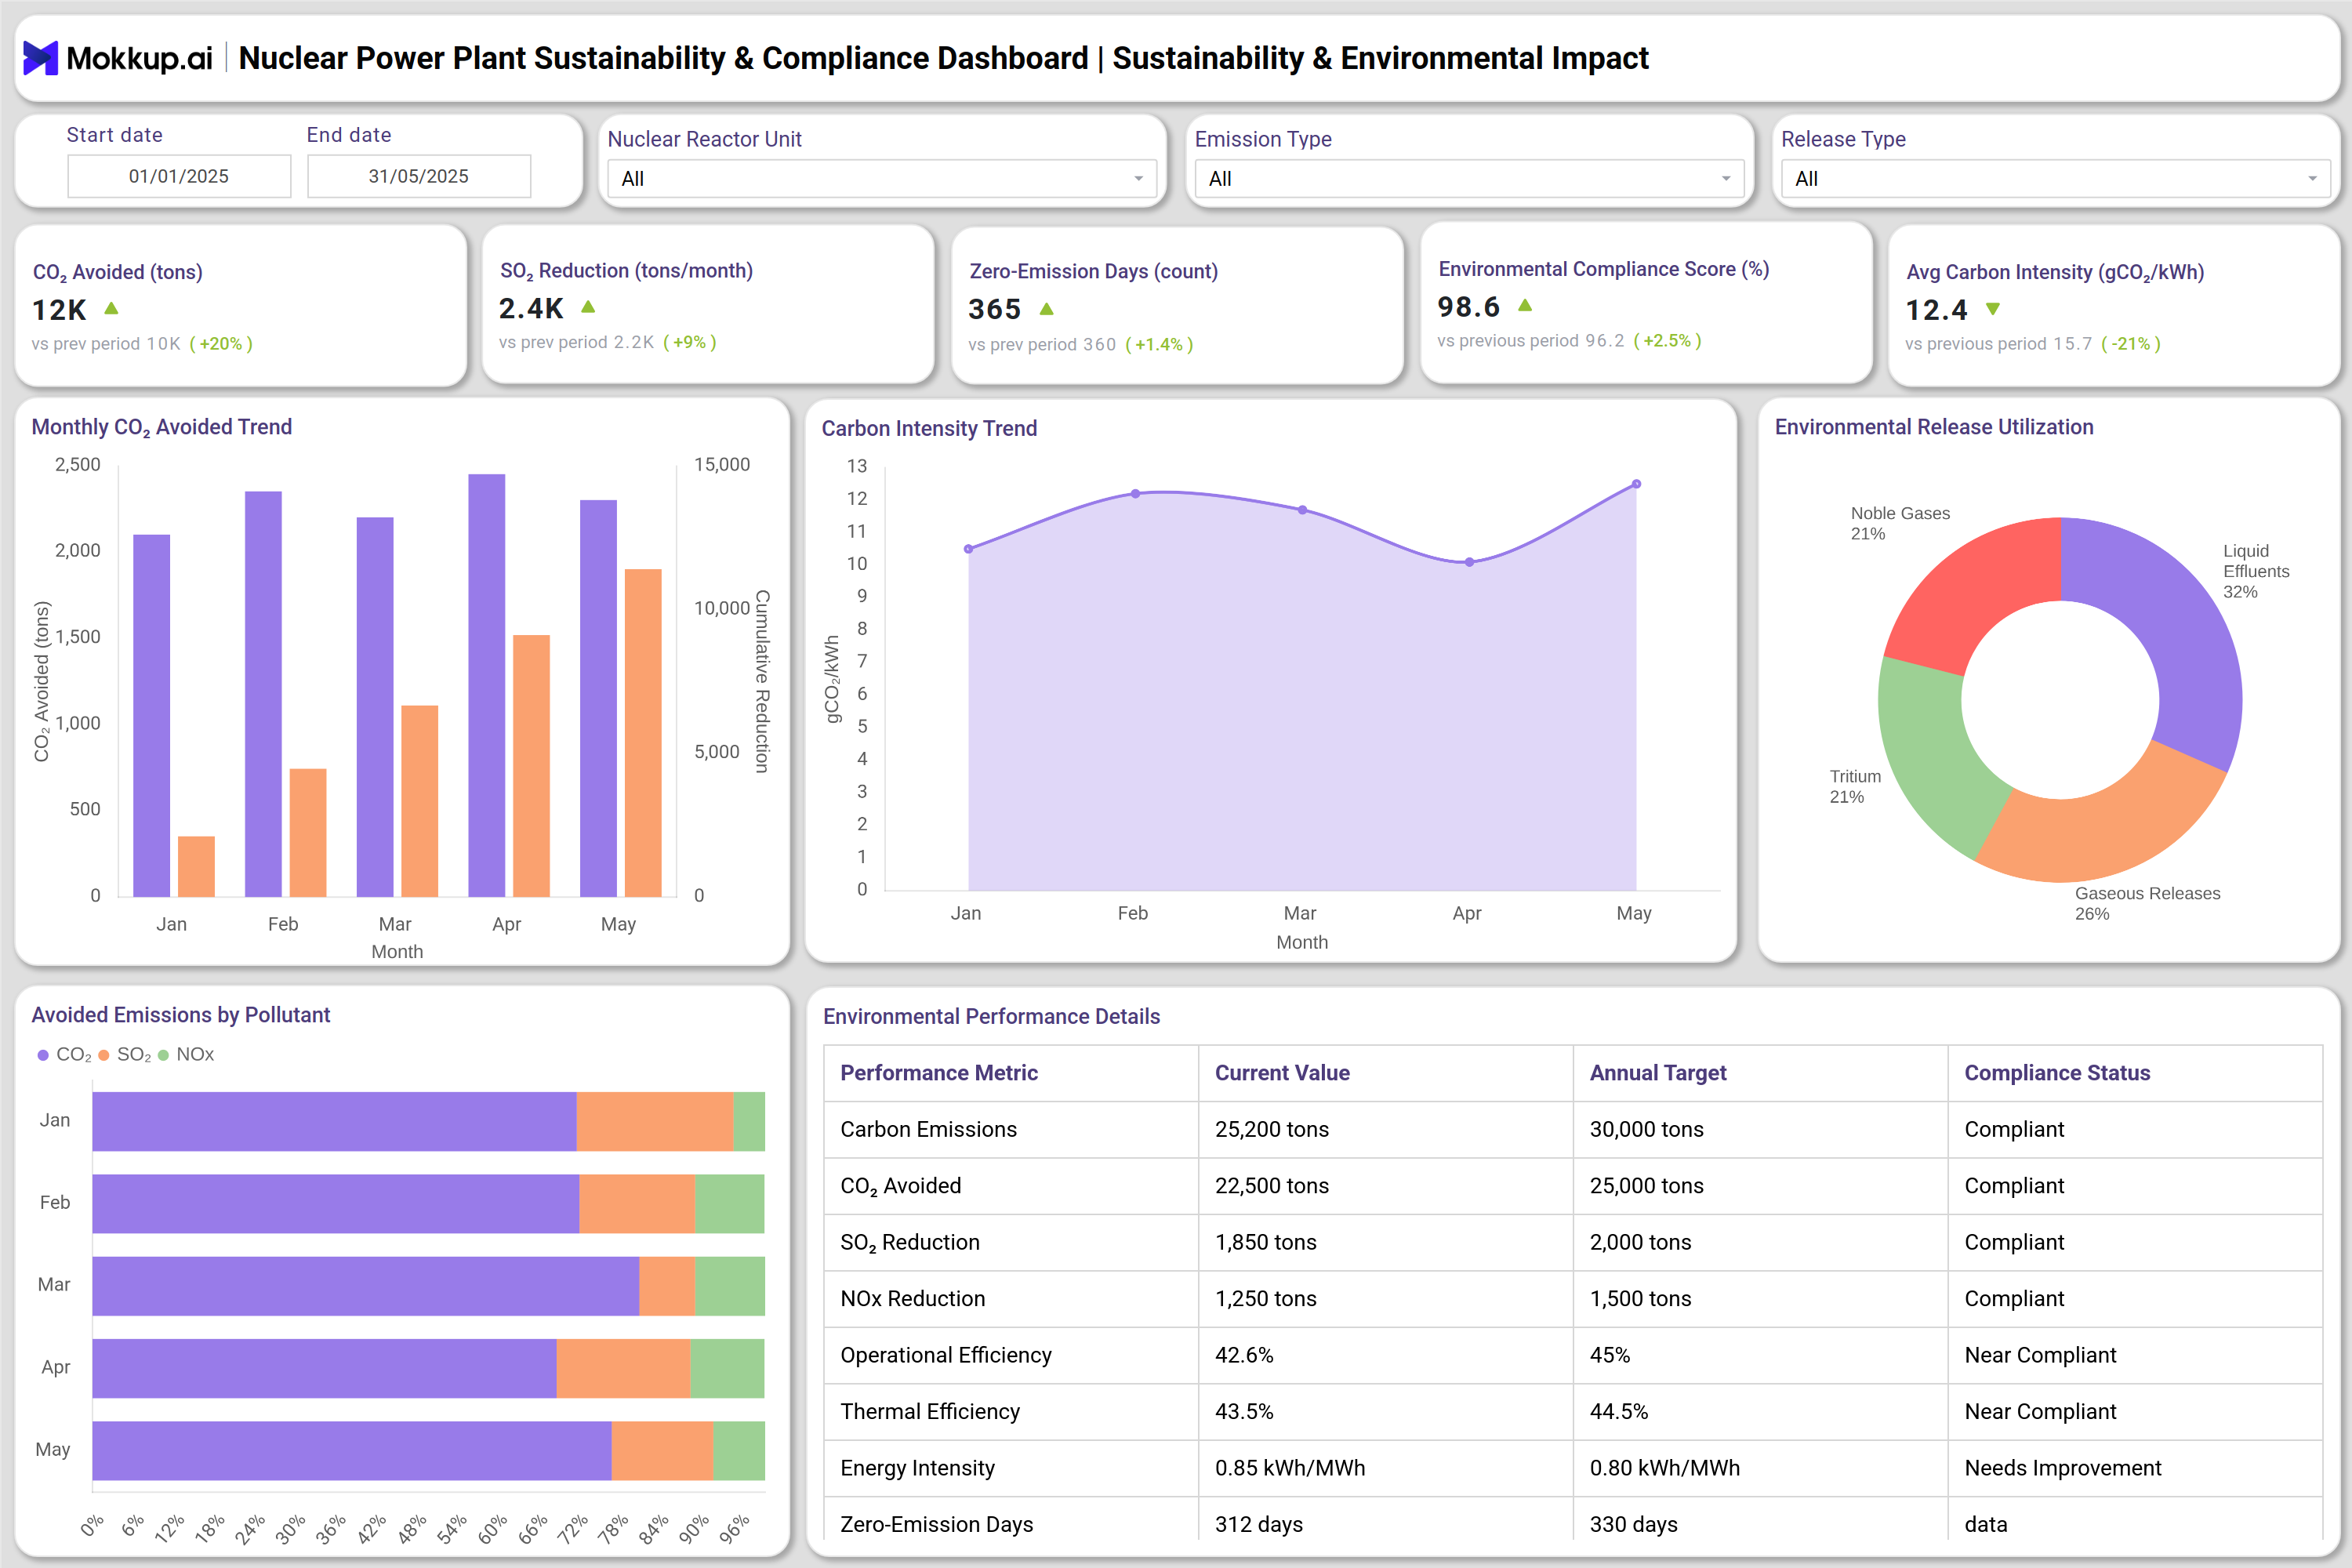
You can create a Nuclear Power Plant Sustainability & Compliance Dashboard that brings together sustainability, emissions monitoring, and resource management modules into a unified view. A typical dashboard includes the Sustainability & Environmental Impact section, where users can track CO₂ avoided, SO₂ reduction, zero-emission days, environmental compliance scores, and carbon intensity. Visual charts help compare monthly CO₂ avoidance, monitor carbon intensity trends, and analyze the utilization of ecological releases across noble gases, tritium, liquid effluents, and gaseous emissions.
The Water, Waste & Resource Impact Management dashboard builds on this by displaying water withdrawal patterns, thermal discharge temperatures, radioactive waste volumes, and waste recycling rates. Doughnut charts illustrate the distribution of waste management practices, including recycling, secure storage, treatment, and deep geological disposal. The spent fuel inventory panel provides detailed insights into fuel type, storage location, volume, and age profile, supporting robust nuclear waste management compliance. Together, these modules offer valuable insights into nuclear facility sustainability, enabling operators to ensure efficient energy use, maintain regulatory compliance, and minimize their environmental impact.
How to Analyze Data in Nuclear Power Plant Sustainability & Compliance Dashboard
Use this dashboard to monitor environmental performance, emission reduction, and compliance across nuclear plant operations:
- Emission Reduction Trends: Review monthly CO₂ and SO₂ reduction trends to measure sustainability improvements.
- Carbon Intensity Monitoring: Compare current carbon intensity values against historical data to evaluate reactor energy efficiency.
- Environmental Release Analysis: Assess the distribution of gaseous, liquid, and tritium releases to understand ecological impact patterns.
- Waste Management Review: Monitor waste recycling percentages and waste distribution for nuclear waste compliance.
- Water & Thermal Discharge Tracking: Review water withdrawal and discharge temperature to identify high-consumption or high-impact zones.
- Spent Fuel Inventory Assessment: Use spent fuel logs to analyze aging profiles and optimize storage strategies.
- Compliance Score Evaluation: Review compliance scores to identify units or emission types needing corrective actions.
- Target Performance Comparison: Compare performance metrics against annual sustainability and compliance goals.
Benefits of Nuclear Power Plant Sustainability & Compliance Dashboard
This dashboard helps plants strengthen environmental governance, track sustainability KPIs, and maintain transparency with regulators:
- Centralized Environmental Visibility: Provides a unified view of environmental performance.
- Regulatory Reporting Support: Automates nuclear emissions reporting analytics.
- Sustainability Decision-Making: Offers data-driven insights for long-term planning.
- Early Risk Detection: Flags deviations from sustainability and compliance thresholds.
- Reactor Efficiency Improvement: Enhances reactor energy efficiency tracking.
- Stronger Waste Compliance: Monitors waste volumes, recycling, and processing adherence.
- Reduced Reporting Workload: Automates data aggregation across sources.
- Audit Transparency: Ensures clear visibility for certifications and audits.
KPIs to Track in Nuclear Power Plant Sustainability & Compliance Dashboard
These KPIs help measure environmental performance, regulatory compliance, and progress toward sustainability:
- CO₂ Avoided (tons): Measures carbon emissions prevented through nuclear generation.
- SO₂ Reduction (tons/month): Tracks monthly sulfur dioxide reduction.
- Environmental Compliance Score (%): Evaluates adherence to environmental regulations.
- Zero-Emission Days (count): Counts days without release events.
- Carbon Intensity (gCO₂/kWh): Measures emissions per unit of electricity generated.
- Environmental Release Utilization (%): Tracks gaseous, liquid, and tritium release allocations.
- Avoided Emissions (CO₂, SO₂, NOx): Measures avoided pollution by emission type.
Frequently Asked Questions
Q1. What is the purpose of a nuclear sustainability dashboard?
It helps monitor environmental compliance, track emissions, and improve sustainability performance across plant operations.
Q2. Can the dashboard support regulatory audits?
Yes. It consolidates emissions, waste, and compliance data required for environmental reporting.
Q3. How does the dashboard improve sustainability performance?
It provides insights into energy efficiency, waste reduction, and resource optimization.
Q4. Does it track radioactive waste?
Yes. It monitors waste volumes, types, storage locations, and recycling compliance.
Q5. Who uses this dashboard?
Environmental teams, operations managers, compliance officers, safety engineers, and regulatory auditors.