The Carbon Footprint Tracker dashboard template provides a comprehensive view of your organization’s environmental impact. It highlights key metrics like emissions by source, energy usage, and waste management trends. This template simplifies monitoring, helping you identify areas to reduce carbon emissions, align with sustainability goals, and make data-driven decisions for a greener future.
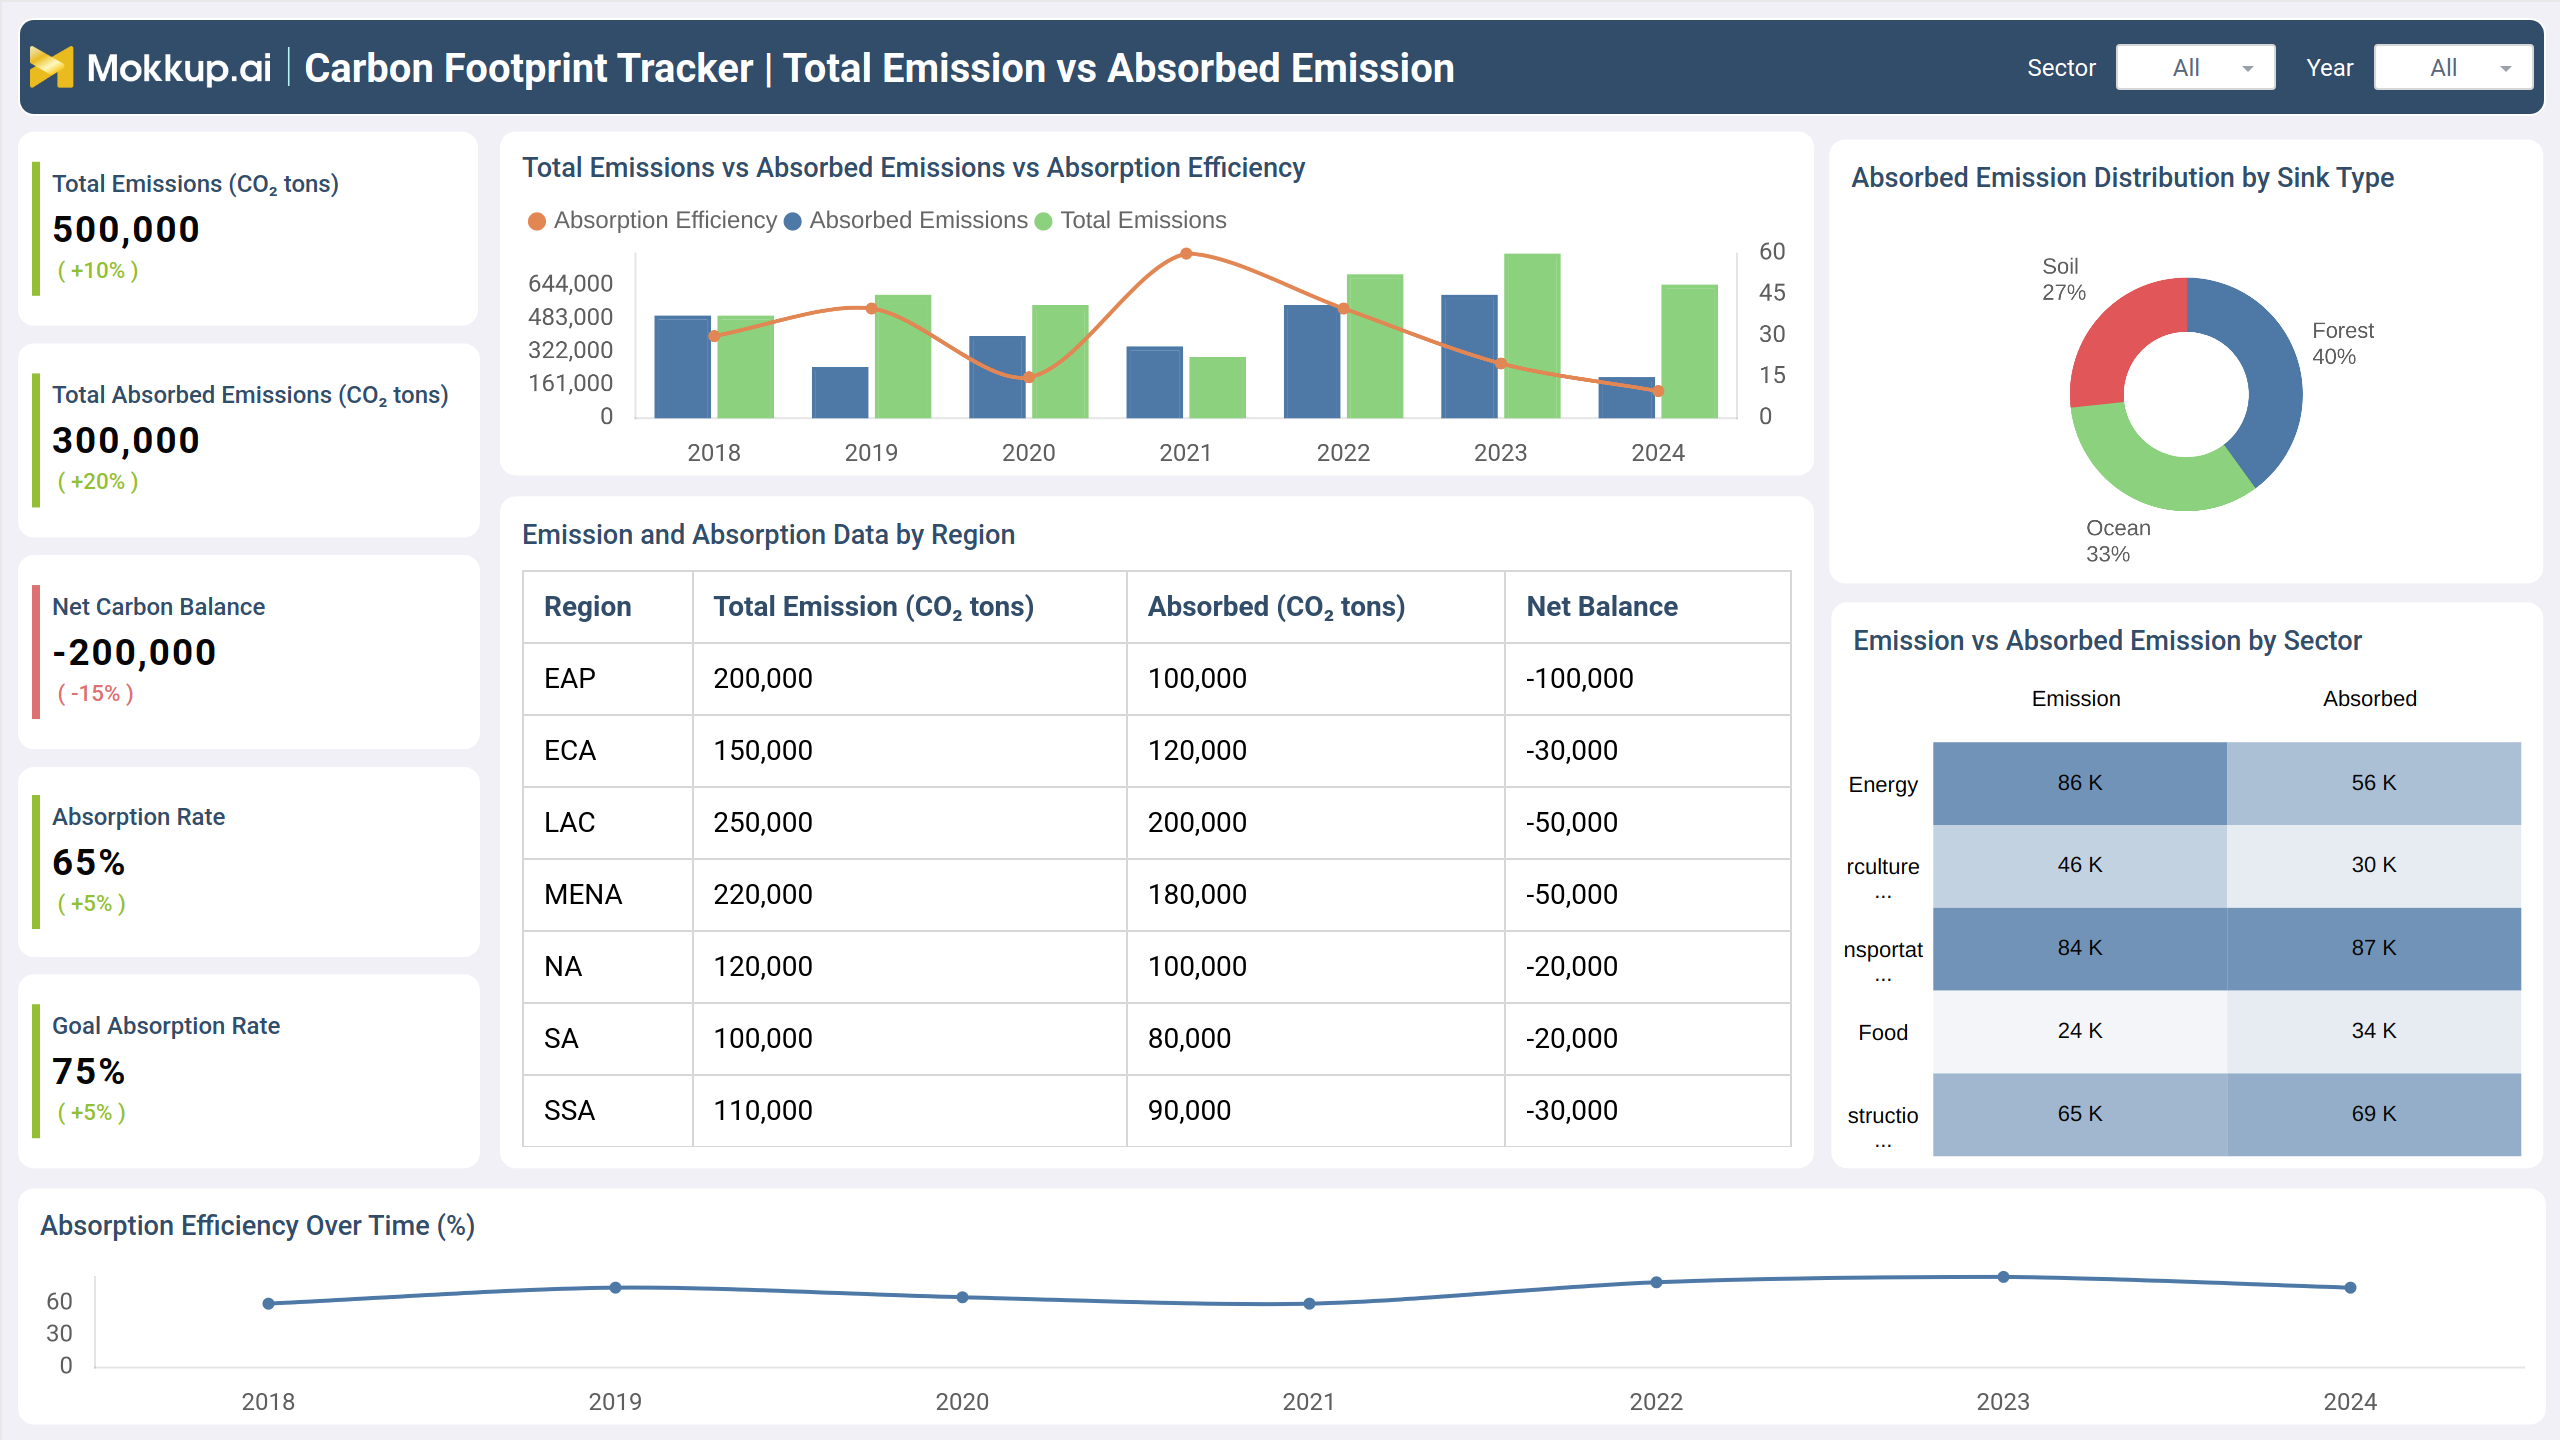
Total Emission vs Absorbed Emission
This screen provides a comprehensive visual analysis, showcasing comparisons and trends to support environmental progress. It highlights critical insights for tracking performance over time and across regions, encouraging actionable steps toward better outcomes. The intuitive design simplifies understanding, helping users focus on areas requiring attention and improvement.
Key Terms to Know
- Total Emissions (CO₂ tons): Displays the total amount of emissions generated, with a percentage change compared to the previous period.
- Total Absorbed Emissions (CO₂ tons): Highlights the total emissions absorbed and its comparative growth.
- Net Carbon Balance: Reflects the difference between emissions and absorption, indicating progress toward achieving balance.
- Absorption Rate: Shows the percentage of emissions absorbed out of the total, emphasizing efficiency.
- Goal Absorption Rate: Represents the target absorption rate for achieving desired sustainability objectives.
- Emission and Absorption Data by Region: Compares emissions, absorption, and net balance across various regions.
- Absorbed Emission Distribution by Sink Type: Visualizes the contribution of different sink types like soil, forest, and ocean.
- Emission vs. Absorbed Emission by Sector: Breaks down emissions and absorption across key industries for actionable insights.
- Absorption Efficiency Over Time (%): Tracks efficiency trends over years to measure progress.
Carbon Neutrality by Natural Methods
This screen shows insights into progress achieved using various strategies, emphasizing contributions from multiple initiatives. It highlights regional data, ongoing efforts, and completion timelines while showcasing distribution trends and patterns. The visual elements help in tracking overall advancements and regional variations effectively over time.
Key Terms to Know
- Total Carbon Neutrality: Reflects the overall reduction achieved, showcasing the balance of emissions offset.
- Afforestation Contribution: Represents the share of reductions attributed to new vegetation efforts.
- Reforestation Contribution: Denotes the impact from restoring existing vegetation.
- Soil Sequestration Contribution: Highlights the portion of absorption achieved through soil management techniques.
- Neutrality Achievement: Indicates the percentage progress toward achieving targets through natural approaches.
Carbon Footprint Monitoring
This screen provides an overview of environmental metrics, highlighting progress in areas such as emission reduction, energy use, water conservation, and waste management. It includes breakdowns by operational sites and sources, along with trends over time, offering actionable insights into sustainability efforts.
Key Terms to Know
- Change in Carbon Emissions (%): Measures the percentage increase or decrease in total carbon emissions compared to the previous reporting period.
- Carbon Offset Achieved (tons): Represents the total amount of carbon emissions neutralized through mitigation measures like offset programs.
- Renewable Energy Usage (MWh): Indicates the amount of energy consumed from renewable sources, expressed in megawatt-hours.
- Waste Reduction (% compared to previous year): Tracks the reduction in generated waste, expressed as a percentage change from the prior year.
- Water Conservation (Emission tons): Quantifies the reduction in emissions achieved through water conservation measures, expressed in tons.
- Carbon Emissions by Operational Site: Analyzes the emissions generated by different locations (factory, office, residence) over time.
- Detailed Environmental Metrics: Provides data on energy consumption, water usage, and waste generated for individual facilities.
- Breakdown of Emissions by Source: Categorizes emissions based on contributing sources such as energy use, transportation, and manufacturing.
- Trend of Overall Carbon Emissions Over Time: Illustrates changes in total emissions over a series of years, identifying patterns or trends.
Dashboard Template Insights
Here are key insights from the dashboard wireframe:
- The dashboard tracks emissions across various categories, enabling users to identify high-impact areas and prioritize efforts to reduce their carbon footprint.
- With historical data visualizations, users can monitor changes in emissions over time, ensuring alignment with sustainability goals.
- Detailed breakdowns by activities such as energy use, transportation, and waste help pinpoint specific contributors to carbon emissions.
- Features like filters and comparison tools allow users to explore data dynamically and plan actionable strategies for reduction effectively.
Conclusion
The Carbon Footprint Tracker dashboard empowers users to make informed decisions for a sustainable future by providing actionable insights, trend analysis, and category-specific data. Its interactive features promote proactive planning, enabling individuals and organizations to effectively monitor, reduce, and manage their carbon emissions over time.