
What is a Water Treatment SCADA Reliability & Control Performance Dashboard?
The Water Treatment SCADA Reliability & Control Performance Dashboard is a purpose-built monitoring tool for water utility operations teams responsible for maintaining continuous, safe, and efficient treatment across intake, pre-treatment, filtration, disinfection, and distribution stages. Unlike generic operational dashboards, this template is structured around the specific control systems and telemetry environments that govern modern water treatment, including SCADA system uptime tracking, automation coverage rates, alarm management, and device communication reliability. Operations managers and control engineers use this water treatment SCADA dashboard to monitor how effectively automated systems are performing versus manual intervention, where process stability is holding or degrading, and how quickly control commands are being executed across regions. The dashboard integrates system-level reliability data with stage-level operational metrics to provide a complete picture of control performance across the entire treatment pipeline.
How to Create a Water Treatment SCADA Reliability & Control Performance Dashboard
You don’t need to build your report from scratch, just start with a ready-to-use dashboard template from Mokkup. Add in your data and export it however you like. Here’s how to do it:
1. Create or Log in to Your Mokkup Account
Start by signing up on Mokkup.ai using your email. If you already have an account, just log in, and you'll be good to go.
2. Choose and Customize Your Dashboard Template
Find the Water Treatment SCADA Reliability & Control Performance Dashboard template in the Templates section. Use the drag-and-drop editor to adjust KPIs, edit filters, or add elements based on your data.
3. Export to Your BI Tool
Once your dashboard wireframe is ready, use the BI Tool Export feature to send it directly to Power BI or Tableau for further analysis and enhancements. You can also download the dashboard as a PDF, PNG, or JPEG, embed it on a platform, or invite your team to collaborate.
Note: This is a Pro template. You'll need a Pro subscription on Mokkup to use and customize this dashboard wireframe. Upgrade anytime to unlock full access.
Water Treatment SCADA Reliability & Control Performance Dashboard Example
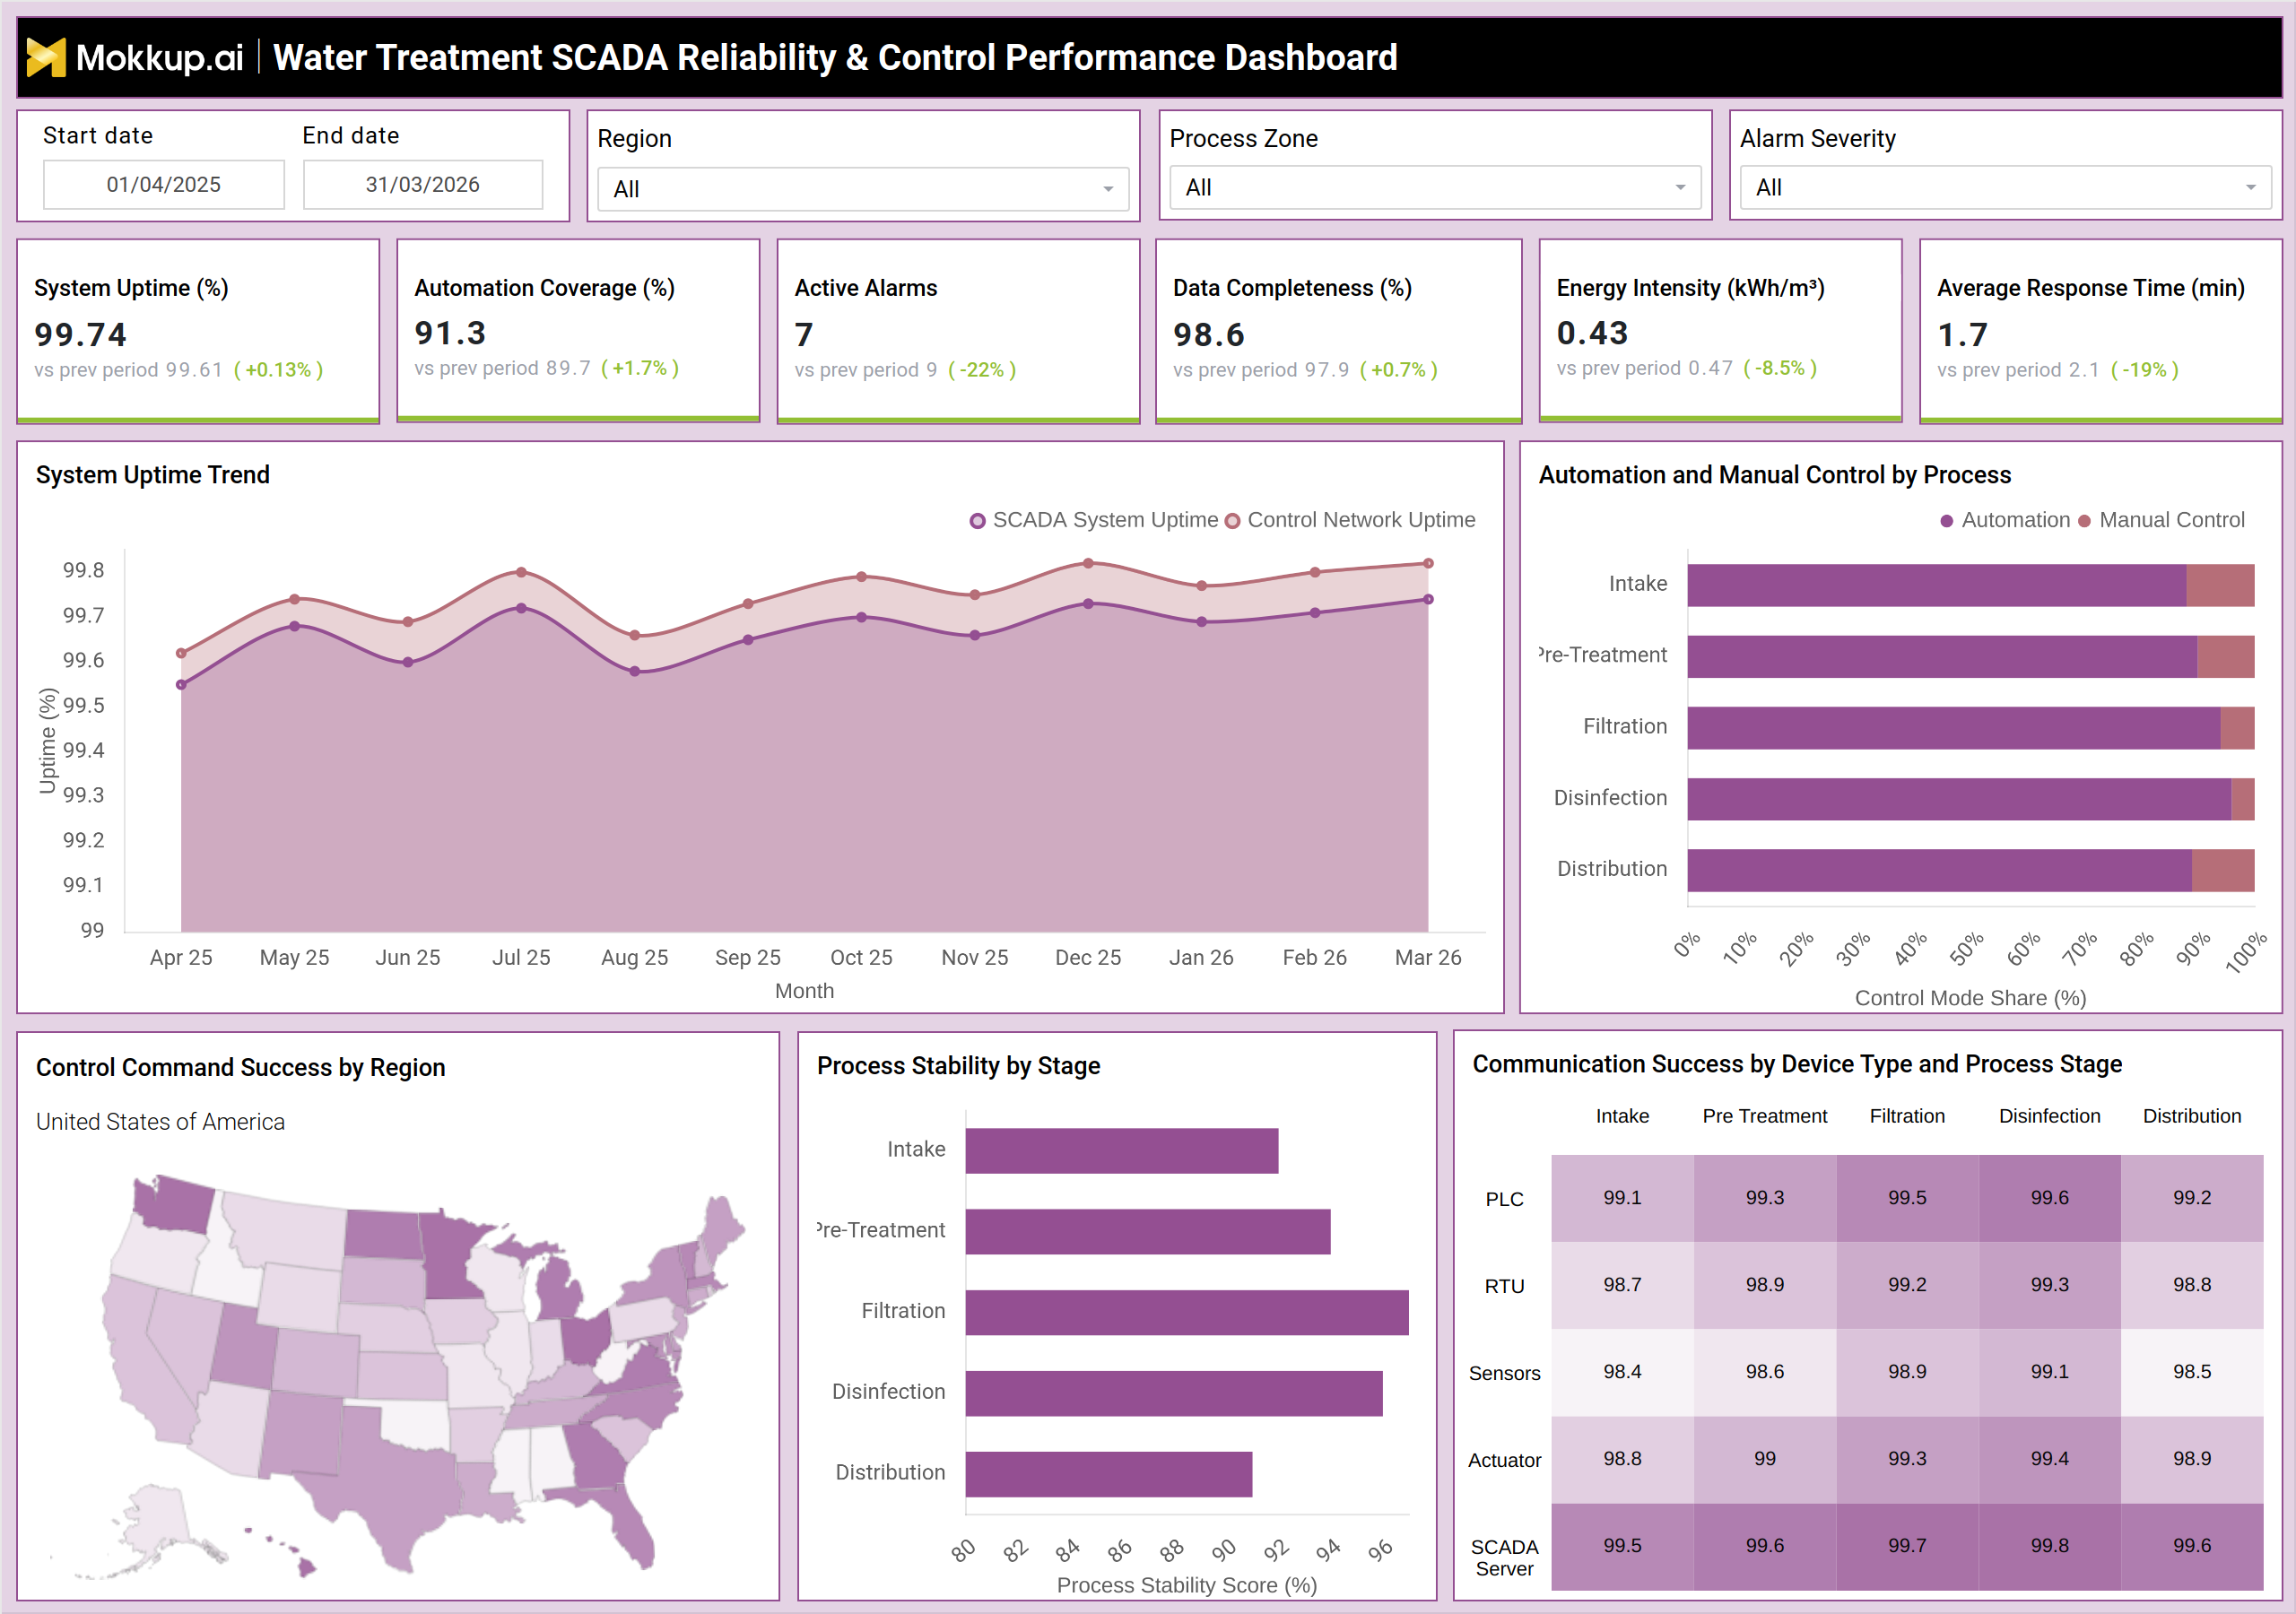
Control engineers and operations managers at water utilities open this dashboard when they need to understand whether their SCADA systems are performing within acceptable reliability thresholds and where manual control is compensating for gaps in automation. The central question they bring is straightforward: are systems running as designed, or is control degrading at any stage of the treatment process? On the main screen, teams can immediately assess how SCADA system uptime and control network uptime have tracked over the past year, identifying any sustained dips or volatility that warrant investigation. The SCADA reliability monitoring view allows teams to compare uptime trends across months, spot periods where the control network diverged from the SCADA system, and prioritize corrective maintenance before those gaps compound.
Teams can also monitor how the active alarm count has shifted compared to the prior period and triage severity levels using the alarm filter. As analysts move deeper into the dashboard, the process stability monitoring section helps them evaluate which treatment stages — whether intake, pre-treatment, filtration, disinfection, or distribution — are operating with the most consistent control outputs. At the same time, the automation and manual control breakdown by process shows where water treatment automation coverage is strong and where manual intervention remains disproportionately high. This guides investment decisions around further automation deployment. The communication success matrix ties everything together by showing which device types, PLCs, RTUs, sensors, actuators, and SCADA servers — maintain the strongest communication reliability at each process stage. When a control performance issue surfaces in a specific zone, teams can cross-reference this matrix to determine whether the issue originates in a device category or a stage-specific network bottleneck. The result is a dashboard that moves operations teams from reactive alarm response to proactive control performance management.
How to Analyze Data in a Water Treatment SCADA Reliability & Control Performance Dashboard
Here is how you can analyze data from this dashboard:
- Filter by Region, Process Zone, and Alarm Severity to scope analysis to a specific operational segment
- Use the System Uptime Trend to compare SCADA system uptime against control network uptime across monthly intervals
- Identify months where uptime divergence occurred and cross-reference with alarm spikes from the same period
- Review the Automation and Manual Control by Process chart to find stages where manual intervention is highest
- Prioritize automation investment in stages where manual control share remains above acceptable thresholds
- Assess Process Stability Score by stage to determine which treatment zones need process optimization
- Use the Communication Success matrix to isolate underperforming device types at specific process stages
- Monitor the Control Command Success by Region map to identify geographic zones with lower command execution rates
- Track Energy Intensity trends to confirm whether automation improvements are translating to efficiency gains
- Use Average Response Time alongside Active Alarms count to evaluate how quickly control interventions are being executed
Benefits of a Water Treatment SCADA Reliability & Control Performance Dashboard
The following are the benefits of using this dashboard:
- Provides a unified view of system uptime, alarm status, and automation performance across the full treatment pipeline
- Enables proactive maintenance by surfacing SCADA reliability trends before failures occur
- Reduces manual control dependency by identifying stages where water treatment automation coverage is below target
- Improves alarm management by tracking active alarm counts and severity trends over time
- Supports data-driven investment decisions around control system upgrades and automation expansion
- Enhances communication reliability and visibility across PLCs, RTUs, sensors, actuators, and SCADA servers
- Helps operations teams achieve consistent process stability scores across all treatment stages
- Speeds up root cause analysis by correlating device-level communication success with stage-level stability data
KPIs to Track in a Water Treatment SCADA Reliability & Control Performance Dashboard
The following key KPIs can be tracked by using this dashboard:
- System Uptime (%): Measures the percentage of time the SCADA system and control network remain operational without unplanned interruptions
- Automation Coverage (%): Tracks the proportion of control operations executed automatically versus manually across process stages — a core measure of water treatment automation coverage
- Active Alarms: Counts the number of currently triggered alarm conditions across all monitored equipment, segmented by severity
- Data Completeness (%): Indicates the percentage of expected sensor and device data that has been successfully recorded within the tracking period
- Energy Intensity (kWh/m3): Measures the energy consumed per cubic meter of water treated, reflecting operational efficiency across the treatment pipeline
- Average Response Time (min): Captures the average time taken to execute or respond to control commands after they are issued
- SCADA System Uptime Trend: Tracks uptime performance over time using SCADA system uptime tracking to reveal sustained reliability patterns or emerging degradation
- Control Network Uptime Trend: Separately measures network-level availability to distinguish infrastructure failures from application-level SCADA issues
- Process Stability Score by Stage: Rates the consistency and reliability of control outputs at each treatment stage — intake, pre-treatment, filtration, disinfection, and distribution
- Automation vs Manual Control Share by Process: Shows the split between automated and manual operations at each stage, supporting decisions on water treatment process stability monitoring
- Control Command Success by Region: Measures the rate at which control commands are successfully executed across geographic zones
- Communication Success by Device Type and Process Stage: Tracks communication reliability for PLCs, RTUs, sensors, actuators, and SCADA servers at each treatment stage
Frequently Asked Questions
1. Who should use the Water Treatment SCADA Reliability & Control Performance Dashboard?
This dashboard is designed for water utility operations managers, control engineers, and SCADA system administrators who need to monitor control system performance across treatment stages. It is also useful for reliability engineers responsible for system uptime, alarm management, and automation program oversight.
2. How does this dashboard differ from a standard operational monitoring tool?
Unlike general monitoring tools, this control performance dashboard water treatment template is purpose-built for SCADA environments. It tracks system-level reliability, device communication success by type and stage, automation versus manual control ratios, and process stability scores — all in a single integrated view that standard monitoring tools do not provide.
3. Can this dashboard help reduce manual control across treatment stages?
Yes. The Automation and Manual Control by Process chart directly shows which stages have high manual intervention, and the Process Stability Score highlights where control consistency is weakest. Together, these views help operations teams identify where automation investment will have the greatest impact.