
What is a Biomass and Bioenergy SCADA System Availability & Digital Monitoring Dashboard?
A Biomass and Bioenergy SCADA System Availability & Digital Monitoring Dashboard is a data-driven analytics platform that tracks the performance, availability, and security of SCADA systems in biomass and bioenergy power plants. It consolidates uptime metrics, failure rates, cybersecurity incidents, and predictive maintenance alerts into a single interface. This dashboard enables plant operators and utility managers to monitor system health, detect anomalies, and prevent unplanned outages by analyzing SCADA availability trends, mean time to repair (MTTR), and alert severity levels. By integrating SCADA data analytics for bioenergy power generation, utilities can improve operational efficiency, reduce maintenance costs, and ensure compliance with industry regulations. The dashboard also helps identify cybersecurity threats and optimize system performance by providing actionable insights into SCADA uptime, failure patterns, and predictive maintenance needs.
How to Create a Biomass and Bioenergy SCADA System Availability & Digital Monitoring Dashboard
You don’t need to build your report from scratch, just start with a ready-to-use dashboard template from Mokkup. Add in your data and export it however you like. Here’s how to do it:
1. Create or Log in to Your Mokkup Account
Start by signing up on Mokkup.ai using your email. If you already have an account, just log in, and you’ll be good to go.
2. Choose and Customize Your Dashboard Template
Find the Biomass and Bioenergy SCADA System Availability & Digital Monitoring Dashboard template in the Templates section. Use the drag-and-drop editor to adjust KPIs, edit filters, or add elements based on your data.
3. Export to Your BI Tool
Once your dashboard wireframe is ready, use the BI Tool Export feature to send it directly to Power BI or Tableau for further analysis and enhancements. You can also download the dashboard as a PDF, PNG, or JPEG, embed it on a platform, or invite your team to collaborate.
Note: This is a Pro template. You’ll need a Pro subscription on Mokkup to use and customize this dashboard wireframe. Upgrade anytime to unlock full access.
Biomass and Bioenergy SCADA System Availability & Digital Monitoring Dashboard Example
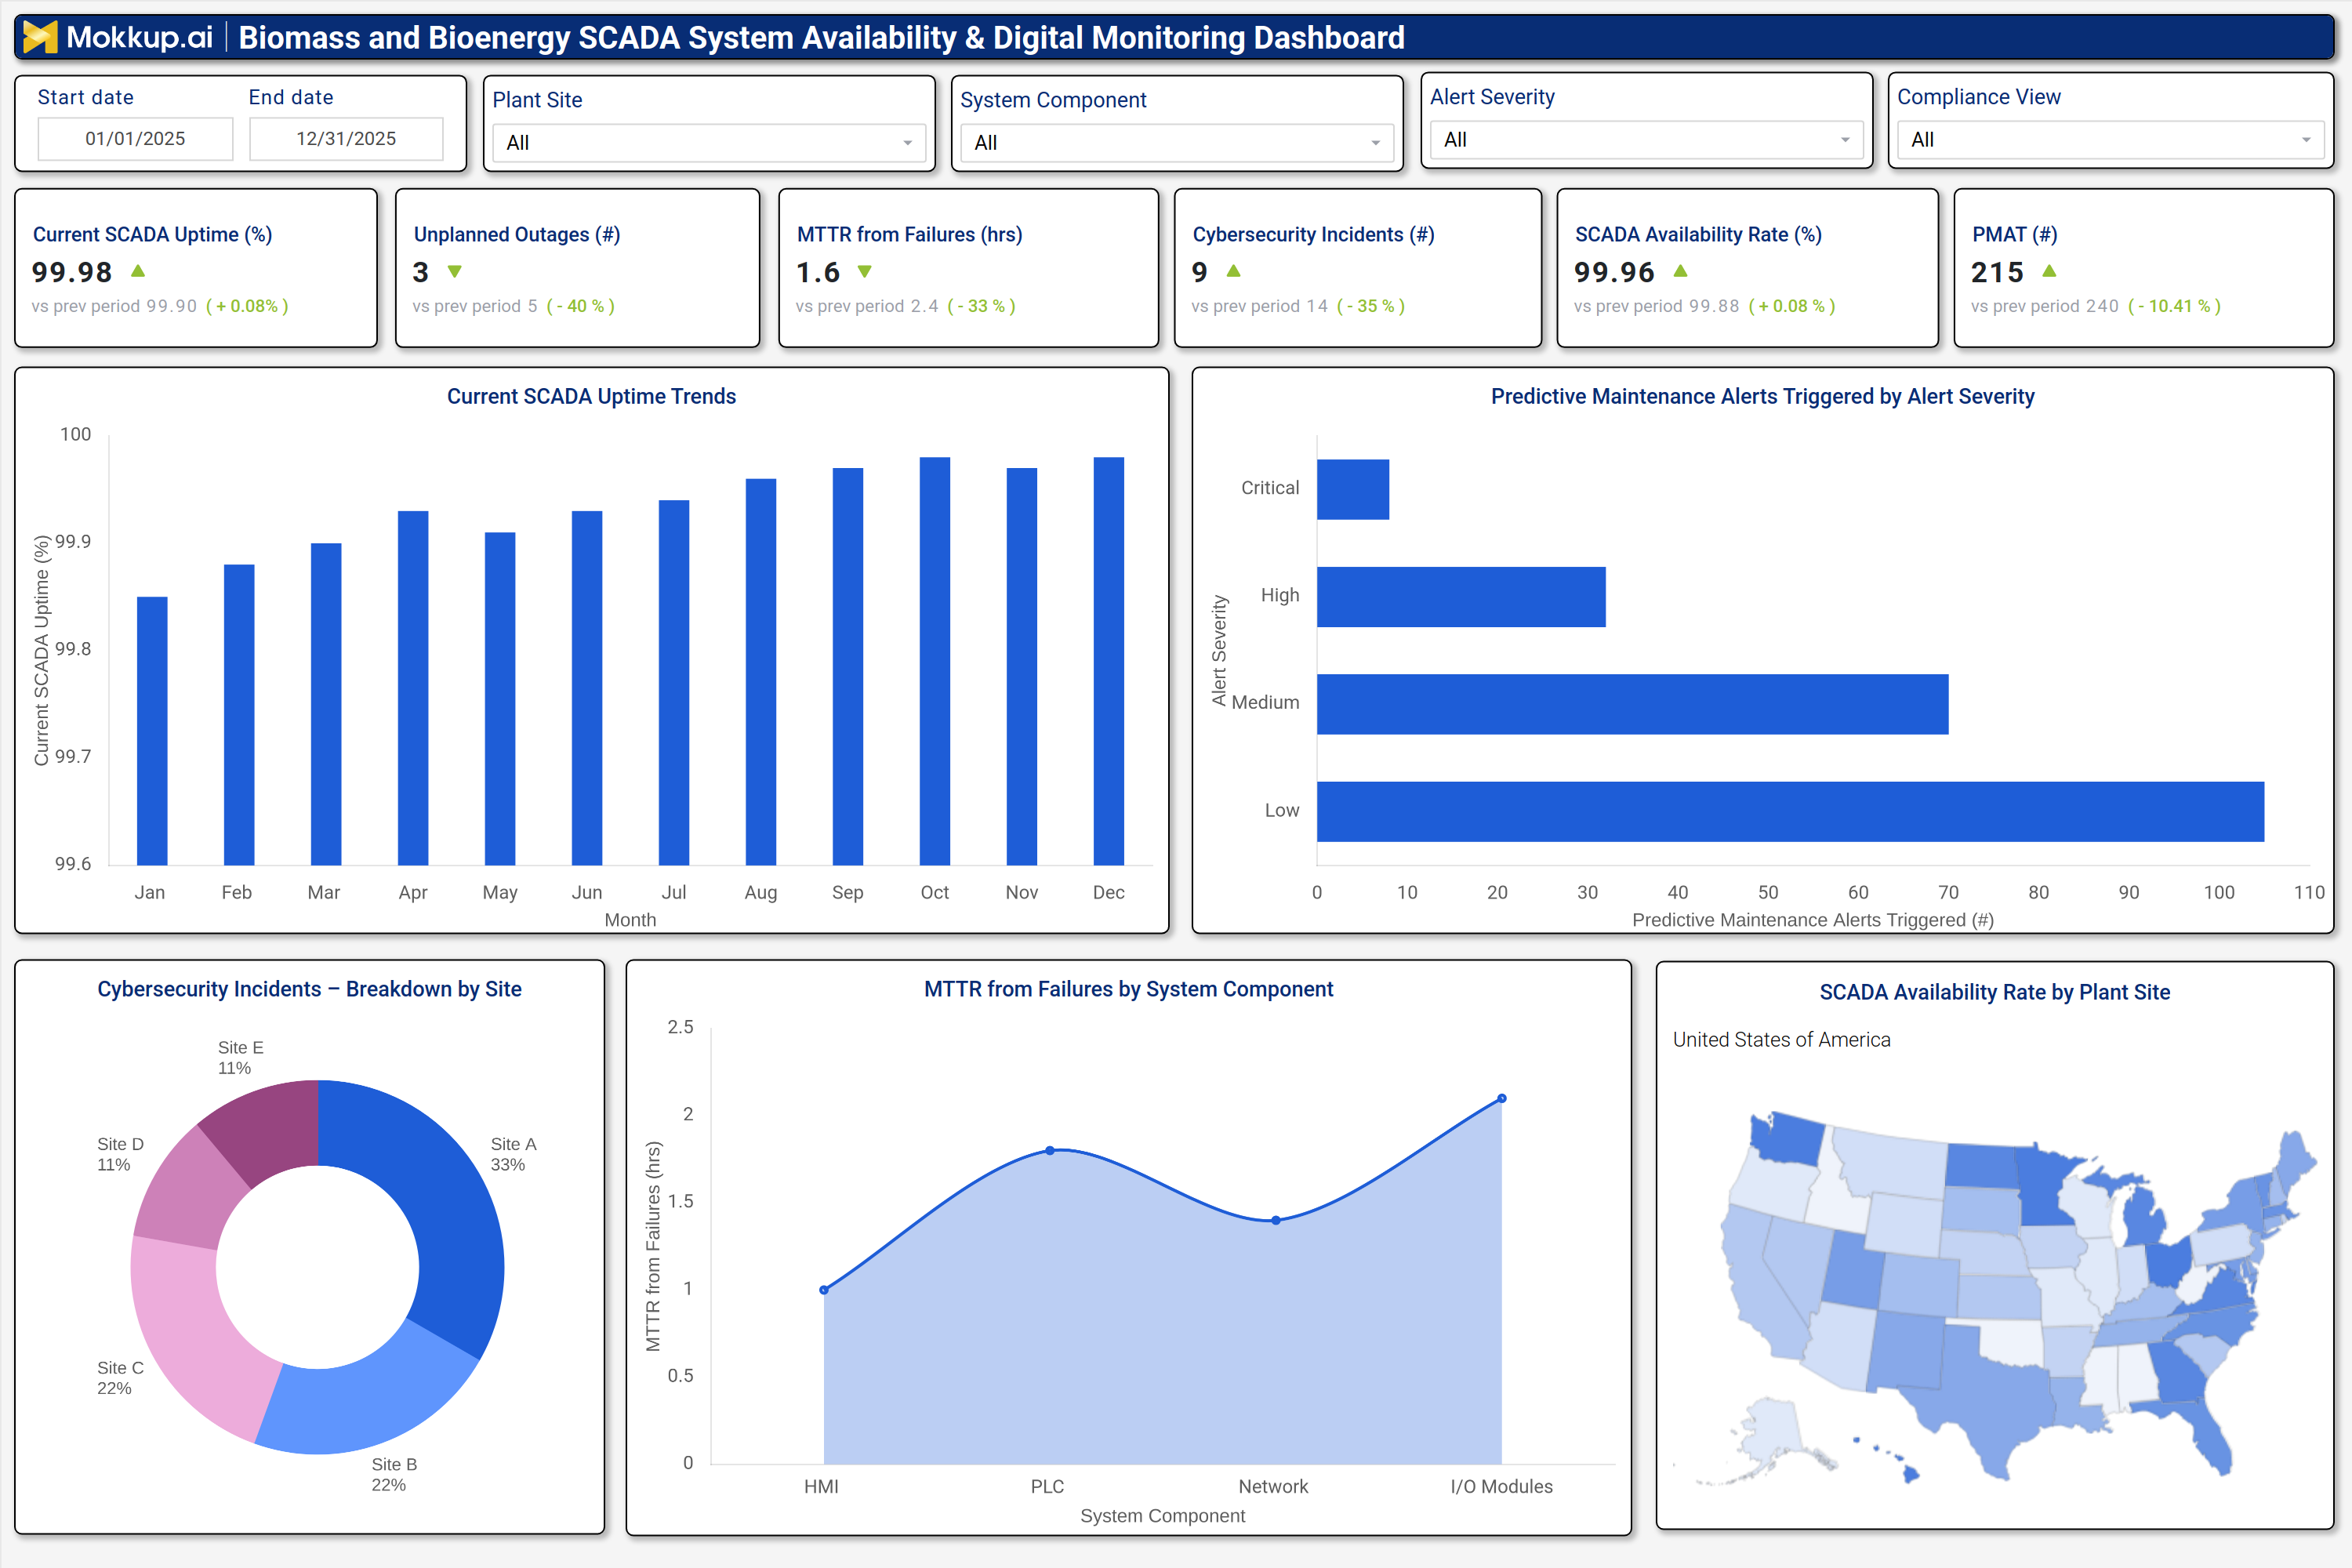
A typical digital dashboard for bioenergy plant availability tracking includes interactive filters for date ranges, plant sites, system components, and alert severity levels. Key performance tiles display current SCADA uptime percentage, unplanned outages, mean time to repair (MTTR), cybersecurity incidents, and SCADA availability rates. Trend charts compare current SCADA uptime trends against historical data, while a predictive maintenance alerts breakdown categorizes issues by severity (critical, high, medium, low). A breakdown of cybersecurity incidents by site highlights vulnerabilities across plant locations. At the same time, an MTTR analysis by system component (HMI, PLC, Network, I/O Modules) identifies which parts of the SCADA system require the most maintenance. A geographic heatmap shows SCADA availability rates by plant site, helping utilities prioritize maintenance efforts in underperforming locations. Together, these components form a comprehensive SCADA monitoring dashboard for biomass power plants, enabling data-driven decision-making for plant operators and utility managers.
How to Analyze Data in a Biomass and Bioenergy SCADA System Availability & Digital Monitoring Dashboard
Here is how you can analyze data from this dashboard:
- Monitor SCADA Uptime Trends: Track system uptime patterns to assess overall reliability and identify early signs of potential failures.
- Track Unplanned Outages: Measures unexpected downtime to understand its impact on plant operations and revenue performance.
- Analyze MTTR (Mean Time to Repair): Evaluates how quickly maintenance teams resolve issues, helping reduce system recovery time.
- Review Cybersecurity Incidents: Monitors security events to identify vulnerabilities and strengthen protection against potential breaches.
- Assess Predictive Maintenance Alerts: Analyze maintenance alerts by severity to prioritize urgent repairs and prevent critical equipment failures.
- Compare SCADA Availability by Plant Site: Examines system availability across different locations to identify underperforming plants and improve resource planning.
- Evaluate System Component Performance: Reviews the performance of components such as HMI, PLC, network systems, and I/O modules to detect recurring issues and enhance reliability.
Benefits of a Biomass and Bioenergy SCADA System Availability & Digital Monitoring Dashboard
The following are the benefits of using this biomass power plant cybersecurity dashboard:
- Improves SCADA System Uptime: Identifies potential system issues early, enabling teams to resolve them before they cause outages.
- Reduces Unplanned Downtime: Uses predictive maintenance and early fault detection to prevent unexpected system failures.
- Enhances Cybersecurity: Continuously monitors system activity to detect and mitigate potential cyber threats.
- Optimizes Maintenance Schedules: Tracks MTTR and failure patterns to help teams plan maintenance activities more effectively.
- Supports Regulatory Compliance: Provides audit-ready performance data to meet industry standards and regulatory requirements.
- Lowers Operational Costs: Reduces emergency repairs and extends equipment lifespan through proactive maintenance.
- Enables Data-Driven Decision-Making: Provides actionable insights that help plant operators and utility managers make informed operational decisions.
KPIs to Track in a Biomass and Bioenergy SCADA System Availability & Digital Monitoring Dashboard
The following key KPIs can be tracked by using this MTTR and outage tracking dashboard:
- Current SCADA Uptime (%) – Measures the percentage of time the SCADA system is operational.
- Unplanned Outages (count) – Tracks the number of unexpected system failures.
- MTTR from Failures (hrs) – Calculates the average time taken to repair SCADA system failures.
- Cybersecurity Incidents (count) – Monitors the number of security breaches or threats detected.
- SCADA Availability Rate (%) – Assesses the overall reliability of the SCADA system.
- Predictive Maintenance Alerts Triggered (count) – Counts the number of maintenance alerts generated by the system.
Frequently Asked Questions
1. What is a biomass SCADA system availability dashboard?
A biomass SCADA system availability dashboard for biomass power plants monitors and controls equipment to ensure efficient operation, safety, and compliance. It collects data from sensors, PLCs, and HMIs to provide visibility into plant performance.
2. How does a SCADA predictive maintenance alerts dashboard work?
A SCADA monitoring dashboard provides actionable insights into system uptime, failures, and cybersecurity risks, helping utilities reduce downtime, optimize maintenance, and improve reliability.
3. Who should use a digital monitoring dashboard for a bioenergy plant?
Plant operators, maintenance teams, cybersecurity analysts, and utility managers benefit from SCADA data analytics for bioenergy power generation.