What is a Water Treatment & Purification Risk Monitoring Dashboard?
A Water Treatment & Purification Risk Monitoring Dashboard is a centralized analytics solution used to monitor operational risks, contamination incidents, water quality compliance, and treatment plant performance across water utility operations. This dashboard helps utilities identify high-risk plants, monitor contamination alerts, track operational incidents, and improve response time to water quality issues. The dashboard combines operational, compliance, and safety metrics into one view to support faster decision-making. A modern water treatment and purification risk monitoring dashboard helps water utilities reduce regulatory violations, improve customer safety, and maintain stable purification operations. It also supports proactive monitoring through trend analysis, regional risk tracking, and incident resolution analytics. Utilities use this dashboard to analyze contamination types, identify recurring operational failures, monitor compliance percentages, and assess risk exposure across treatment plants and supply zones. A water treatment plant risk management analytics dashboard also improves coordination between compliance, operations, and maintenance teams.
How to Create a Water Treatment & Purification Risk Monitoring Dashboard?
You don’t need to build your report from scratch, just start with a ready-to-use dashboard template from Mokkup. Add in your data and export it however you like. Here’s how to do it:
1. Create or Log in to Your Mokkup Account
Start by signing up on Mokkup.ai using your email. If you already have an account, just log in, and you’ll be good to go.
2. Choose and Customize Your Dashboard Template
Find the Water Treatment & Purification Risk Monitoring Dashboard template in the Templates section. Use the drag-and-drop editor to adjust KPIs, edit filters, or add elements based on your data.
3. Export to Your BI Tool
Once your dashboard wireframe is ready, use the BI Tool Export feature to send it directly to Power BI or Tableau for further analysis and enhancements. You can also download the dashboard as a PDF, PNG, or JPEG, embed it on a platform, or invite your team to collaborate.
Note: This is a Pro template. You’ll need a Pro subscription on Mokkup to use and customize this dashboard wireframe. Upgrade anytime to unlock full access.
Water Treatment & Purification Risk Monitoring Dashboard Example
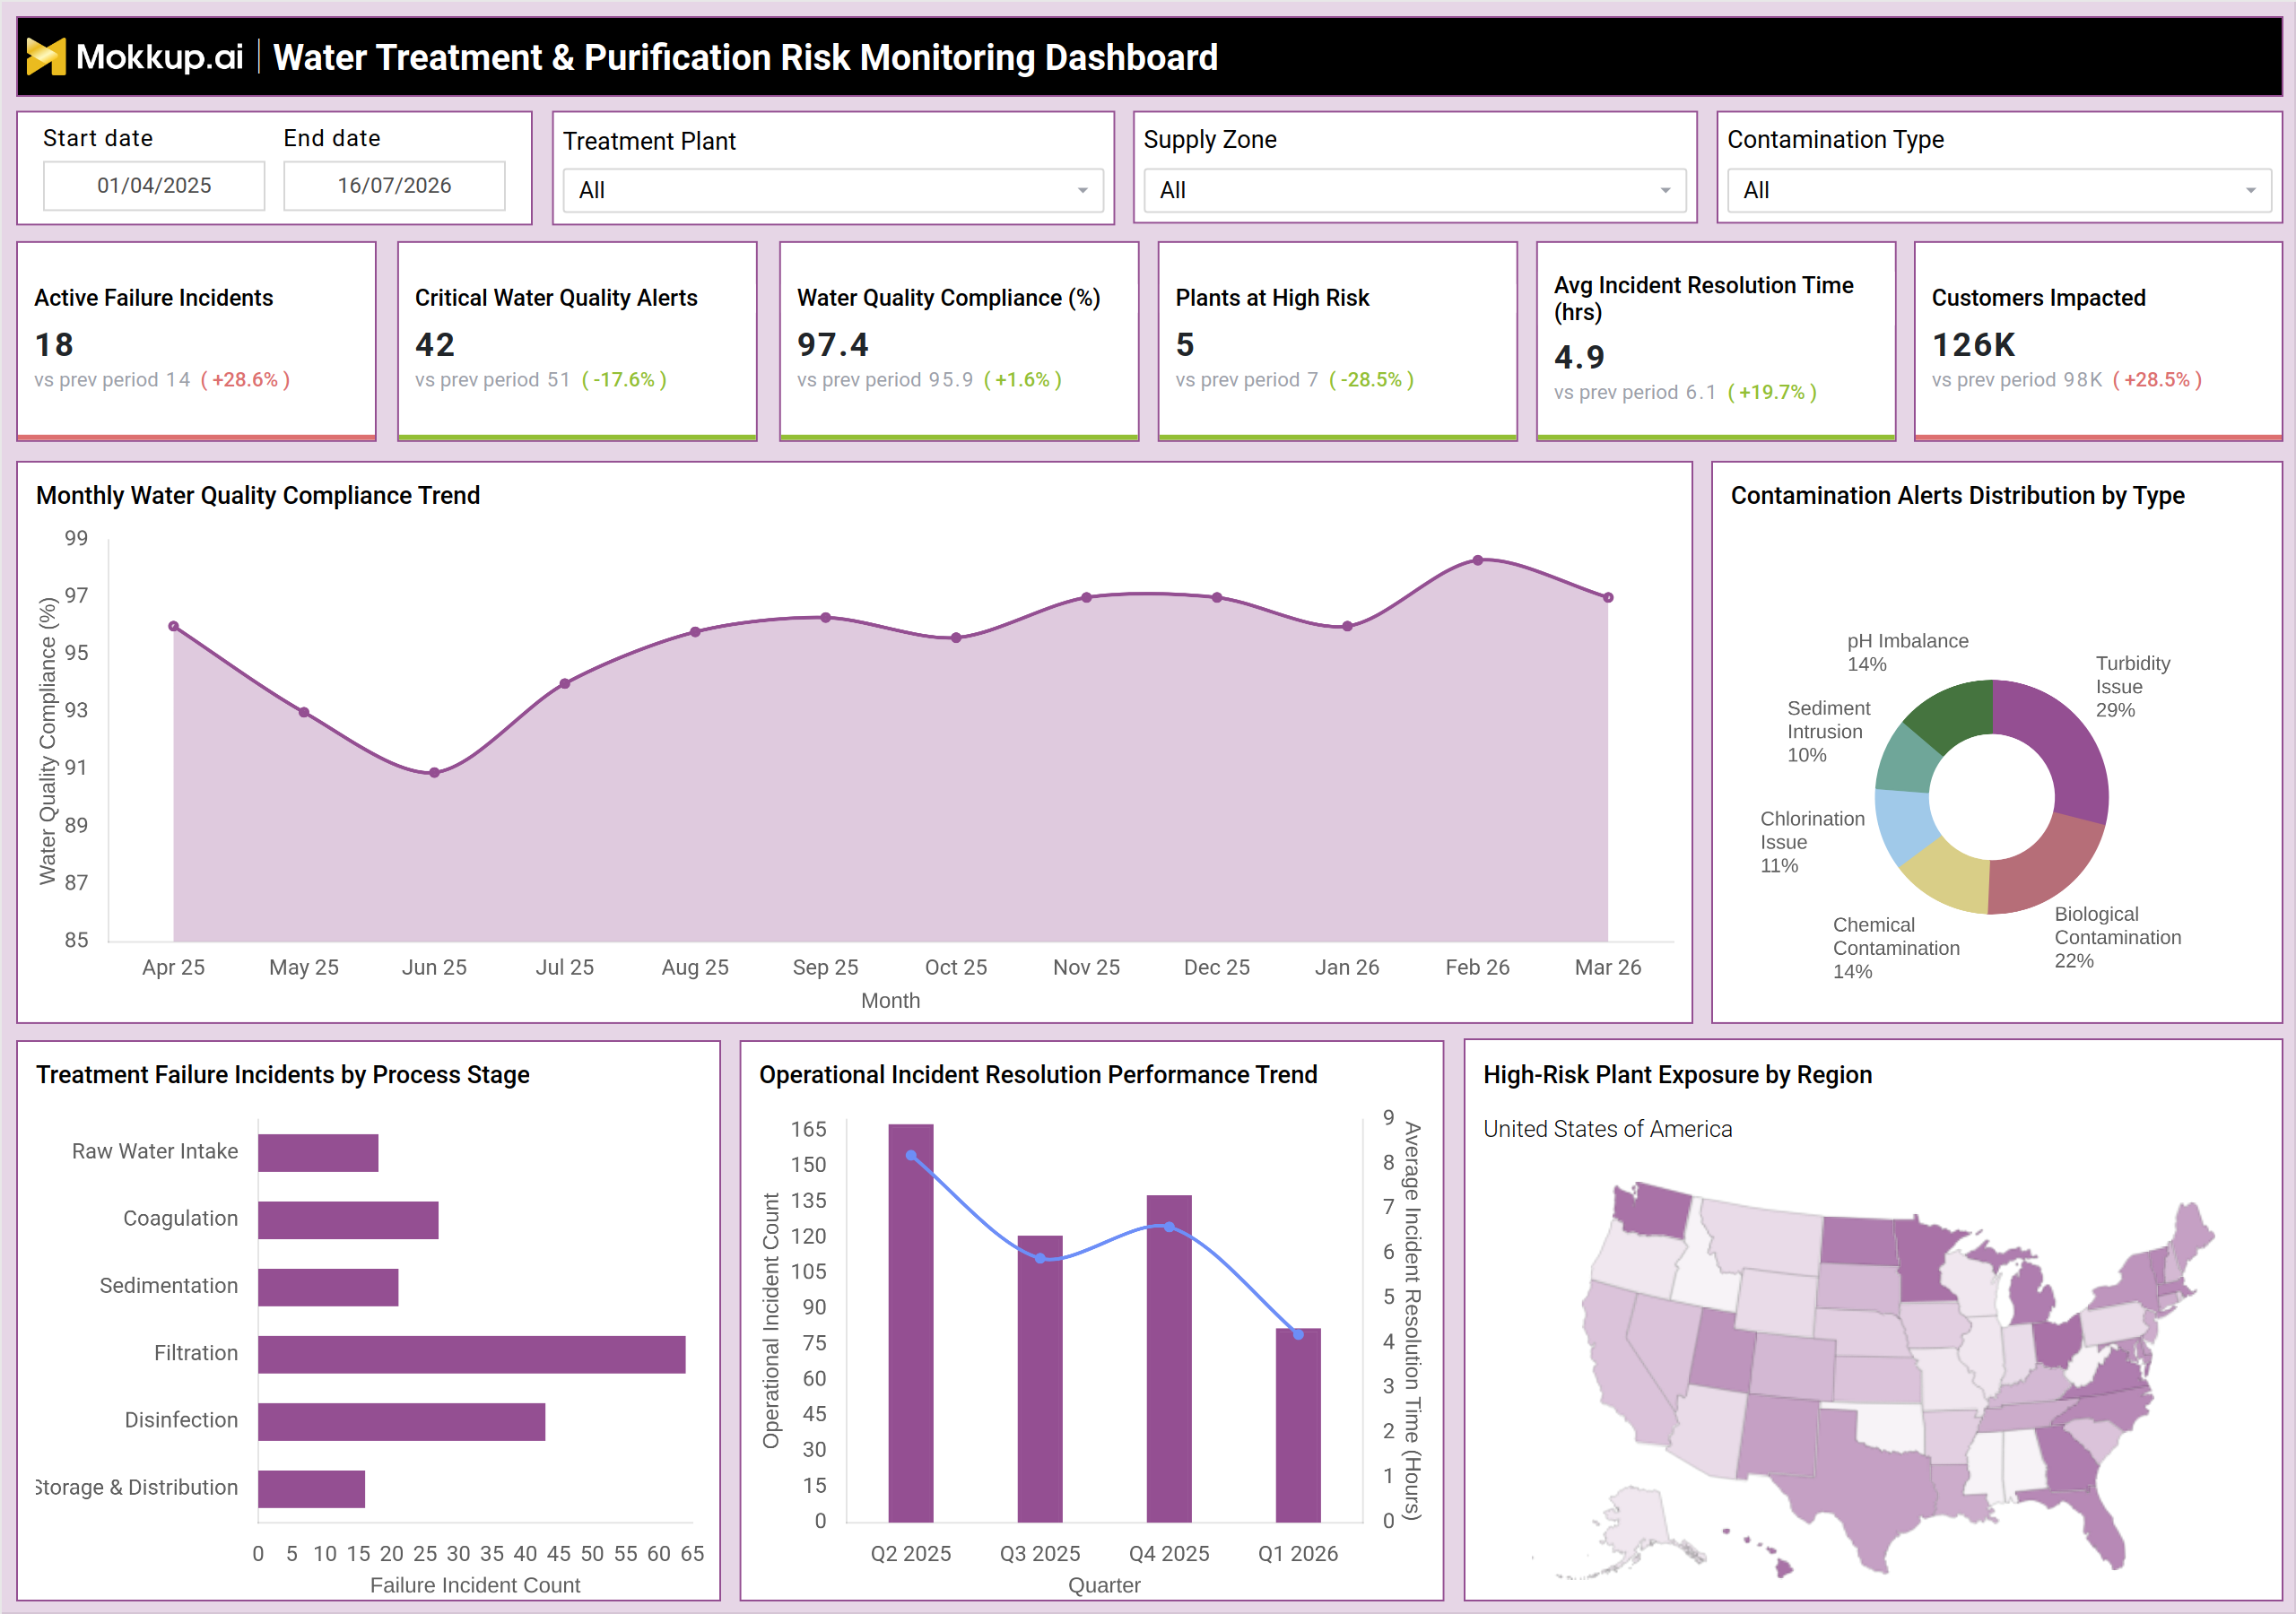
This dashboard example provides a complete operational risk monitoring view for water treatment and purification facilities. The top KPI cards display key metrics such as Active Failure Incidents, Critical Water Quality Alerts, Water Quality Compliance (%), Plants at High Risk, Average Incident Resolution Time, and Customers Impacted. These KPIs help operators quickly understand the current risk environment across treatment plants. The dashboard also includes trend and distribution visuals for deeper analysis.
The Monthly Water Quality Compliance Trend helps monitor compliance consistency over time, while the Contamination Alerts Distribution chart identifies the most common contamination categories, such as turbidity issues, biological contamination, and chlorination failures. Additional visuals analyze Treatment Failure Incidents by Process Stage, operational incident resolution performance trends, and regional high-risk plant exposure. This type of water purification operational risk monitoring dashboard enables utilities to prioritize high-risk areas, reduce operational disruptions, and improve regulatory compliance performance. The dashboard also acts as a water treatment compliance and risk tracking dashboard by combining operational and quality monitoring into one platform.
How to Analyze Data in Water Treatment & Purification Risk Monitoring Dashboard
Here is how you can analyze data from this Water treatment process risk assessment dashboard:
- Monitor Water Quality Compliance trends to identify declining treatment performance
- Compare Active Failure Incidents across treatment plants and supply zones
- Track contamination alert distribution to identify major water quality risks
- Analyze high-risk plants by region to prioritize corrective actions
- Review incident resolution time trends to measure operational response efficiency
- Identify process stages with the highest treatment failure incidents
- Monitor customer impact metrics during contamination or operational disruptions
- Compare quarterly incident trends to evaluate risk reduction strategies
- Analyze contamination categories such as biological, chemical, and turbidity risks
- Use operational incident trends to improve preventive maintenance planning
- Evaluate compliance improvement after corrective operational actions
- Track recurring incidents to identify long-term operational weaknesses
- Assess treatment plant exposure using regional risk concentration analysis
- Monitor incident escalation patterns to reduce service interruptions
Benefits of Water Treatment & Purification Risk Monitoring Dashboard
The following are the benefits of using such a Water purification plant incident risk analytics dashboard:
- Improves visibility into operational and compliance risks
- Helps reduce contamination incidents through proactive monitoring
- Supports faster response to operational failures and water quality alerts
- Enhances regulatory compliance tracking and reporting
- Reduces customer impact during treatment disruptions
- Identifies high-risk treatment plants requiring immediate attention
- Improves operational reliability across purification stages
- Enables data-driven maintenance and risk mitigation planning
- Helps utilities monitor incident resolution efficiency
- Reduces operational downtime through early risk identification
- Supports centralized monitoring across multiple plants and supply zones
- Improves safety and environmental risk management
- Enhances water treatment process accountability
- Strengthens operational decision-making using analytics
KPIs to Track in Water Treatment & Purification Risk Monitoring Dashboard
The following key KPIs can be tracked by using this dashboard:
- Active Failure Incidents: Measures the number of operational failures across treatment plants
- Critical Water Quality Alerts: Tracks critical contamination and compliance alerts requiring immediate attention
- Water Quality Compliance (%): Measures compliance performance against regulatory standards
- Plants at High Risk: Identifies treatment plants with elevated operational or contamination risks
- Avg Incident Resolution Time (hrs): Tracks average time required to resolve operational incidents
- Customers Impacted: Measures the number of customers affected by treatment or supply disruptions
Frequently Asked Questions
1. Why is a water treatment risk monitoring dashboard important?
A water treatment compliance and risk tracking dashboard helps utilities identify operational risks early, reduce contamination exposure, maintain compliance, and improve response efficiency.
2. What risks can this dashboard monitor?
The dashboard monitors contamination alerts, operational failures, compliance issues, treatment disruptions, plant exposure risks, and customer impact metrics.
3. How does this dashboard improve compliance management?
It tracks water quality compliance trends, contamination events, and operational incidents in helping utilities respond faster and maintain regulatory standards.