What Is a Water Quality Incidents & Public Health Dashboard
A water quality incidents and public health dashboard is a data-driven tool designed to monitor, analyze, and respond to water contamination events that impact public health. This dashboard consolidates data from water utility systems, environmental agencies, and public health reports to provide a unified view of water safety risks. It tracks key metrics such as contamination incidents, boil water advisories, public complaints, emergency responses, and EPA compliance violations. By visualizing trends in water quality violations, health risk scores, and geographic hotspots, this dashboard helps utilities, government agencies, and public health officials detect patterns, prioritize responses, and implement preventive measures. It serves as an early warning system for waterborne disease outbreaks, infrastructure failures, and regulatory noncompliance, ensuring timely interventions to protect communities.
How to Create a Water Quality Incidents & Public Health Dashboard
You don't need to build your report from scratch, just start with a ready-to-use dashboard template from Mokkup. Add in your data and export it however you like. Here's how to do it:
1. Create or Log in to Your Mokkup Account
Start by signing up on Mokkup.ai using your email. If you already have an account, just log in, and you'll be good to go.
2. Choose and Customize Your Dashboard Template
Find the Water Quality Incidents & Public Health Dashboard template in the Templates section. Use the drag-and-drop editor to adjust KPIs, edit filters, or add elements based on your data.
3. Export to Your BI Tool
Once your dashboard wireframe is ready, use the BI Tool Export feature to send it directly to Power BI or Tableau for further analysis and enhancements. You can also download the dashboard as a PDF, PNG, or JPEG, embed it on a platform, or invite your team to collaborate.
Note: This is a Pro template. You'll need a Pro subscription on Mokkup to use and customize this dashboard wireframe. Upgrade anytime to unlock full access.
Water Quality Incidents & Public Health Dashboard Example
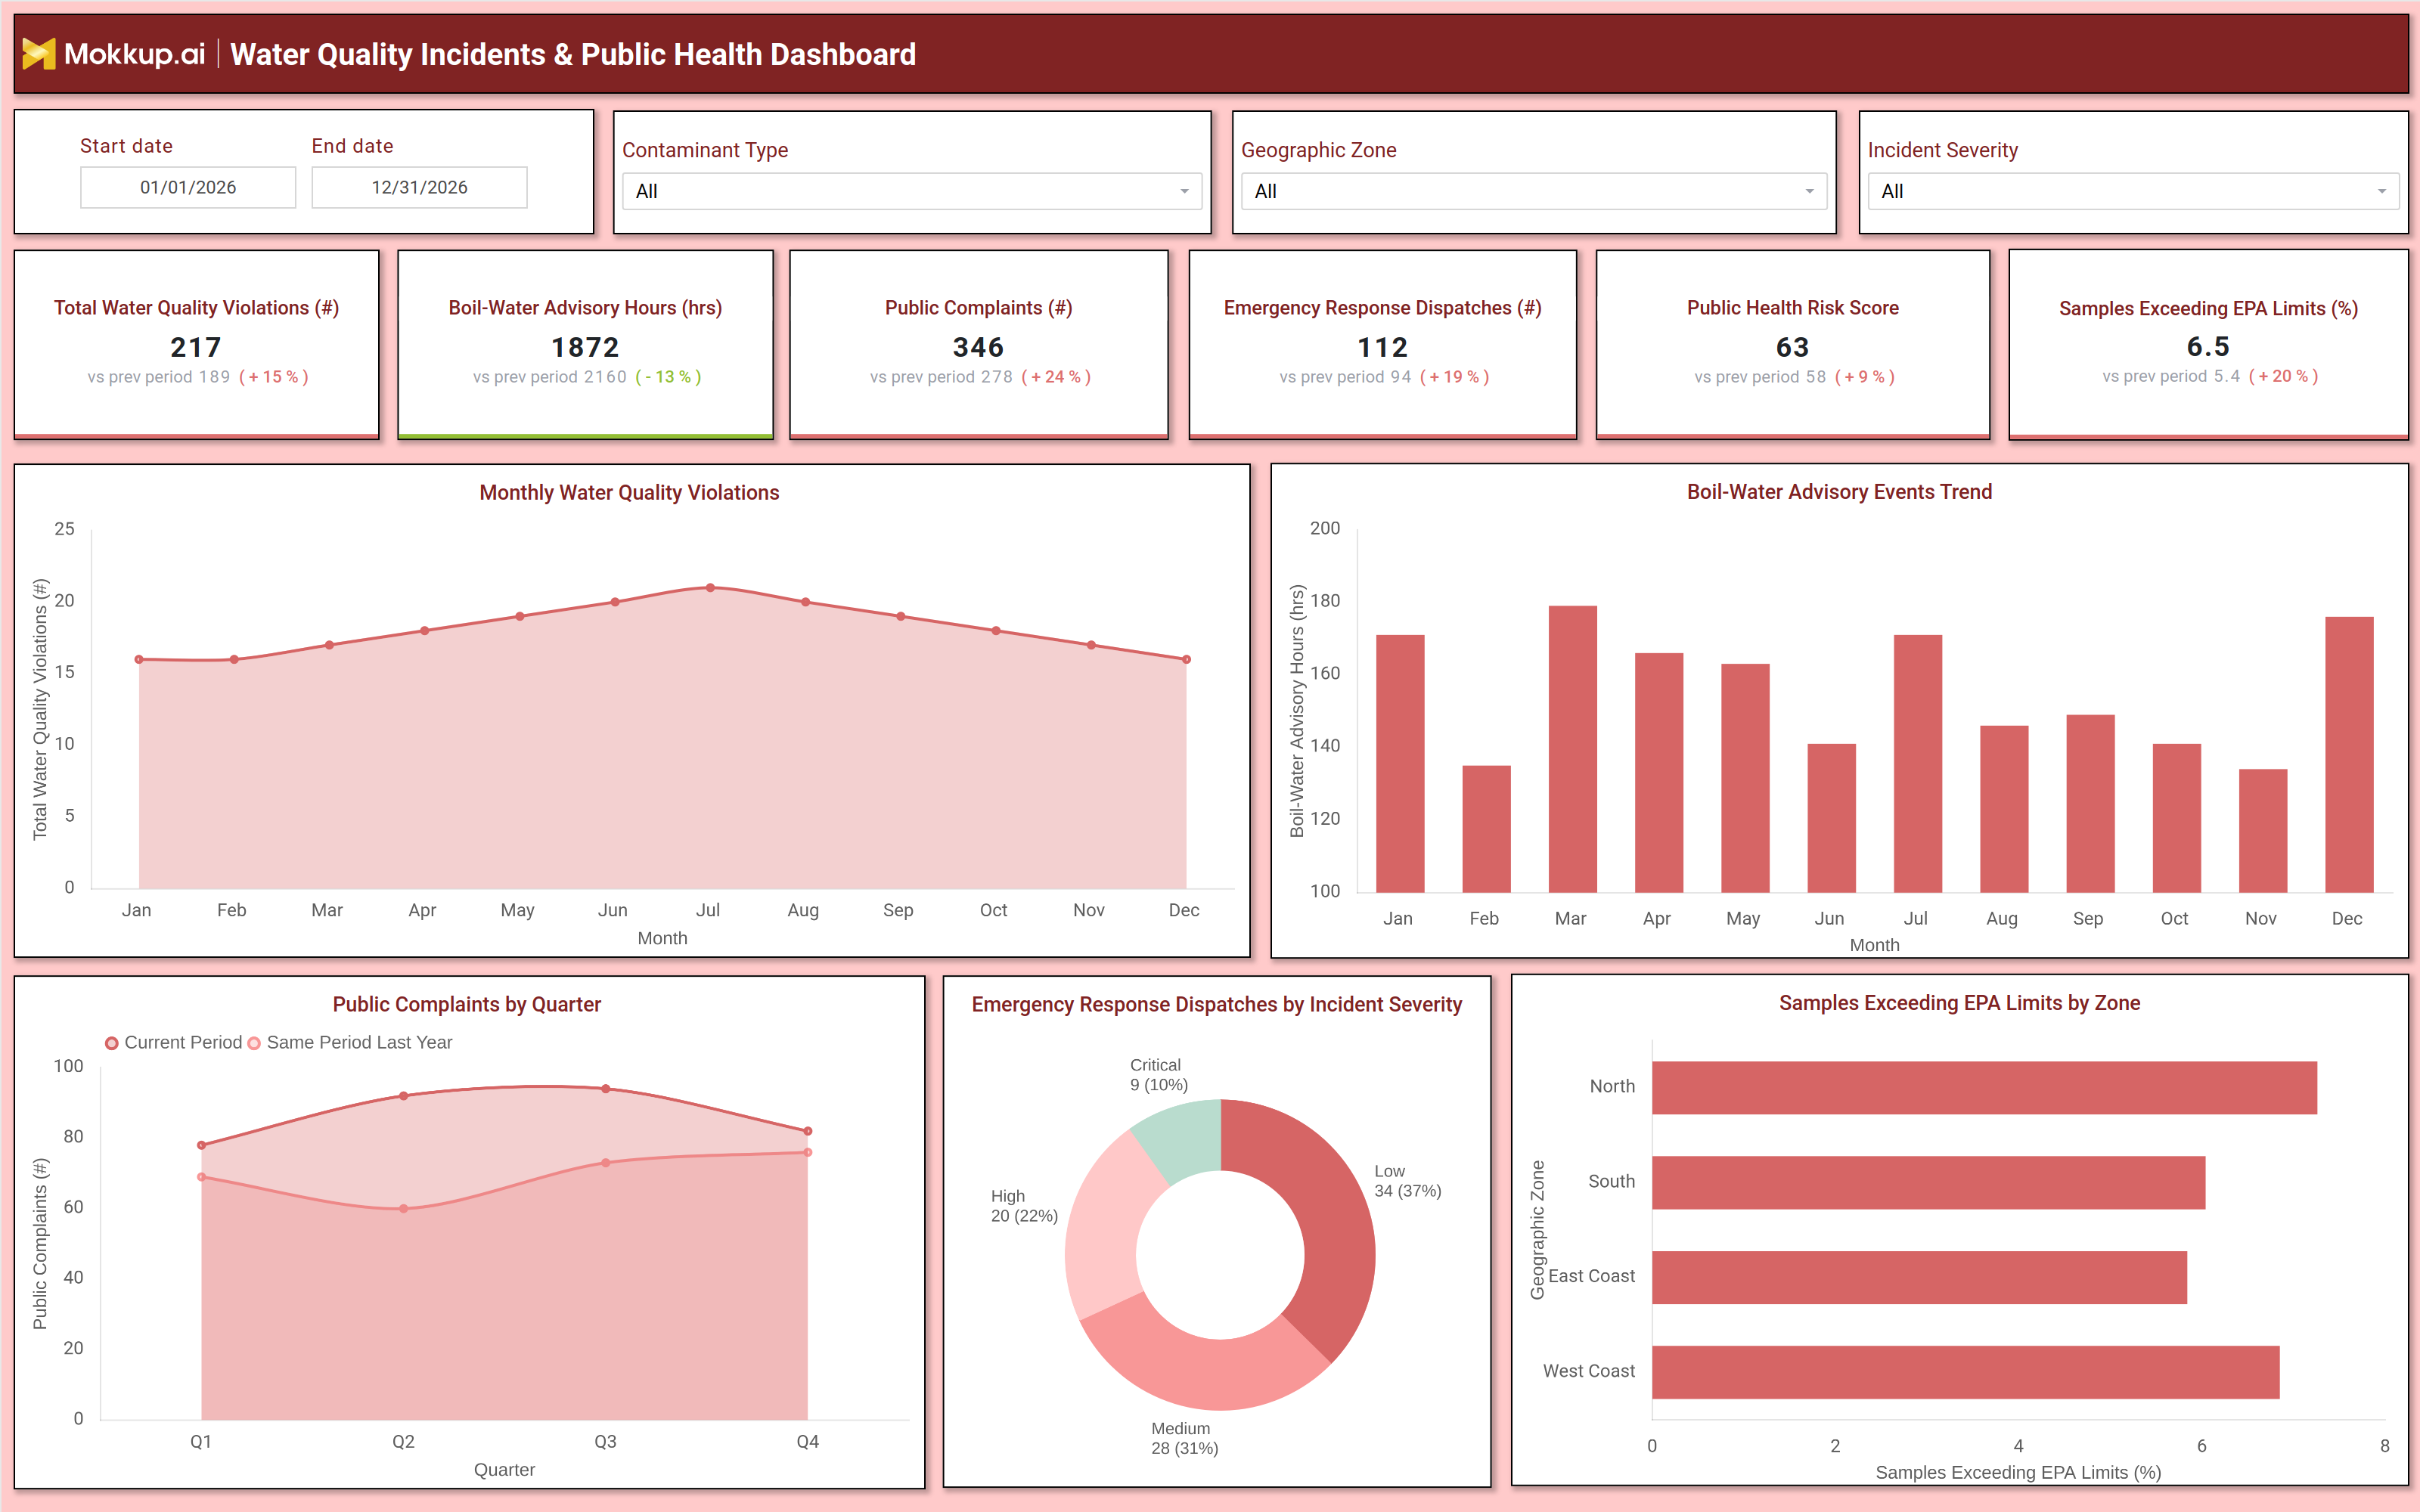
A well-structured water quality incidents and public health dashboard includes interactive filters for date ranges, contaminant types, geographic zones, and incident severity. Key performance indicators (KPIs) displayed in summary tiles include total water quality violations, boil water advisory hours, public complaints, emergency response dispatches, public health risk scores, and the percentage of samples exceeding EPA limits. Trend charts compare monthly water quality violations and boil water advisory events against previous periods, helping identify seasonal or recurring issues. A quarterly breakdown of public complaints highlights spikes in concerns, while a severity-based pie chart categorizes emergency responses into low, medium, high, and critical incidents. A geographic heatmap shows zones with the highest percentage of samples exceeding EPA limits, enabling targeted inspections and corrective actions. This water safety compliance dashboard provides utilities and health agencies with a clear, actionable view of water safety risks, enabling data-driven decision-making for incident response, infrastructure upgrades, and public communication.
How to Analyze Data in a Water Quality Incidents & Public Health Dashboard
Here is how you can analyze data from this public health monitoring dashboard:
- Total Water Quality Violations: Track the number of violations over time to identify contamination trends and assess compliance with safety standards.
- Boil Water Advisory Hours: Monitor how often and how long advisories are issued to understand the impact on public health and service reliability.
- Public Complaints (Quarterly): Review complaint trends each quarter to detect rising concerns and prioritize investigation efforts.
- Emergency Response Dispatches by Severity: Analyze incidents based on severity levels to allocate resources more effectively during critical situations.
- Public Health Risk Scores: Measure the overall risk posed by water quality issues to better understand their impact on community safety.
- Samples Exceeding EPA Limits by Zone: Compare zones where water samples exceed EPA limits to identify high-risk areas needing immediate action.
- Year-over-Year Performance Trends: Evaluate changes in key metrics annually to determine whether water safety is improving or declining.
- Geographic Contamination Hotspots: Use location-based insights to identify problem areas and guide targeted interventions.
Benefits of a Water Quality Incidents & Public Health Dashboard
The following are the benefits of using this emergency response dispatch dashboard:
- Enhanced Public Health Protection: Enable faster detection and response to water contamination, reducing risks to communities.
- Improved Regulatory Compliance: Track violations against standards set by EPA and ensure timely corrective actions.
- Reduced Emergency Response Time: Respond more quickly to waterborne disease outbreaks and infrastructure failures.
- Data-Driven Decision-Making: Use insights to guide utility operations, policy updates, and resource allocation effectively.
- Increased Transparency: Provide clear and accessible water safety data to stakeholders and the public.
- Optimized Emergency Preparedness: Leverage trend analysis and risk forecasting to stay prepared for potential crises.
- Stronger Public Trust: Build confidence by demonstrating proactive and consistent water quality management.
KPIs to Track in a Water Quality Incidents & Public Health Dashboard
The following key KPIs can be tracked by using this EPA violation monitoring dashboard:
- Total Water Quality Violations (#): Measures the number of detected water safety breaches.
- Boil Water Advisory Hours (hrs): Tracks the duration of public health warnings due to contamination.
- Public Complaints (#): Counts reported concerns from consumers about water quality.
- Emergency Response Dispatches (#): Monitors the frequency of urgent interventions.
- Public Health Risk Score: Quantifies the overall threat level to community health.
- Samples Exceeding EPA Limits (%): Indicates the percentage of tests failing regulatory standards.
Frequently Asked Questions
1. What is an EPA violation monitoring dashboard used for?
It helps utilities and health agencies monitor contamination events, track public health risks, and ensure compliance with safety regulations.
2. Who should use a water quality and public health dashboard?
Water utility managers, environmental agencies, public health officials, and government regulators.
3. What data sources feed into this water safety compliance dashboard?
Water quality testing labs, utility incident reports, public health databases, and EPA compliance records.