
What is a Natural Gas Distribution Regulatory Compliance & Tariff Performance Dashboard?
A natural gas regulatory compliance dashboard is a business intelligence tool used to monitor compliance with regulatory standards and evaluate tariff performance across gas distribution utilities. It consolidates key compliance metrics such as tariff filing accuracy, reporting adherence, inspection scores, and penalty exposure into a single view. This dashboard for monitoring gas distribution tariffs enables utilities to track regulatory obligations, ensure timely reporting, and analyze tariff effectiveness. By integrating compliance systems, audit data, and operational inputs, the dashboard gives insight into performance gaps and risks. A compliance monitoring dashboard for gas utilities helps organizations reduce regulatory penalties, improve transparency, and maintain consistent compliance across regions and processes.
How to Create a Natural Gas Distribution Regulatory Compliance & Tariff Performance Dashboard
You don’t need to build your report from scratch, just start with a ready-to-use dashboard template from Mokkup. Add in your data and export it however you like. Here’s how to do it:
1. Create or Log in to Your Mokkup Account
Start by signing up on Mokkup.ai using your email. If you already have an account, just log in, and you’ll be good to go.
2. Choose and Customize Your Dashboard Template
Find the Natural Gas Distribution Regulatory Compliance & Tariff Performance Dashboard template in the Templates section. Use the drag-and-drop editor to adjust KPIs, edit filters, or add elements based on your data.
3. Export to Your BI Tool
Once your dashboard wireframe is ready, use the BI Tool Export feature to send it directly to Power BI or Tableau for further analysis and enhancements. You can also download the dashboard as a PDF, PNG, or JPEG, embed it on a platform, or invite your team to collaborate.
Note: This is a Pro template. You’ll need a Pro subscription on Mokkup to use and customize this dashboard wireframe. Upgrade anytime to unlock full access.
Natural Gas Distribution Regulatory Compliance & Tariff Performance Dashboard Example
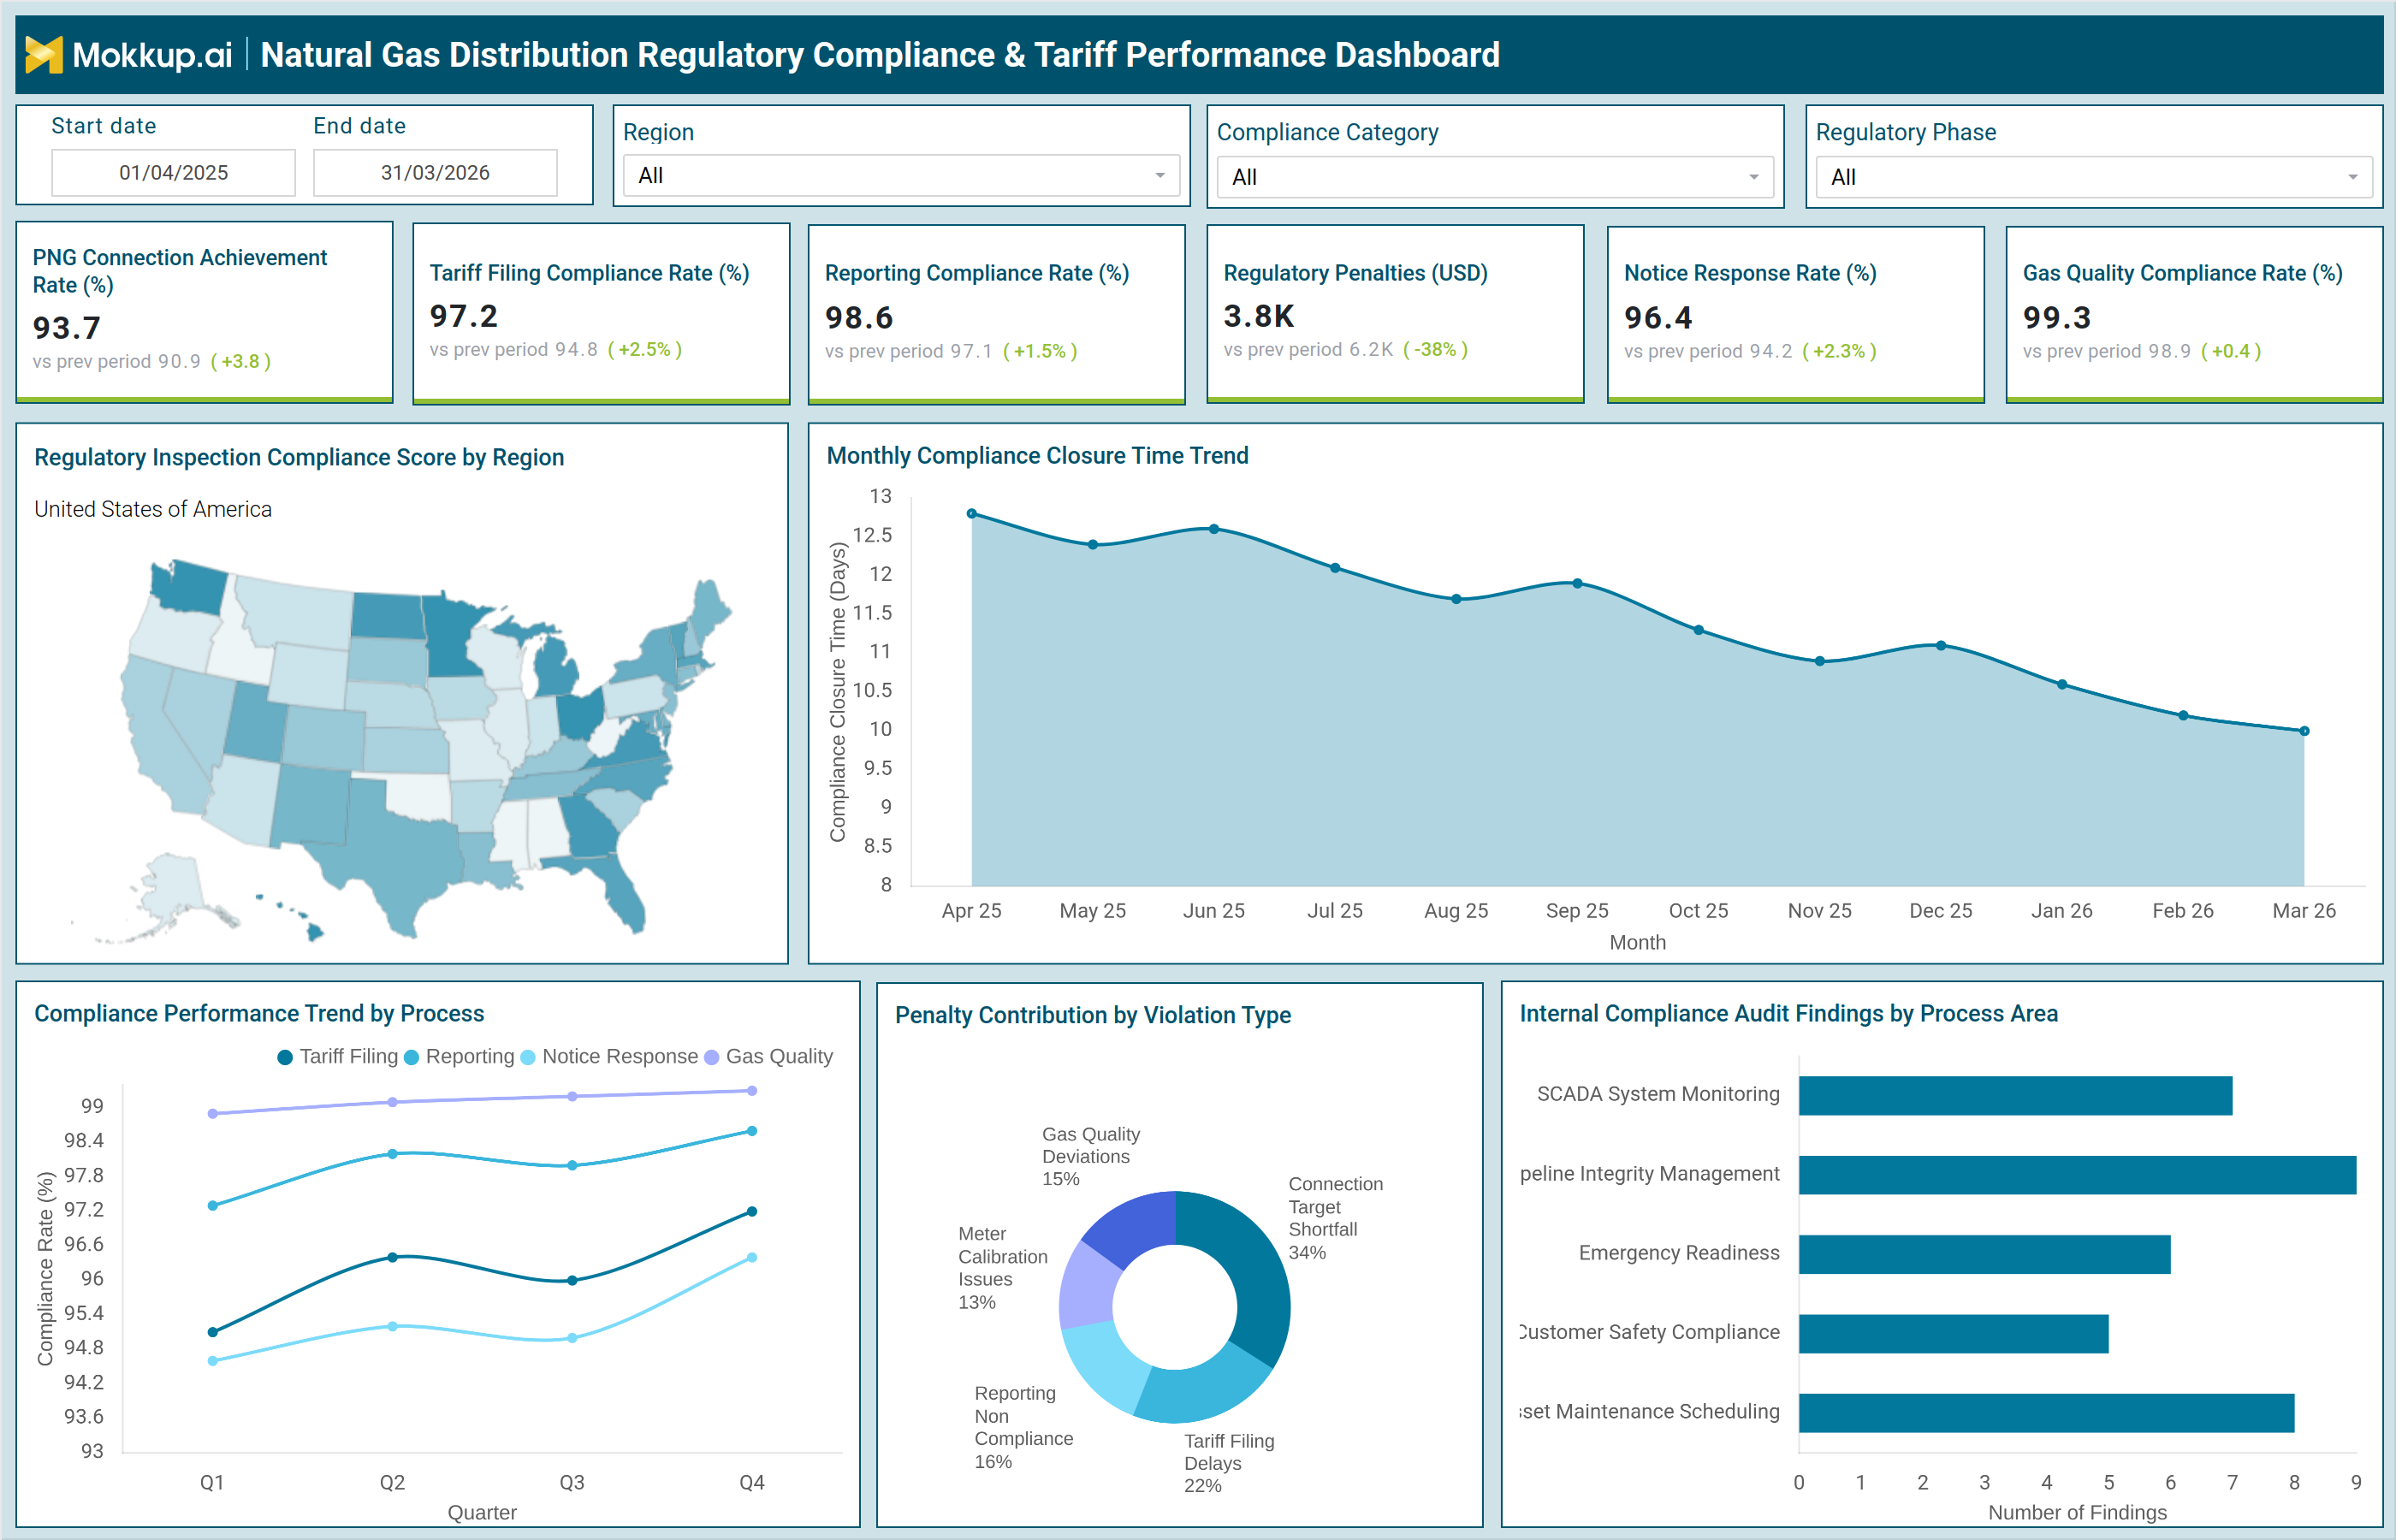
A typical natural gas tariff analytics dashboard presents a structured view of compliance and tariff-related KPIs. For example, PNG connection achievement is tracked at 93.7%, indicating network expansion performance. Tariff filing compliance at 97.2% and reporting compliance at 98.6% reflect strong adherence to regulatory requirements. The dashboard also highlights regulatory penalties, which have been reduced to $3.8K, indicating improved compliance performance. Notice response rate at 96.4% ensures timely engagement with regulatory bodies, while gas quality compliance at 99.3% confirms adherence to quality standards. Visual insights include regional compliance scores, helping identify areas with lower inspection performance. Monthly compliance closure time trends track how quickly compliance issues are resolved. Additionally, process-level compliance trends highlight performance across tariff filing, reporting, notice response, and gas quality processes. Penalty contribution analysis identifies key violation types such as tariff filing delays and connection shortfalls. Internal audit findings further highlight operational gaps in areas like pipeline integrity and asset maintenance. This gas distribution regulatory reporting dashboard ensures a comprehensive view of compliance and tariff performance.
How to Analyze Data in Natural Gas Distribution Regulatory Compliance & Tariff Performance Dashboard
Here is how you can analyze data from this dashboard:
- Tariff Filing Compliance Rate: Ensure all regulatory submissions are completed accurately and within deadlines to avoid penalties.
- Reporting Compliance Trends: Monitor consistency in regulatory disclosures over time to maintain transparency and reliability.
- Regulatory Penalties Analysis: Identify major cost drivers and uncover compliance gaps contributing to fines or penalties.
- Notice Response Rate: Track how quickly and effectively your organization responds to regulatory notices and queries.
- Gas Quality Compliance: Ensure operational standards are consistently met to avoid safety risks and regulatory issues.
- Regional Inspection Scores: Analyze performance across different regions to detect location-specific compliance risks.
- Compliance Closure Time Trends: Measure how quickly compliance issues are resolved and identify delays in the process.
- Process-Wise Compliance Performance: Evaluate compliance across different operational processes to pinpoint areas needing improvement.
- Penalty Contribution by Violation Type: Break down penalties by violation category to identify root causes and prevent recurrence.
- Internal Audit Findings: Review audit insights to strengthen internal controls and improve overall compliance posture.
Benefits of Natural Gas Distribution Regulatory Compliance & Tariff Performance Dashboard
The following are the benefits of using this dashboard:
- Centralized Visibility: Get a unified view of compliance status and tariff performance across operations for better control and oversight.
- Reduced Penalties & Risks: Minimize regulatory fines and compliance risks by identifying and addressing issues early.
- Improved Reporting Accuracy: Ensure regulatory reports are accurate, consistent, and submitted on time.
- Enhanced Tariff Performance Monitoring: Track and optimize tariff structures to improve financial and operational outcomes.
- Data-Driven Compliance Management: Use analytics to make informed decisions and strengthen overall compliance strategies.
- Faster Issue Resolution: Identify bottlenecks and resolve compliance issues more quickly and efficiently.
- Better Audit Readiness & Transparency: Maintain clear, auditable records to simplify audits and build stakeholder trust.
- Stronger Process-Level Accountability: Assign ownership and track compliance performance across different processes.
- Proactive Insights with Tariff Optimization Dashboard: Leverage dashboards to uncover trends, risks, and opportunities before they escalate.
- Strategic Decision-Making with Compliance Analytics: Use data-backed insights to guide long-term regulatory and operational strategies.
KPIs to Track in Natural Gas Distribution Regulatory Compliance & Tariff Performance Dashboard
This dashboard allows for the tracking of the following key KPIs:
- PNG Connection Achievement Rate (%) – Measures progress in new gas connections against regulatory or business targets
- Tariff Filing Compliance Rate (%) – Tracks accuracy and timeliness of tariff submissions to regulatory bodies
- Reporting Compliance Rate (%) – Measures adherence to regulatory reporting standards and schedules
- Regulatory Penalties (USD) – Tracks financial penalties incurred due to compliance failures
- Notice Response Rate (%) – Measures responsiveness to regulatory notices and queries
- Gas Quality Compliance Rate (%) – Ensures gas quality standards are consistently maintained
- Regulatory Inspection Compliance Score – Evaluates compliance performance across regions during inspections
- Compliance Closure Time (Days) – Tracks time taken to resolve compliance issues
- Compliance Performance by Process (%) – Measures performance across key compliance processes such as tariff filing and reporting
- Penalty Contribution by Violation Type (%) – Identifies major sources of compliance penalties
- Internal Audit Findings (Count) – Tracks number of compliance issues identified in audits
Frequently Asked Questions
1. Why is a natural gas regulatory compliance dashboard important?
It ensures utilities meet regulatory requirements, avoid penalties, and maintain operational transparency.
2. How does a gas distribution tariff performance dashboard improve operations?
It provides insights into tariff effectiveness and compliance gaps, enabling better pricing and reporting strategies.
3. What data sources are used in this dashboard?
Regulatory systems, audit reports, tariff filings, and operational data sources are integrated.