What is a Water Treatment Plant Asset Reliability Dashboard?
A water treatment plant asset reliability dashboard is a structured operational tool that gives plant managers, maintenance engineers, and reliability teams a unified view of equipment health, maintenance performance, and failure risk across an entire treatment facility. This water treatment plant asset reliability dashboard centralizes key metrics from overall asset availability and mean time between failures to maintenance compliance rate tracking water treatment teams depend on to meet regulatory obligations.
It enables operations managers to monitor every asset class in the plant, from pumps and filters to SCADA/controls and storage tanks, without navigating multiple systems. Utilities running complex treatment infrastructure use this dashboard to maintain equipment uptime, control maintenance costs, and support compliance reporting across all plant types and regions. With predictive maintenance water treatment facility teams can identify deteriorating assets before failures occur, reducing costly emergency interventions.
How to Create a Water Treatment Plant Asset Reliability Dashboard
You don’t need to build your report from scratch, just start with a ready-to-use Water Treatment Plant Asset Reliability dashboard template from Mokkup. Add in your data and export it however you like. Here’s how to do it:
1. Create or Log in to Your Mokkup Account
Start by signing up on Mokkup.ai using your email. If you already have an account, just log in, and you'll be good to go.
2. Choose and Customize Your Dashboard Template
Find the Water Treatment Plant Asset Reliability Dashboard template in the Templates section. Use the drag-and-drop editor to adjust KPIs, edit filters, or add elements based on your data.
3. Export to Your BI Tool
Once your dashboard wireframe is ready, use the BI Tool Export feature to send it directly to Power BI or Tableau for further analysis and enhancements. You can also download the dashboard as a PDF, PNG, or JPEG, embed it on a platform, or invite your team to collaborate.
Note: This is a Pro template. You'll need a Pro subscription on Mokkup to use and customize this dashboard wireframe. Upgrade anytime to unlock full access.
Water Treatment Plant Asset Reliability Dashboard Example
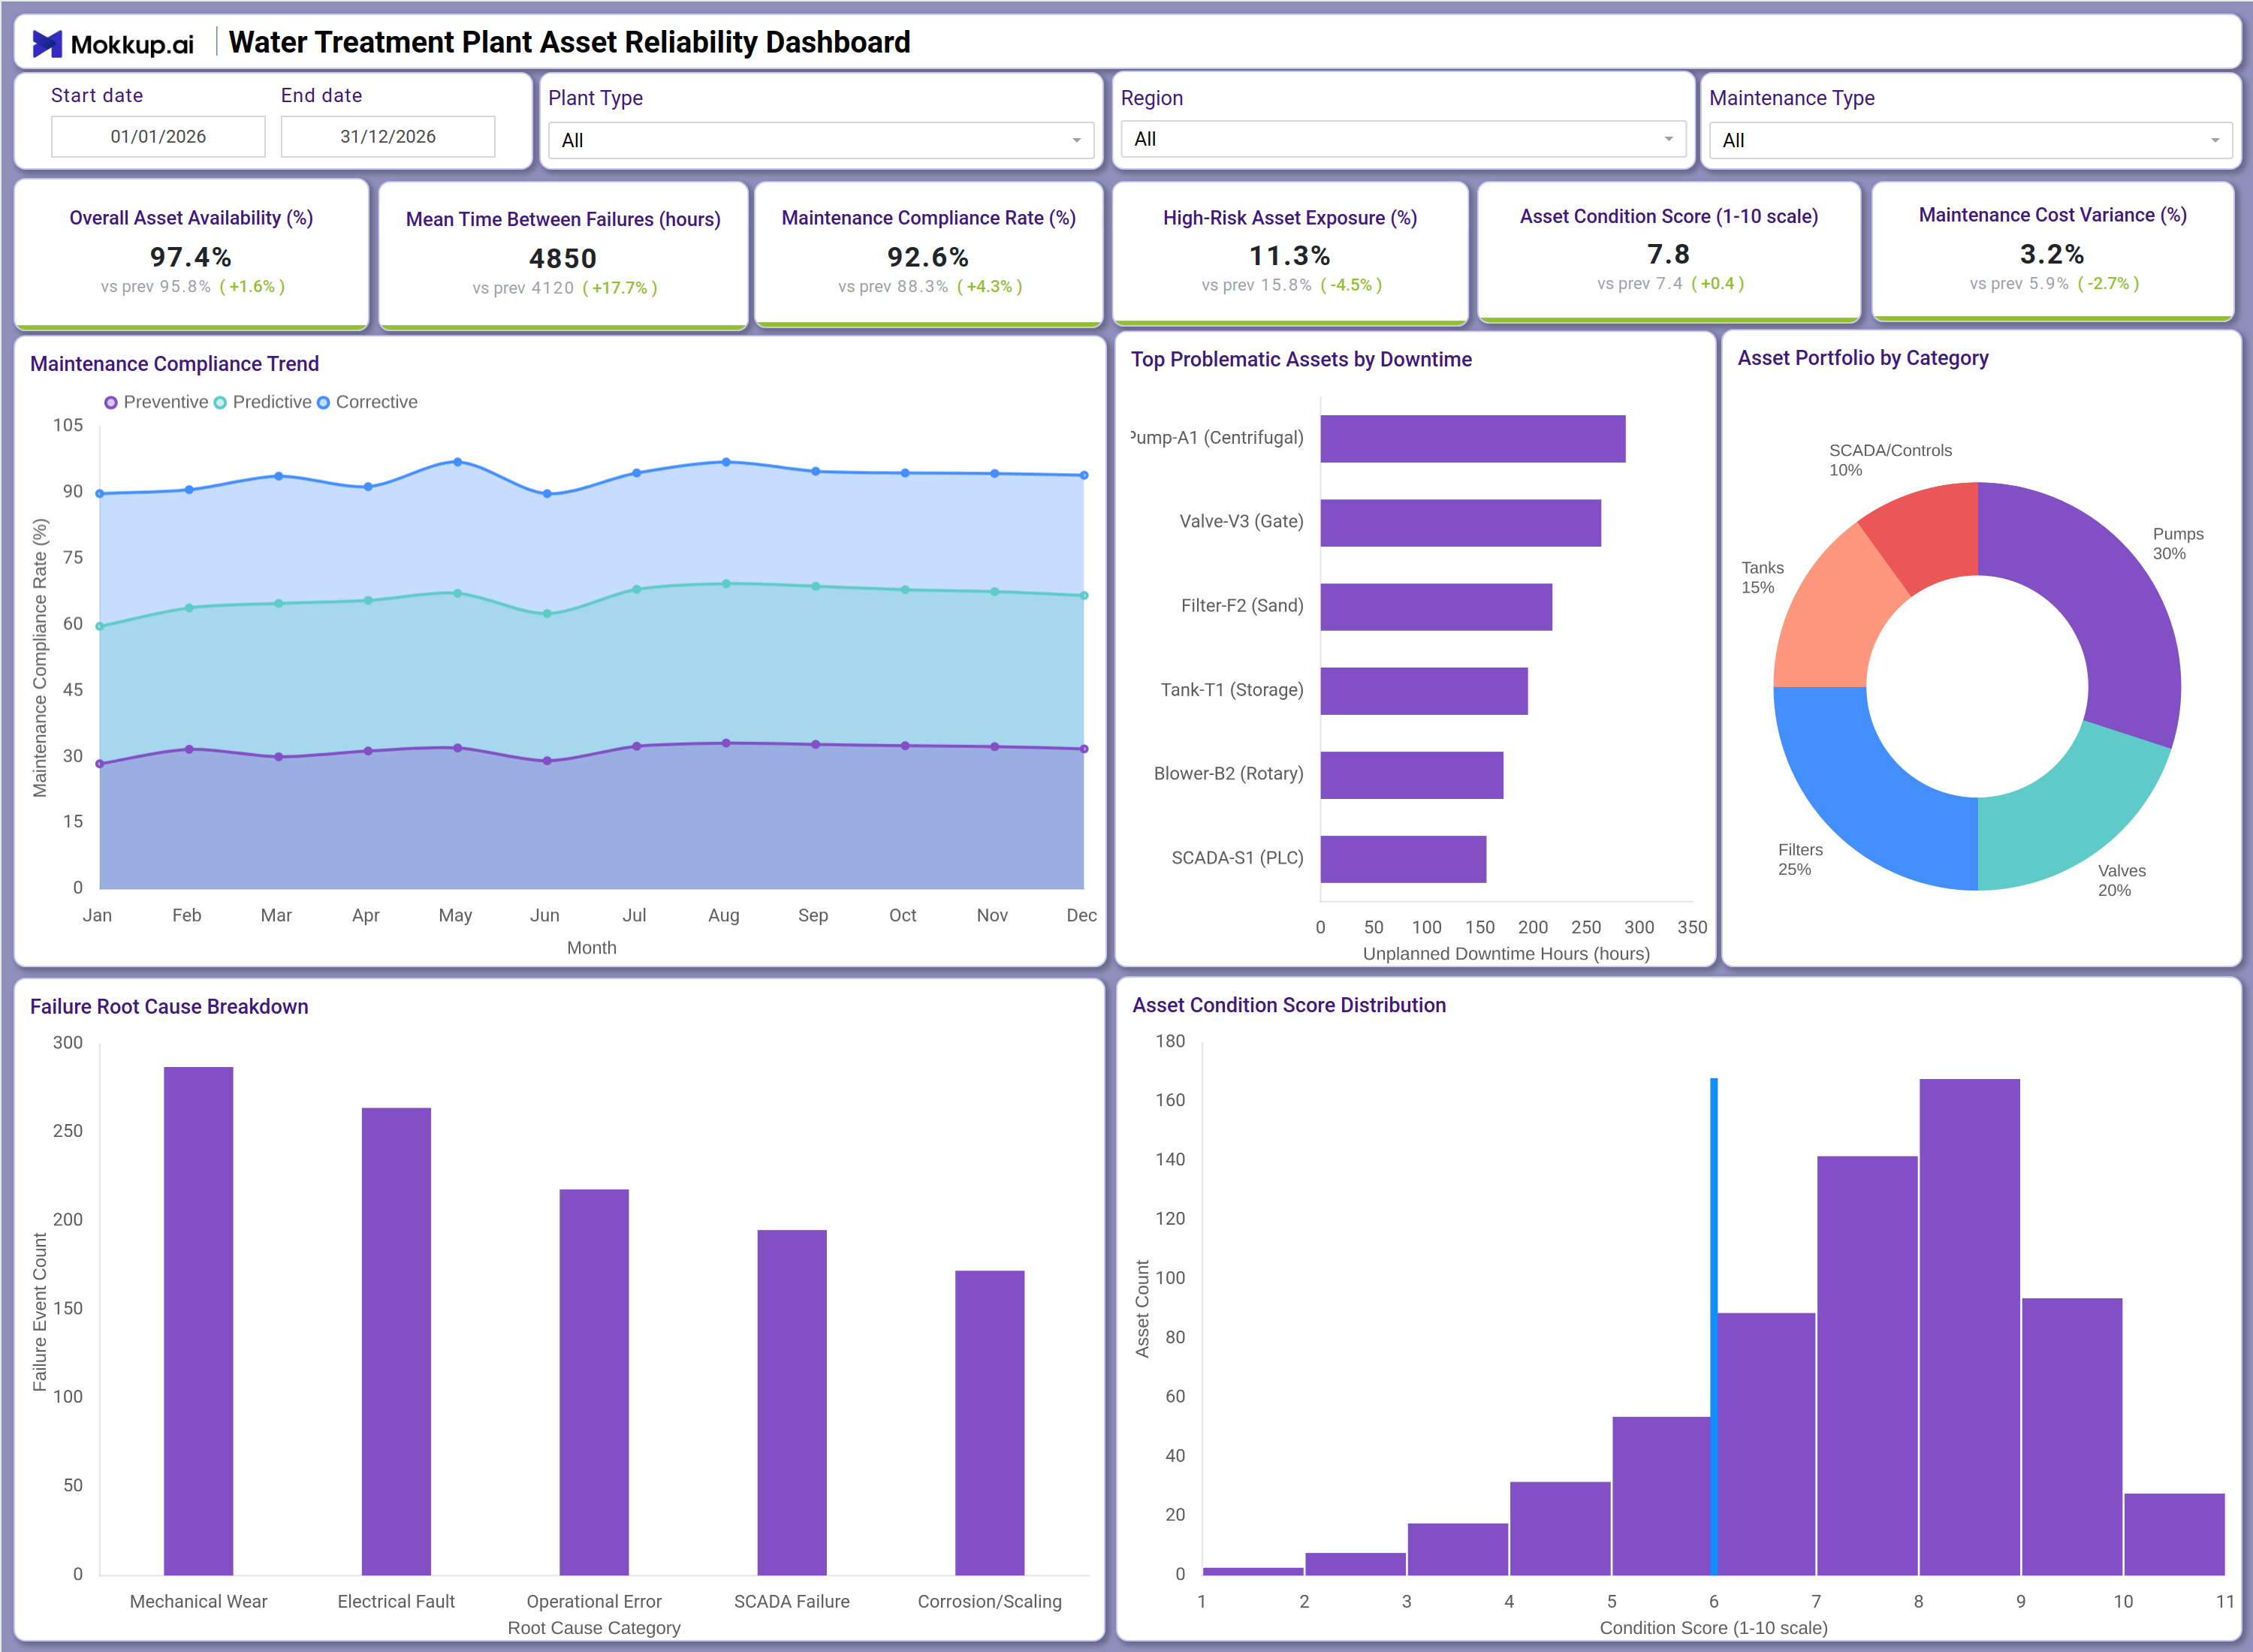
A reliability engineer opens this dashboard at the start of a shift to assess the overall health of the plant's asset base. The top KPI row immediately shows whether availability, compliance, and condition scores are trending positively against prior periods, giving the team a quick read on where the operation stands before drilling into specifics. When asset condition scores appear below the acceptable threshold, the engineer can cross-reference the Asset Condition Score Distribution histogram to understand how many assets cluster in the lower range, prioritizing which units need immediate inspection.
Teams focused on unplanned downtime reduction on water treatment assets can use the Top Problematic Assets by Downtime chart to identify which specific equipment, whether a centrifugal pump or a sand filter, is generating the most unplanned hours, then investigate whether the failure root cause analysis water treatment plant data points toward mechanical wear, corrosion, or SCADA failures as the underlying driver. The Maintenance Compliance Trend area chart gives planners a month-by-month view of how preventive, predictive, and corrective maintenance activities are tracking across the year, making it easy to spot months where corrective work spikes, a leading indicator of deferred preventive maintenance.
How to Analyze Data in a Water Treatment Plant Asset Reliability Dashboard
Here is how you can analyze data from this dashboard:
- Filter by Plant Type: Isolate asset performance for specific treatment facilities.
- Compare Regional Performance: Use the Region filter to analyze downtime and maintenance compliance across zones.
- Separate Maintenance Types: Evaluate preventive, predictive, and corrective maintenance independently.
- Track Maintenance Trends: Monitor compliance trends to identify spikes in corrective maintenance.
- Identify Problematic Assets: Review downtime by equipment type to prioritize maintenance efforts.
- Analyze Failure Causes: Determine whether wear, electrical faults, corrosion, or operational issues drive failures.
- Assess Asset Condition: Use condition score distribution to identify underperforming equipment.
- Review Asset Portfolio Mix: Analyze maintenance exposure across pumps, valves, filters, tanks, and SCADA systems.
Benefits of a Water Treatment Plant Asset Reliability Dashboard
The following are the benefits of using this dashboard:
- Centralized Reliability Monitoring: Combines availability, failures, and maintenance metrics in one dashboard.
- Comprehensive Maintenance Tracking: Supports monitoring of preventive, predictive, and corrective work.
- Reduced Reporting Effort: Prebuilt KPIs simplify equipment health and compliance reporting.
- Better Infrastructure Planning: Enables asset-level prioritization to reduce emergency repair costs.
- Early Failure Detection: Highlights low asset condition scores before breakdowns occur.
- Improved Maintenance Alignment: Helps teams coordinate reliability and compliance programs efficiently.
- Predictive Maintenance Support: Tracks MTBF trends and condition degradation over time.
KPIs to Track in a Water Treatment Plant Asset Reliability Dashboard
The following key KPIs can be tracked by using this dashboard:
- Overall Asset Availability (%): A core measure in any water treatment plant asset reliability dashboard, tracks the percentage of time assets are operational and available for use, directly reflecting maintenance program effectiveness.
- Mean Time Between Failures (hours): Measures average operating time between asset failure events; higher values indicate stronger equipment reliability and the success of preventive and predictive maintenance strategies.
- Maintenance Compliance Rate (%): Tracks the percentage of scheduled maintenance tasks completed on time, critical for maintenance compliance rate tracking water treatment facilities must maintain to meet regulatory and operational standards.
- High-Risk Asset Exposure (%): Quantifies the proportion of assets classified as high risk, helping teams focus intervention resources where failure root cause analysis water treatment plant data shows the greatest vulnerability.
- Asset Condition Score (1-10 scale): Evaluates overall asset health on a standardized scale; central to asset condition score monitoring dashboard workflows that prioritize inspection and replacement decisions.
- Maintenance Cost Variance (%): Measures deviation of actual maintenance spend from planned budget, supporting financial oversight and identifying where cost overruns require management attention.
Frequently Asked Questions
Q1. What industries benefit most from this Water Treatment Plant Asset Reliability Dashboard?
Water utilities, municipal treatment plant operators, and industrial facilities managing large equipment fleets gain the most value. Reliability engineers, plant managers, and operations teams use it to maintain uptime and manage maintenance compliance.
Q2. Can this dashboard track multiple asset categories simultaneously?
Yes. The Asset Portfolio by Category donut chart breaks down the entire equipment base, pumps, filters, valves, tanks, and SCADA/controls, so teams can monitor health and downtime exposure across all categories at once.
Q3. Is this dashboard suitable for tracking failure root causes over time?
Yes. The Failure Root Cause Breakdown bar chart categorizes failures by mechanical wear, electrical fault, operational error, SCADA failure, and corrosion/scaling, giving teams the data needed to address recurring issues systematically.