What is a Hydrogen Blend Compliance & Pilot Governance Dashboard?
The Hydrogen Blend Compliance & Pilot Governance Dashboard is a structured analytics template built for energy utilities, pipeline operators, and hydrogen program managers overseeing active blending initiatives. This hydrogen blend compliance dashboard template consolidates pilot performance, safety incident tracking, blend stability, and CO2 emission reduction data into a single view. Teams responsible for regulatory compliance rate hydrogen blend monitoring across distribution systems, transmission pipelines, appliance end-use sites, and power generation blends can use this template to replace fragmented manual reports with a unified, governance-ready dashboard. It gives program directors and compliance officers full visibility across all active hydrogen blend pilots without requiring custom report development.
How to Create a Hydrogen Blend Compliance & Pilot Governance Dashboard
You don’t need to build your report from scratch, just start with a ready-to-use Hydrogen Blend Compliance & Pilot Governance dashboard template from Mokkup. Add in your data and export it however you like. Here’s how to do it:
1. Create or Log in to Your Mokkup Account
Start by signing up on Mokkup.ai using your email. If you already have an account, just log in, and you'll be good to go.
2. Choose and Customize Your Dashboard Template
Find the Hydrogen Blend Compliance & Pilot Governance Dashboard template in the Templates section. Use the drag-and-drop editor to adjust KPIs, edit filters, or add elements based on your data.
3. Export to Your BI Tool
Once your dashboard wireframe is ready, use the BI Tool Export feature to send it directly to Power BI or Tableau for further analysis and enhancements. You can also download the dashboard as a PDF, PNG, or JPEG, embed it on a platform, or invite your team to collaborate.
Note: This is a Pro template. You'll need a Pro subscription on Mokkup to use and customize this dashboard wireframe. Upgrade anytime to unlock full access.
Hydrogen Blend Compliance & Pilot Governance Dashboard Example
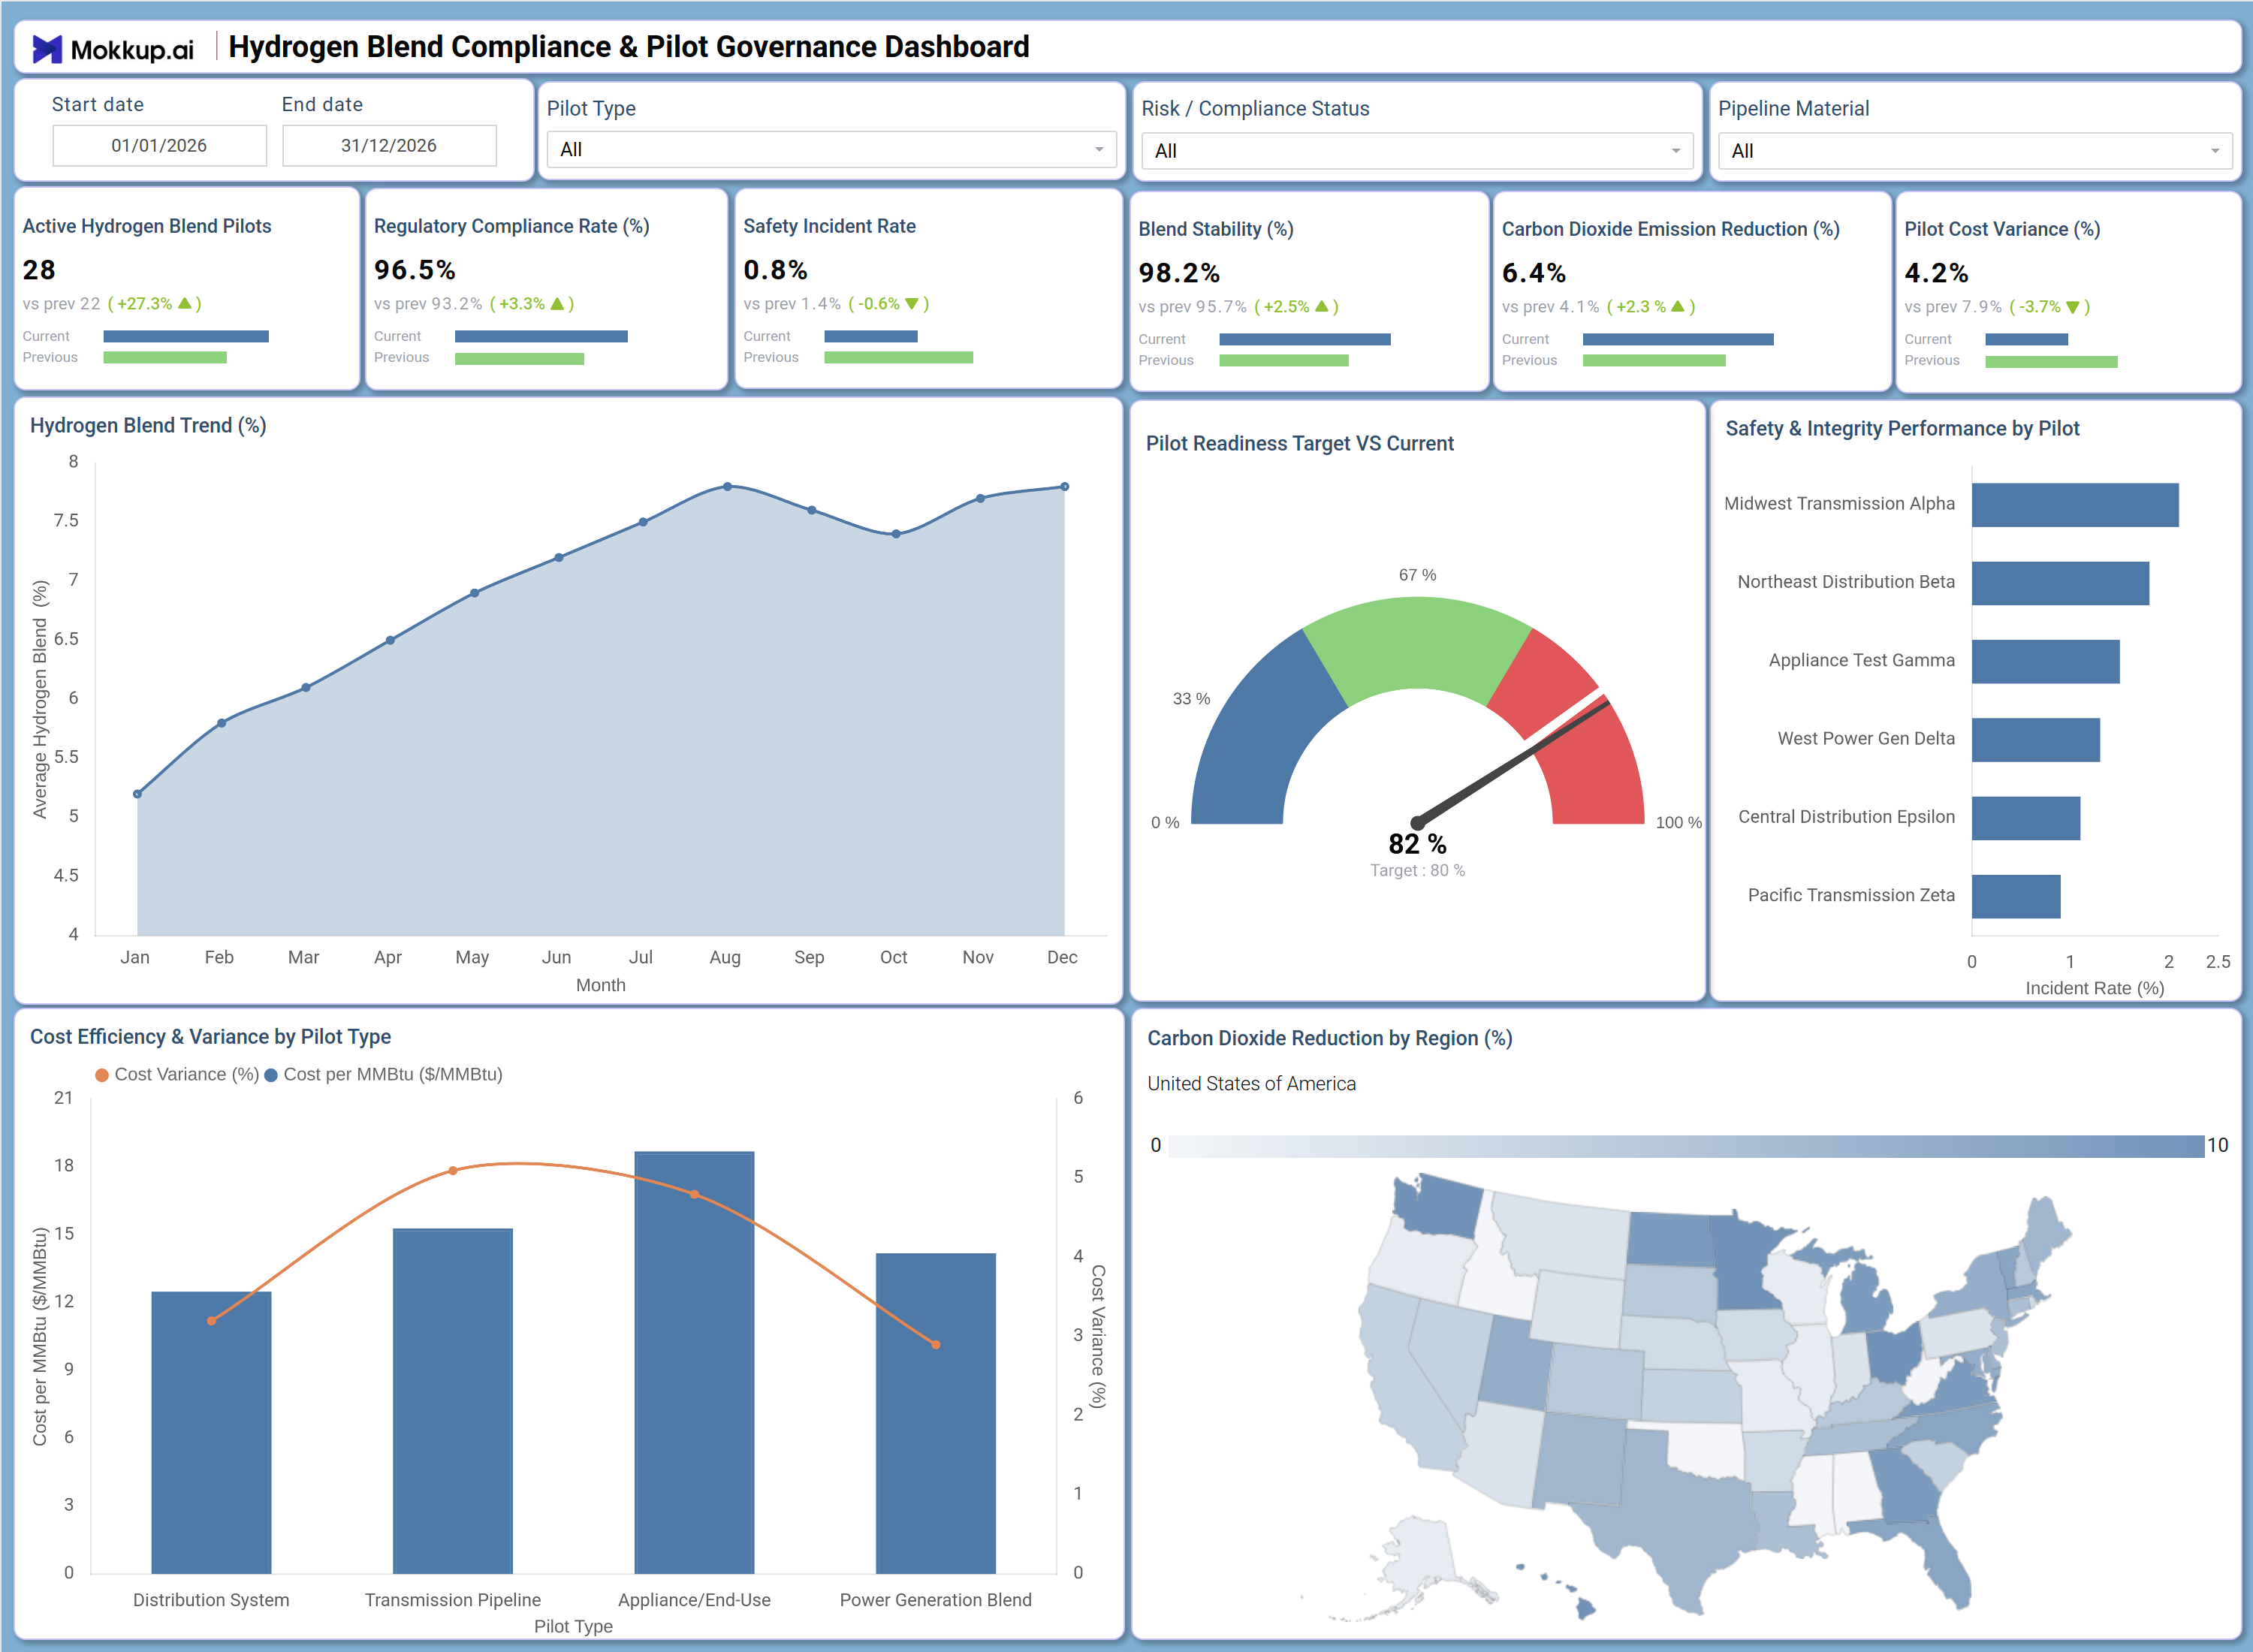
A hydrogen program manager opens this dashboard at the start of a review cycle to assess overall pilot health across regions and pilot types. The KPI row surfaces whether regulatory compliance and blend stability are holding within acceptable thresholds and whether cost pressures are emerging that warrant escalation to stakeholders. This pilot governance dashboard for hydrogen programs allows teams to identify which segments are absorbing the most variance before entering governance meetings.The Hydrogen Blend Trend chart gives planners a month-by-month view of how average blend percentages have shifted, making it straightforward to spot seasonal patterns or deviations linked to infrastructure changes. The Pilot Readiness Target VS Current gauge allows teams to instantly assess whether the overall program is on track, off-track, or exceeding targets, supporting fast go/no-go decisions.
For safety oversight, compliance leads use the Safety & Integrity Performance by Pilot bar chart to compare incident rates across named pilot sites and prioritize audits for sites showing elevated risk. The hydrogen blend stability KPI dashboard metric helps operations teams detect blend percentage drift before it causes compliance failures. The Cost Efficiency & Variance by Pilot Type combo chart supports finance teams in tracking cost per MMBtu alongside carbon dioxide emission reduction hydrogen pilot tracking, identifying where spending diverges from plan.The regional Carbon Dioxide Reduction by Region map allows sustainability leads and governance directors to see which geographies are contributing most to emission targets, and where the pilot governance dashboard for hydrogen programs needs more focused intervention.
How to Analyze Data in a Hydrogen Blend Compliance & Pilot Governance Dashboard
Here is how you can analyze data from this dashboard:
- Filter by Pilot Type: Isolate metrics for distribution, transmission, appliance, or power generation pilots.
- Identify Risk Exposure: Use compliance status filters to focus on at-risk or non-compliant pilots.
- Track Blend Trends: Monitor hydrogen blend percentages to detect monthly fluctuations.
- Assess Pilot Readiness: Review readiness gauges to determine whether programs are on track.
- Analyze Safety Performance: Compare incident rates across pilot sites to identify higher-risk operations.
- Measure Emission Reductions: Use the regional map to evaluate carbon reduction contributions.
- Evaluate Cost Efficiency: Review cost and variance metrics by pilot type for financial planning.
- Assess Infrastructure Impact: Filter by pipeline material to analyze effects on blend stability and compliance.
- Scope Reporting Periods: Use date filters to align metrics with audit and governance reviews.
Benefits of a Hydrogen Blend Compliance & Pilot Governance Dashboard
The following are the benefits of using this dashboard:
- Centralized Governance View: Combines compliance, safety, cost, and emissions metrics in one dashboard.
- Simplified Compliance Tracking: Supports monitoring across multiple hydrogen pilot types.
- Reduced Reporting Effort: Prebuilt KPIs streamline governance and regulatory reporting.
- Regional Emission Insights: Tracks carbon reduction performance across pilot locations.
- Financial Planning Support: Provides detailed cost and variance analysis by pilot type.
- Regulatory Alignment: Helps teams manage governance requirements efficiently.
- Shared Operational Visibility: Aligns operations, compliance, and leadership teams around pilot performance.
KPIs to Track in a Hydrogen Blend Compliance & Pilot Governance Dashboard
The following key KPIs can be tracked by using this dashboard:
- Active Hydrogen Blend Pilots (count): Tracks the total number of hydrogen blend pilots currently active - a core input for hydrogen blend compliance dashboard template capacity planning.
- Regulatory Compliance Rate (%): Measures the percentage of active pilots meeting all regulatory requirements - central to regulatory compliance rate hydrogen blend monitoring across all program phases.
- Safety Incident Rate (%): Quantifies the proportion of pilots reporting safety incidents - key to maintaining integrity standards across all pilot sites.
- Blend Stability (%): Evaluates how consistently pilots maintain the target hydrogen blend percentage - a critical hydrogen blend stability KPI dashboard metric for operational assurance.
- Carbon Dioxide Emission Reduction (%): Measures the percentage reduction in CO2 emissions attributable to hydrogen blending - essential for carbon dioxide emission reduction hydrogen pilot tracking.
- Pilot Cost Variance (%): Tracks the deviation of actual pilot costs from planned budgets - supporting cost efficiency variance hydrogen pilot type analysis and governance reporting.
Frequently Asked Questions
Q1. What industries benefit most from the Hydrogen Blend Compliance & Pilot Governance Dashboard?
This dashboard is designed for gas utilities, pipeline operators, and energy transition program managers overseeing hydrogen blending initiatives. Regulatory compliance teams, operations finance leads, and pilot governance directors will find it most applicable to their workflows.
Q2. Can this dashboard track safety performance across individual pilot sites?
Yes. The Safety & Integrity Performance by Pilot bar chart displays incident rates for each named pilot site, enabling compliance leads to compare performance and prioritize sites requiring closer review or audit.
Q3. Is this dashboard suitable for multi-region hydrogen program governance?
Yes. The Carbon Dioxide Reduction by Region (%) map provides a geographic view of emission reduction contributions, and the Pilot Type and Pipeline Material filters allow teams to segment data across diverse regional infrastructure configurations.