
What is a Water Treatment Plant Asset Lifecycle & Replacement Dashboard?
A water treatment plant asset lifecycle management dashboard is a centralized analytics tool that helps utilities monitor asset aging, utilization, replacement needs, and lifecycle costs. It provides visibility into how critical assets such as membranes, filters, and ion exchange systems perform across different lifecycle stages. This type of water treatment asset replacement planning dashboard enables operators to track remaining useful life, overdue replacements, and cost variance while aligning maintenance and capital planning decisions. The dashboard integrates operational, maintenance, and financial data to support water utility asset lifecycle analytics dashboard use cases. It helps utilities move from reactive maintenance to structured lifecycle planning. By combining metrics like lifecycle utilization, replacement backlog, and cost breakdown, utilities can optimize asset performance, reduce downtime risk, and improve capital allocation.
How to Create a Water Treatment Plant Asset Lifecycle & Replacement Dashboard
You don’t need to build your report from scratch, just start with a ready-to-use dashboard template from Mokkup. Add in your data and export it however you like. Here’s how to do it:
1. Create or Log in to Your Mokkup Account
Start by signing up on Mokkup.ai using your email. If you already have an account, just log in, and you’ll be good to go.
2. Choose and Customize Your Dashboard Template
Find the Water Treatment Plant Asset Lifecycle & Replacement Dashboard template in the Templates section. Use the drag-and-drop editor to adjust KPIs, edit filters, or add elements based on your data.
3. Export to Your BI Tool
Once your dashboard wireframe is ready, use the BI Tool Export feature to send it directly to Power BI or Tableau for further analysis and enhancements. You can also download the dashboard as a PDF, PNG, or JPEG, embed it on a platform, or invite your team to collaborate.
Note: This is a Pro template. You’ll need a Pro subscription on Mokkup to use and customize this dashboard wireframe. Upgrade anytime to unlock full access.
Water Treatment Plant Asset Lifecycle & Replacement Dashboard Example
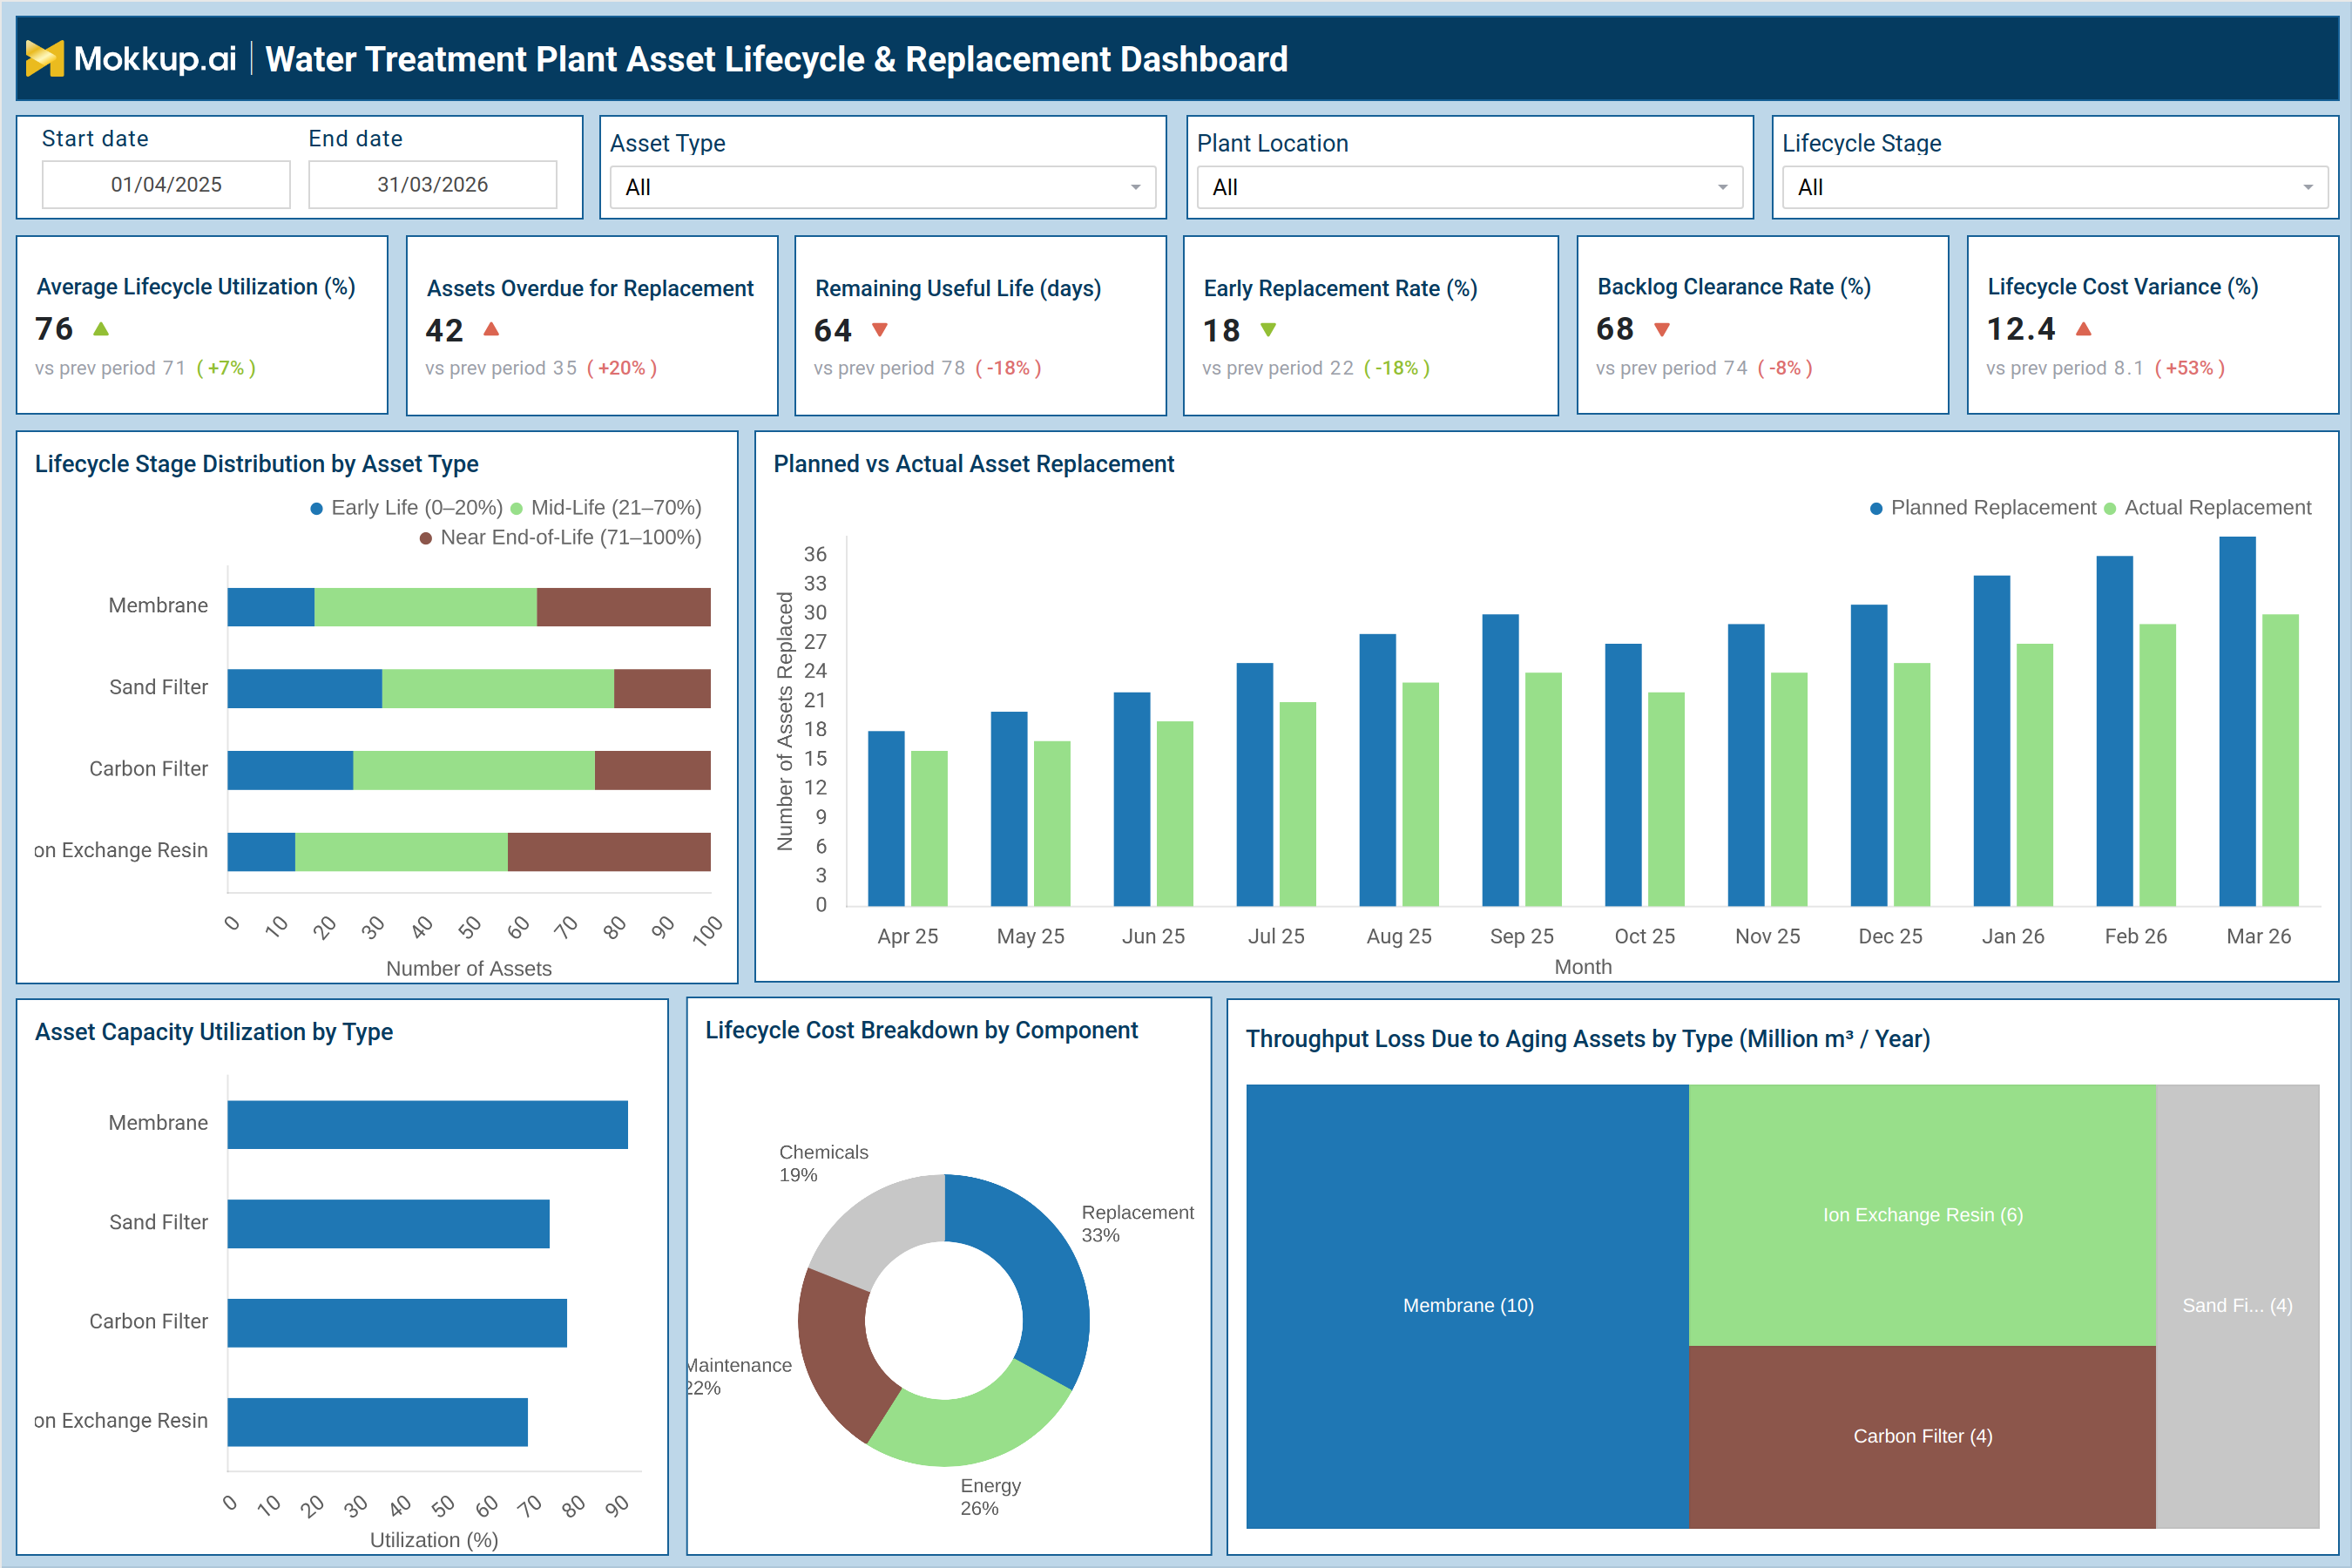
A typical water treatment plant asset renewal planning dashboard includes KPI cards and visuals that provide a complete view of asset health and replacement strategy. For example, the dashboard may show lifecycle utilization at 76%, indicating moderate asset usage across systems. At the same time, 42 assets may be overdue for replacement, signaling a growing risk in infrastructure reliability. The dashboard also tracks remaining useful life (for example, 64 days), helping maintenance teams prioritize interventions. Planned vs actual replacement trends highlight execution gaps, where planned replacements exceed actual completions over several months. This indicates delays in capital execution. Visuals such as lifecycle stage distribution show how assets are spread across early, mid, and end-of-life stages. Cost breakdown charts reveal that replacement and energy contribute the largest share of lifecycle cost. Additionally, throughput loss caused by aging assets helps quantify operational impact. This combination makes the water treatment infrastructure replacement monitoring dashboard actionable for both operations and finance teams.
How to Analyze Data in Water Treatment Plant Asset Lifecycle & Replacement Dashboard
Here is how you can analyze data from this dashboard:
- Start with lifecycle utilization to understand overall asset usage efficiency across the plant
- Review assets overdue for replacement to identify immediate risk areas
- Analyze remaining useful life trends to prioritize maintenance planning
- Compare planned vs actual replacement to detect execution gaps in asset renewal
- Evaluate lifecycle stage distribution to assess aging asset concentration
- Check the backlog clearance rate to understand how quickly replacement issues are resolved
- Analyze lifecycle cost variance to identify budget overruns or inefficiencies
- Review cost breakdown by component (energy, maintenance, replacement) for optimization opportunities
- Assess throughput loss due to aging assets to quantify operational impact
- Compare utilization by asset type to identify underperforming or overused equipment
Benefits of Water Treatment Plant Asset Lifecycle & Replacement Dashboard
The following are the benefits of using this dashboard:
- Improves visibility into asset aging and lifecycle stages across treatment plants
- Enables proactive asset replacement planning instead of reactive maintenance
- Reduces unplanned downtime by identifying assets nearing end-of-life
- Supports capital budgeting with accurate lifecycle cost insights
- Enhances operational efficiency by optimizing asset utilization
- Helps reduce lifecycle cost through data-driven decision making
- Improves regulatory compliance by ensuring asset reliability
- Aligns maintenance, operations, and finance teams on asset strategy
- Identifies bottlenecks in replacement execution and backlog clearance
- Supports long-term infrastructure planning using lifecycle analytics
KPIs to Track in Water Treatment Plant Asset Lifecycle & Replacement Dashboard
The following key KPIs can be tracked by using this dashboard:
- Average Lifecycle Utilization (%): Measures how effectively assets are used across their lifecycle stages
- Assets Overdue for Replacement: Tracks the number of assets that have exceeded their expected lifecycle
- Remaining Useful Life (days): Indicates how long assets can operate before replacement is required
- Early Replacement Rate (%): Measures how often assets are replaced before reaching end-of-life
- Backlog Clearance Rate (%): Tracks how efficiently overdue replacement tasks are resolved
- Lifecycle Cost Variance (%): Compares actual lifecycle costs against planned budgets
- Planned vs Actual Replacement: Evaluates execution performance of asset replacement programs
- Asset Capacity Utilization (%): Measures how effectively different asset types are utilized
- Lifecycle Cost Breakdown (%): Shows distribution of costs across energy, maintenance, and replacement
- Throughput Loss Due to Aging Assets: Quantifies production loss caused by aging infrastructure
Frequently Asked Questions
1. Why is a Water Treatment Asset Lifecycle dashboard important?
It helps utilities monitor asset health, predict failures, and plan replacements effectively, reducing downtime and cost.
2. Who uses this dashboard?
Asset managers, maintenance teams, plant operators, and finance teams use it for lifecycle planning and capital allocation.
3. How does this dashboard support cost optimization?
It provides visibility into lifecycle costs and identifies inefficiencies, supporting water utility asset lifecycle cost optimization dashboard strategies.