
What is a Water Treatment Operator Certification & Workforce Compliance Dashboard
The Water Treatment Operator Certification & Workforce Compliance Dashboard is a dedicated analytics solution designed for water utility managers, compliance officers, and HR teams to monitor the health of operator licensing and certification across treatment facilities. As a water treatment operator certification dashboard, it consolidates compliance rates, headcount by license grade, overdue certification counts, and individual operator statuses into a single structured view. It tracks key metrics such as Operator Certification Compliance Rate, Certified Operator Headcount by Grade, and Overdue Certifications, giving teams the visibility they need to stay ahead of regulatory requirements. By combining water treatment workforce management capabilities with granular certification tracking, the dashboard enables proactive staffing and recertification decisions before lapses affect operations.
How to Create a Water Treatment Operator Certification & Workforce Compliance Dashboard
You don't need to build your report from scratch; just start with a ready-to-use dashboard template from Mokkup. Add in your data and export it however you like. Here's how to do it:
1. Create or Log in to Your Mokkup Account
Start by signing up on Mokkup.ai using your email. If you already have an account, just log in, and you'll be good to go.
2. Choose and Customize Your Dashboard Template
Find the Water Treatment Operator Certification & Workforce Compliance Dashboard template in the Templates section. Use the drag-and-drop editor to adjust KPIs, edit filters, or add elements based on your data.
3. Export to Your BI Tool
Once your dashboard wireframe is ready, use the BI Tool Export feature to send it directly to Power BI or Tableau for further analysis and enhancements. You can also download the dashboard as a PDF, PNG, or JPEG, embed it on a platform, or invite your team to collaborate.
Note: This is a Pro template. You'll need a Pro subscription on Mokkup to use and customize this dashboard wireframe. Upgrade anytime to unlock full access.
Water Treatment Operator Certification & Workforce Compliance Dashboard Example
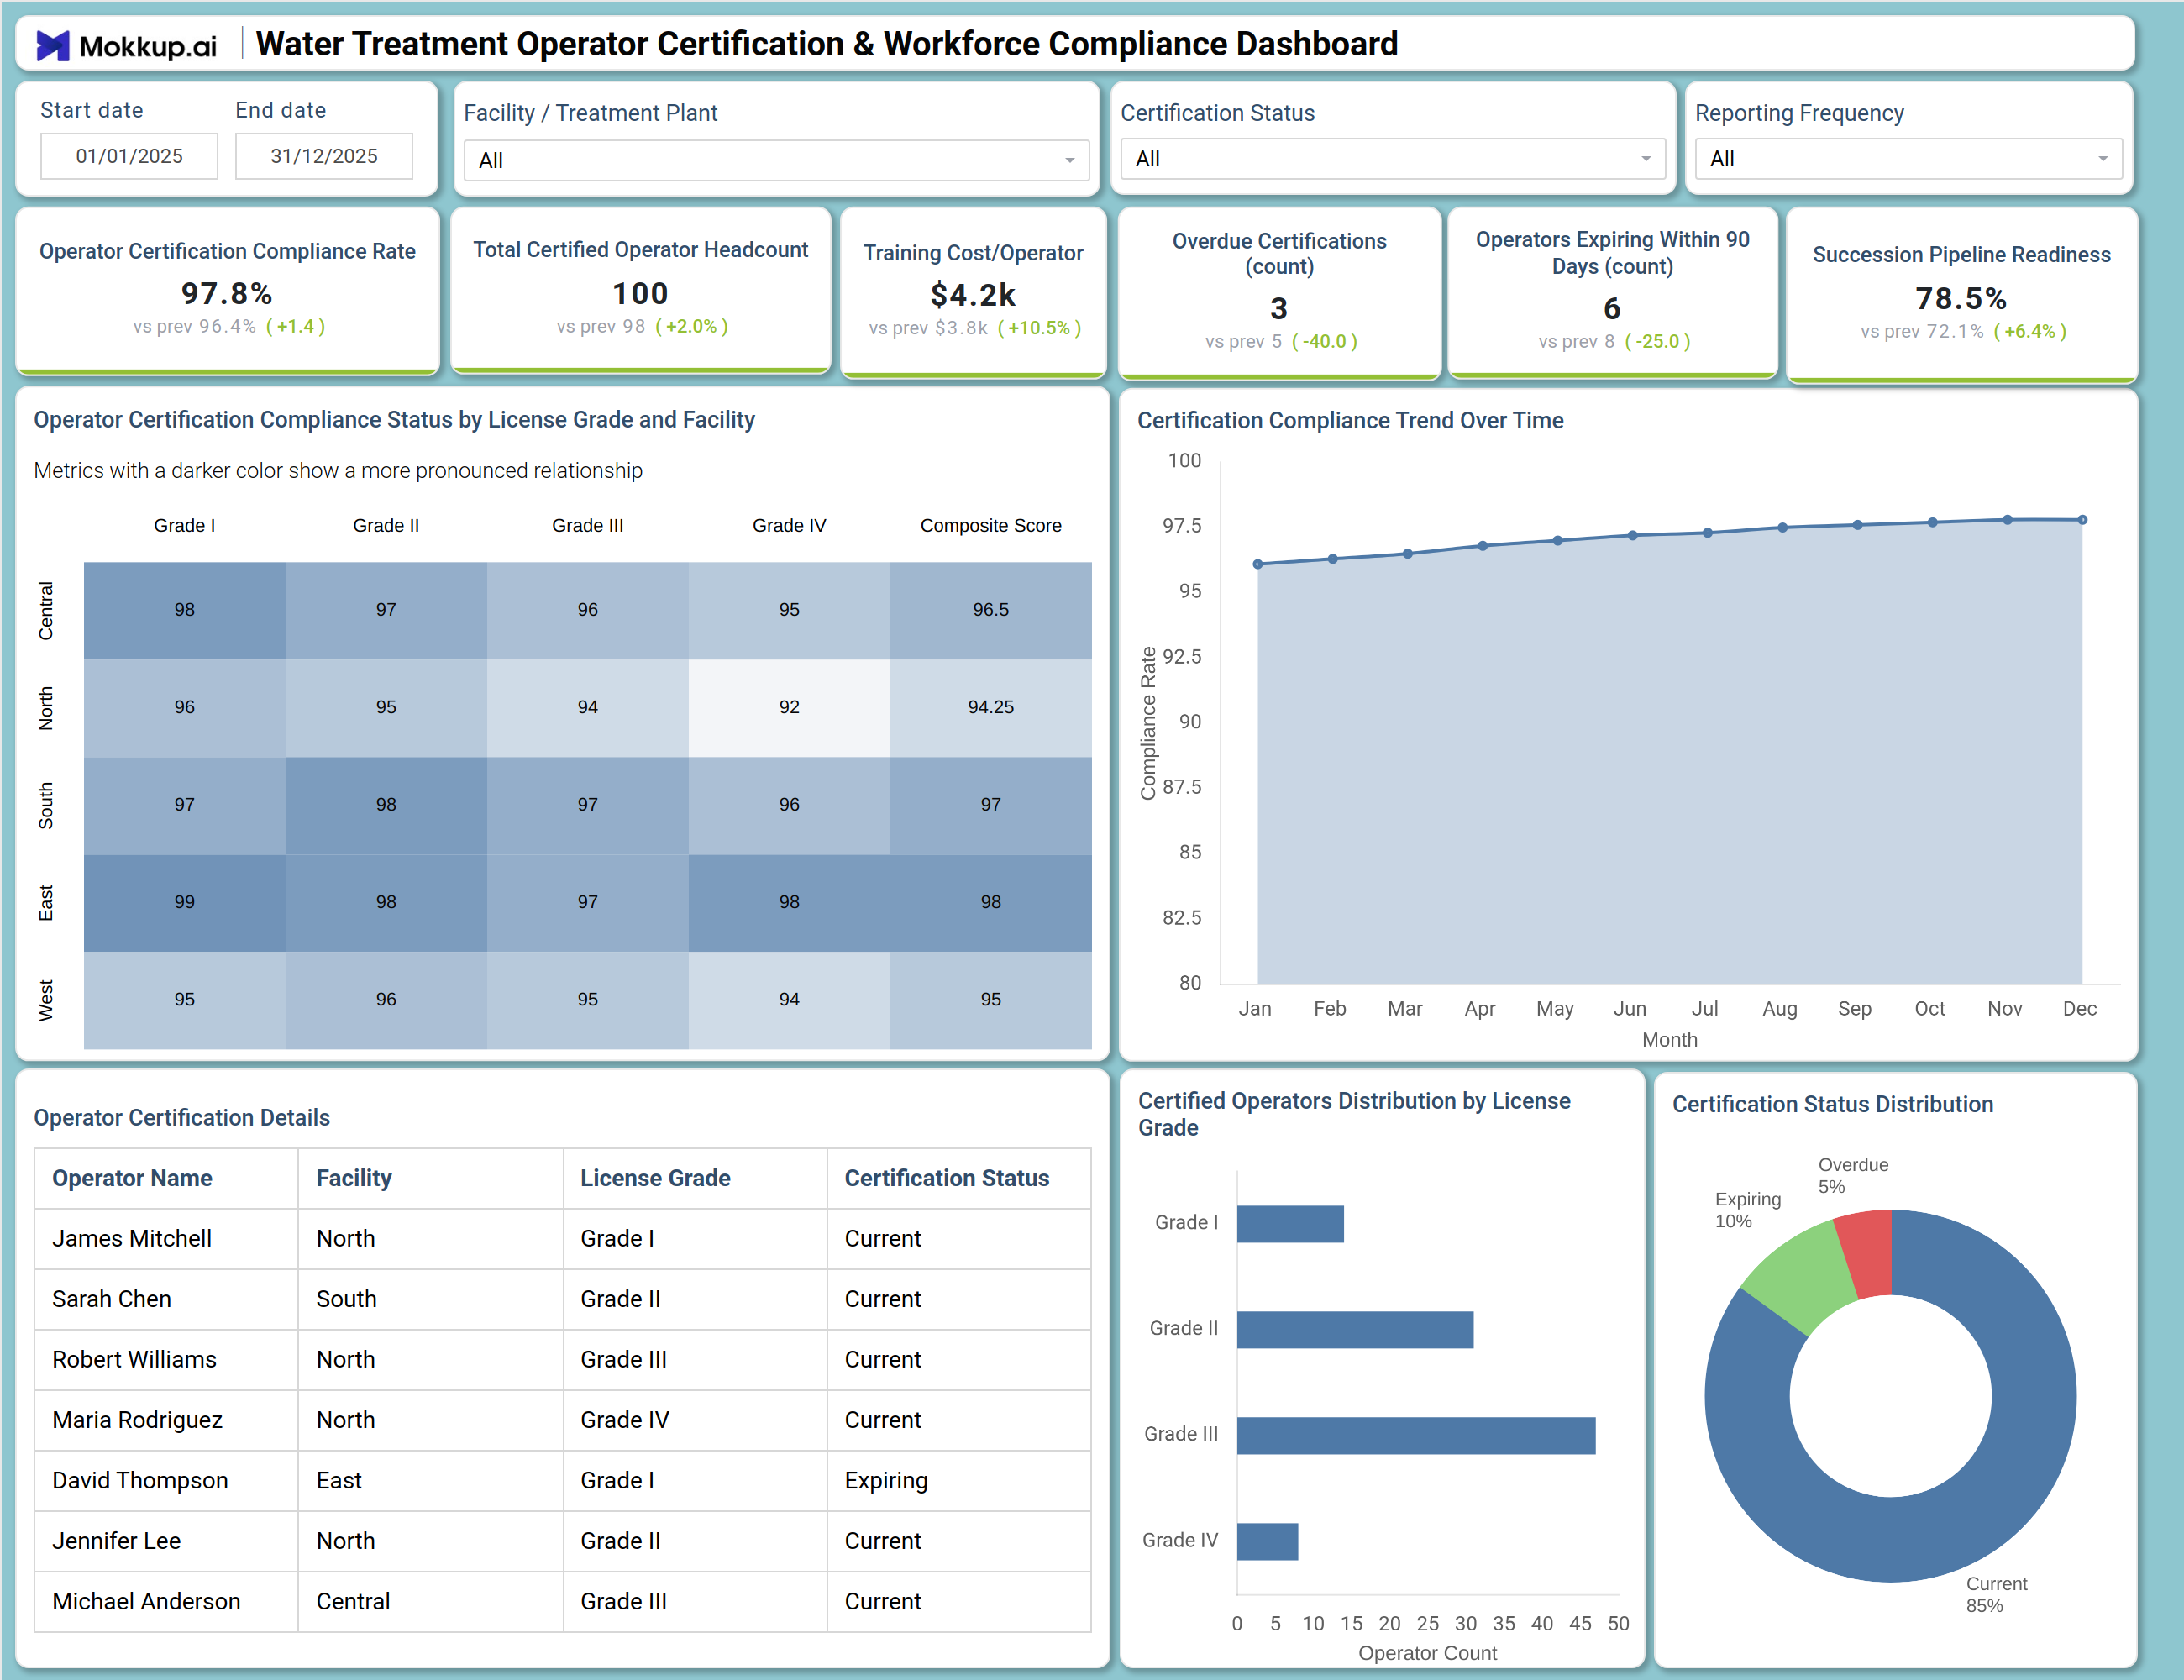
The dashboard opens with five interactive filters — Start Date, End Date, Facility/Treatment Plant, Certification Status, and Reporting Frequency — allowing users to scope data by time period, site, or certification category. Six KPI tiles across the top surface the most critical indicators: Operator Certification Compliance Rate (97.8%), Certified Operator Headcount, Certified Operator Headcount Grade II, Overdue Certifications, Certified Operator Headcount Grade III, and Certified Operator Headcount Grade IV. Below the KPIs, the Operator Certification Compliance Status by License Grade and Facility heatmap and the Certification Compliance Trend Over Time line chart provide the workforce compliance monitoring water treatment teams need to identify compliance gaps by site and track certification trends across the calendar year. The lower section includes the Operator Certification Details table alongside the Certified Operators Distribution by License Grade bar chart and the Certification Status Distribution donut chart, offering a complete picture of who is certified, expiring, or overdue.
How to Analyze Data in a Water Treatment Operator Certification & Workforce Compliance Dashboard
Here is how you can analyze data from this dashboard:
- Use the Facility / Treatment Plant filter to isolate certification performance for a specific site and benchmark it against other locations.
- Review the Operator Certification Compliance Rate KPI tile regularly to detect drops in certified staffing levels before they trigger regulatory violations.
- Monitor the Certification Compliance Trend Over Time line chart to spot seasonal dips in compliance rates and plan renewal campaigns ahead of schedule.
- Analyze the Operator Certification Compliance Status by License Grade and Facility heatmap to support license grade certification compliance tracking across all facilities and grade tiers simultaneously.
- Compare the Certified Operators Distribution by License Grade bar chart to identify which license tiers have the fewest operators and prioritize targeted hiring.
- Inspect the Operator Certification Details table to find individual operators with Expiring or Overdue status and assign recertification tasks to the appropriate facility managers.
- Filter by Certification Status to focus exclusively on overdue certifications and escalate remediation to the relevant facility leads.
- Track Certified Operator Headcount Grade IV over time to measure progress in building a senior-tier certified workforce and identify succession gaps early.
Benefits of a Water Treatment Operator Certification & Workforce Compliance Dashboard
The following are the benefits of using this dashboard:
- Centralizes operator certification compliance rates, headcount by license grade, and overdue certification counts across all treatment facilities in one structured template.
- Supports workforce compliance monitoring water treatment organizations rely on by consolidating multi-facility and multi-grade certification data into a single dashboard view.
- Reduces manual data compilation for regulatory compliance reporting with pre-built KPI tiles and chart layouts ready for immediate use.
- Enables facility-level certified operator headcount analysis to guide hiring, scheduling, and recertification planning before operational gaps emerge.
- Provides a heatmap breakdown of certification compliance scores across license grades and facilities for targeted operational efficiency planning.
- Helps compliance officers align with multiple regulatory licensing requirements without rebuilding reports from scratch for each audit cycle.
- Gives HR managers and plant operations teams a shared view of workforce certification performance across all treatment sites.
KPIs to Track in a Water Treatment Operator Certification & Workforce Compliance Dashboard
The following key KPIs can be tracked by using this dashboard:
- Operator Certification Compliance Rate (%): This certification compliance rate water utility managers track daily reflects the percentage of operators holding valid, current certifications — a core indicator for regulatory standing.
- Certified Operator Headcount (count): Tracks the total number of actively certified operators across all facilities — essential for assessing whether staffing levels meet licensing requirements.
- Overdue Certifications (count): Quantifies the number of operators whose certifications have lapsed — central to license grade certification compliance tracking and driving timely remediation actions.
- Certified Operator Headcount Grade III (count): Measures mid-tier staffing depth at the Grade III level — key to certified operator headcount analysis for planning shift coverage and succession.
- Certified Operator Headcount Grade IV (count): Evaluates the availability of senior-tier Grade IV certified operators against facility requirements — supporting long-term workforce succession planning.
- Certified Operator Headcount Grade II (count): Tracks the Grade II certified workforce across all facilities and license tiers — an important dimension of the overall certification compliance picture.
Frequently Asked Questions
1. What teams use a Water Treatment Operator Certification & Workforce Compliance Dashboard?
Water utility compliance officers, facility operations managers, HR and workforce planning teams, and regulatory reporting staff all rely on this dashboard to monitor operator licensing status and maintain certification standards across sites.
2. How does this dashboard improve regulatory compliance in water treatment?
By surfacing the Operator Certification Compliance Rate, Overdue Certifications count, and the Certification Compliance Trend Over Time chart in one view, the dashboard allows managers to identify and resolve certification gaps before they result in regulatory penalties or staffing shortfalls.
3. Can this dashboard track multiple facility locations simultaneously?
Yes — the Facility / Treatment Plant filter lets users drill into individual sites, while the Operator Certification Compliance Status by License Grade and Facility heatmap displays all facilities side by side for direct compliance comparison across grades.
4. How does the Operator Certification Compliance Status by License Grade and Facility heatmap work?
The heatmap displays compliance percentages for every combination of facility (Central, North, South, East, West) and license grade (Grade I through Grade IV), with a Composite Score column summarizing each facility's overall standing. Darker cell shading indicates more pronounced compliance gaps, making it easy to pinpoint underperforming facility-grade combinations at a glance.
5. What does the Certification Status Distribution chart measure?
The Certification Status Distribution donut chart segments operators into three categories — Current, Expiring, and Overdue — providing a quick snapshot of the certification compliance rate water utility managers use to gauge overall workforce readiness and prioritize upcoming renewal efforts.