
What is a CNG Distribution Regulatory Compliance Dashboard?
A CNG Distribution Regulatory Compliance Dashboard template is a comprehensive visualization platform designed to monitor, track, and manage compliance with federal, state, and local regulations across Compressed Natural Gas (CNG) distribution networks. It consolidates critical compliance metrics, including compliance scores, inspection pass rates, regulatory penalties, open compliance issues, repeat violation rates, and compliance training completion into a unified interface.
By integrating CNG regulatory compliance tracking, inspection management analytics, compliance score monitoring, and regulatory penalty reduction, this dashboard enables compliance officers, HSE managers, station operators, and regulatory affairs leadership to ensure adherence to all applicable regulations, proactively address compliance gaps, reduce penalty exposure, and demonstrate due diligence to regulatory agencies. It serves as a central command center for comprehensive compliance management across CNG infrastructure.
How to Create a CNG Distribution Regulatory Compliance Dashboard
You don’t need to build your report from scratch, just start with a ready to use CNG Distribution Regulatory Compliance dashboard template from Mokkup. Add in your data and export it however you like. Here’s how to do it:
1. Create or Log in to Your Mokkup Account
Start by signing up on Mokkup.ai using your email. If you already have an account, just log in, and you’ll be good to go.
2. Choose and Customize Your Dashboard Template
Find the CNG Distribution Regulatory Compliance Dashboard template in the Templates section. Use the drag-and-drop editor to adjust KPIs, edit filters, or add elements based on your data.
3. Export to Your BI Tool
Once your dashboard wireframe is ready, use the BI Tool Export feature to send it directly to Power BI or Tableau for further analysis and enhancements. You can also download the dashboard as a PDF, PNG, or JPEG, embed it on a platform, or invite your team to collaborate.
Note: This is a Pro template. You’ll need a Pro subscription on Mokkup to use and customize this dashboard wireframe. Upgrade anytime to unlock full access.
CNG Distribution Regulatory Compliance Dashboard Example
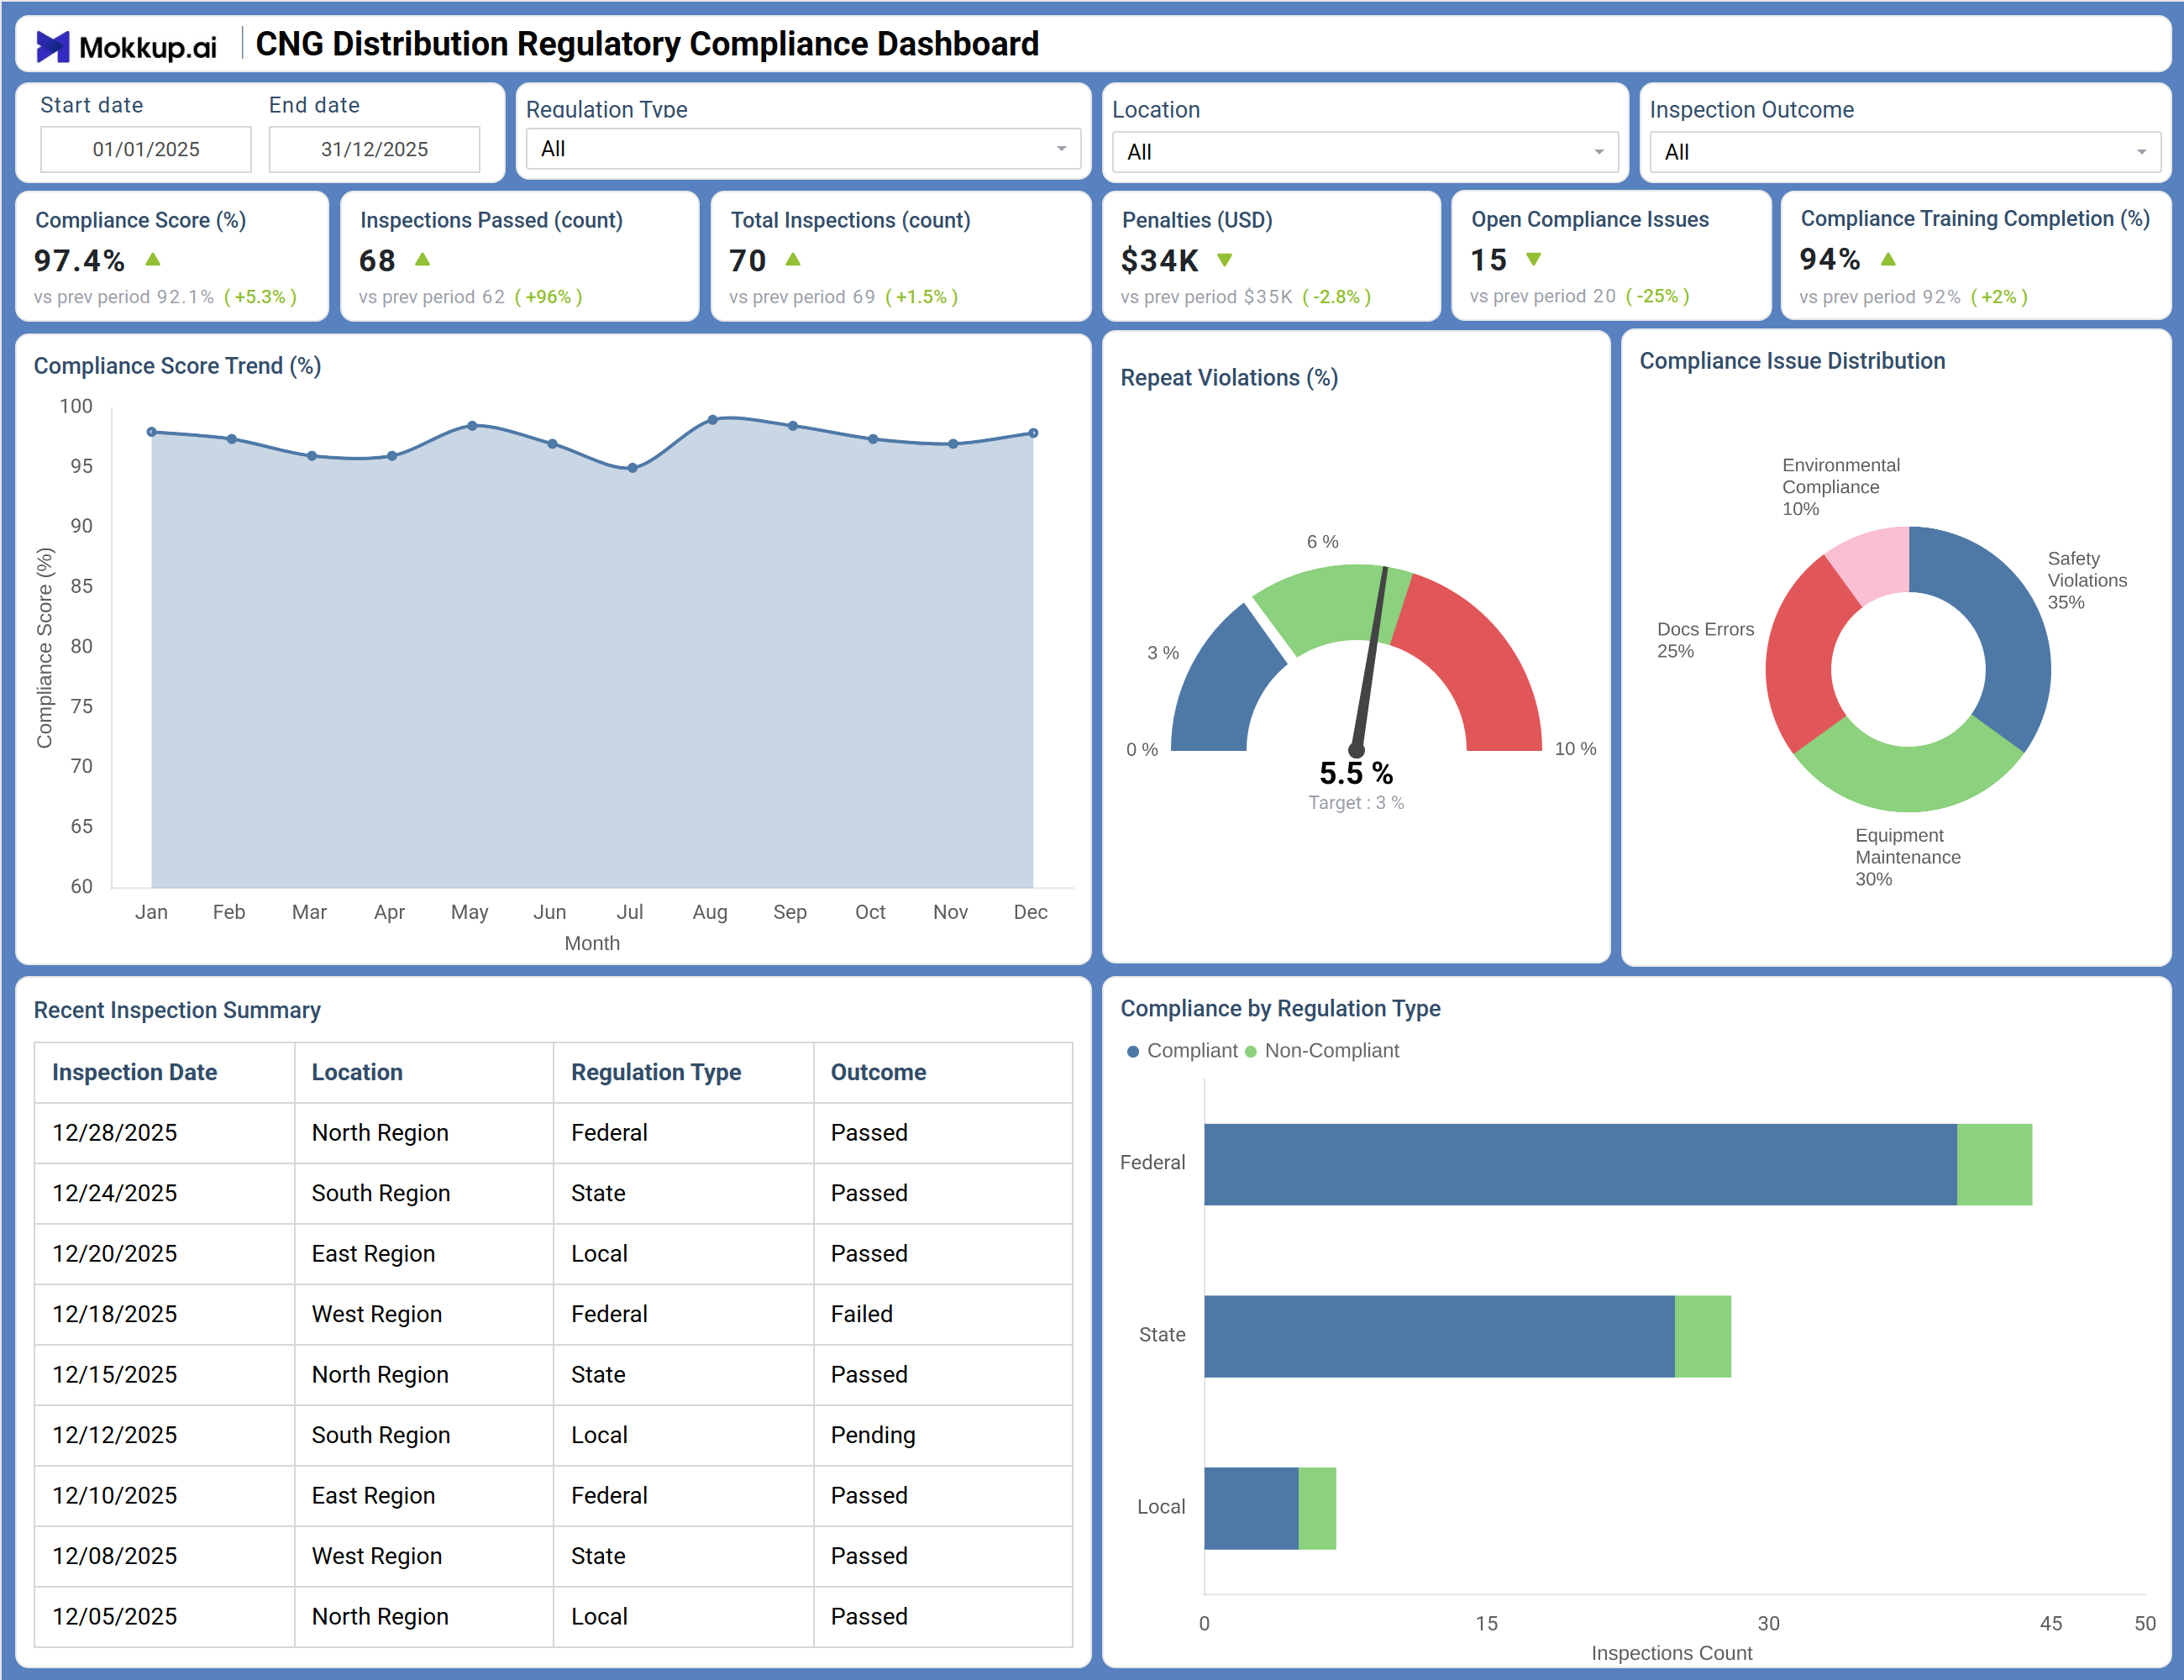
This dashboard delivers a comprehensive view of regulatory compliance performance across CNG distribution operations. The Overview screen prominently displays six critical compliance KPIs with trend indicators: Compliance Score at 97.4% (up 5.3% from prior period), Inspections Passed at 62 (96% increase), Total Inspections at 70 (1.5% growth), Penalties reduced to $34K (25% decrease), Open Compliance Issues reduced to 6 (25% improvement), and Compliance Training Completion at 94% (2 percentage point gain).
The Compliance Score Trend (%) chart tracks monthly compliance performance from January through December, revealing patterns and validating the impact of compliance initiatives. Repeat Violations (%) gauge shows current repeat violation rate at 5.5% against a 3% target, highlighting an area requiring focused improvement. A donut chart breaks down compliance issues by category with Text A (30%), Text B (25%), Text C (20%), Text D (20%), and Text E (5%)—enabling targeted corrective actions.
The Recent Inspection Summary table lists recent inspections with dates, locations, regulation types (Federal, State, Local), and outcomes including Passed, Failed, and Pending. Examples include West Region Federal inspection (Failed on 12/18/2025) and South Region Local inspection (Pending on 12/12/2025)—providing granular visibility for follow-up. Compliance by Regulation Type bar chart compares compliance rates across Federal, State, and Local regulations, identifying which jurisdictional levels require additional attention. Compliance by Year bar chart tracks inspection counts over time for historical trend analysis. Together, these components enable CNG regulatory compliance tracking, inspection management, and data-driven compliance improvement.
How to Analyze Data in a CNG Distribution Regulatory Compliance Dashboard
Here is how you can analyze data from this dashboard:
- Compliance Trend Monitoring: Monitor Compliance Score (%) over time to assess overall adherence.
- Inspection Performance Tracking: Track Inspections Passed and Total Inspections to evaluate success rates.
- Penalty Exposure Analysis: Review Penalties to quantify financial impact of non-compliance.
- Issue Backlog Assessment: Analyze Open Compliance Issues to prioritize remediation efforts.
- Training Compliance Review: Examine Compliance Training Completion to ensure workforce readiness.
- Repeat Violation Analysis: Evaluate Repeat Violations (%) to detect unresolved systemic issues.
- Initiative Impact Correlation: Use Compliance Score Trend to link improvements with actions taken.
- Inspection Follow-Up: Drill into Recent Inspection Summary to address failed or pending cases.
- Regulation-Level Analysis: Analyze Compliance by Regulation Type to identify focus areas.
- Gap Prioritization: Review issue category breakdown to target key compliance gaps.
Benefits of a CNG Distribution Regulatory Compliance Dashboard
The following are the benefits of using this dashboard:
- Centralized Compliance Visibility: Provides a unified view of regulatory adherence across locations.
- Proactive Risk Management: Identifies issues and violations before escalation.
- Reduced Penalty Exposure: Tracks compliance gaps to minimize financial risks.
- Regulatory Reporting Support: Enables audit-ready documentation and reporting.
- Improved Inspection Outcomes: Enhances pass rates through targeted insights.
- Workforce Readiness: Strengthens compliance through training tracking.
- Stakeholder Transparency: Demonstrates due diligence to regulators and investors.
- Benchmarking Capability: Enables comparison across regions and regulation types.
KPIs to Track in a CNG Distribution Regulatory Compliance Dashboard
The following key KPIs can be tracked by using this dashboard:
- Compliance Score (%): Overall percentage adherence to applicable regulations.
- Inspections Passed (count): Number of inspections successfully passed.
- Total Inspections (count): Total number of inspections conducted.
- Penalties (USD): Total financial penalties incurred from compliance violations.
- Open Compliance Issues (count): Number of active compliance issues requiring remediation.
- Compliance Training Completion (%): Percentage of workforce completing required compliance training.
- Repeat Violations (%): Percentage of violations that are repeat occurrences.
- Compliance Score Trend: Monthly compliance score tracking over time.
- Compliance by Regulation Type: Compliance rates broken down by Federal, State, and Local regulations.
- Inspection Outcomes: Breakdown of inspection results (Passed, Failed, Pending).
- Compliance Issue Categories: Distribution of compliance issues by type.
Frequently Asked Questions
Q1. Who is the intended audience for this dashboard?
This dashboard is designed for compliance officers, HSE (Health, Safety & Environment) managers, station operators, regulatory affairs leaders, and corporate compliance directors who need to monitor and manage regulatory adherence across CNG distribution networks.
Q2. Is this dashboard suitable for organizations with limited technical expertise?
Yes. The dashboard presents compliance data in a clear, visual format with intuitive charts, gauges, and tables. No technical expertise is required to interpret the metrics—compliance professionals can immediately understand their compliance status and identify areas needing attention.
Q3. How does this dashboard help reduce regulatory penalties?
By tracking open compliance issues, repeat violations, and inspection outcomes in real-time, the dashboard enables proactive identification and remediation of compliance gaps before they result in regulatory citations or penalties. The penalty KPI also provides visibility into financial exposure trends.
Q4. Can this dashboard track compliance across different types of regulations?
Yes. The dashboard includes filters for Regulation Type (Federal, State, Local) and provides a Compliance by Regulation Type chart that compares performance across jurisdictional levels, enabling targeted compliance management for each regulatory category.
Q5. Is this dashboard useful for organizations with multiple CNG station locations?
Absolutely. The dashboard includes location-based filtering and the Recent Inspection Summary table shows inspection outcomes by region (North, South, East, West), enabling compliance managers to track performance across the entire station network and identify locations requiring additional attention.