
What is a Water Treatment and Purification Sustainability & Resource Efficiency Dashboard?
The Water Treatment and Purification Sustainability & Resource Efficiency Dashboard is an analytics template designed for water utilities, plant managers, and ESG reporting teams. It consolidates operational and environmental metrics into a single view, covering energy consumption, greenhouse gas emissions, regulatory compliance, and water loss across treatment facilities. This water treatment sustainability dashboard helps organizations track operational efficiency while meeting ESG reporting obligations and environmental standards. The dashboard covers treatment stages, zones, and regulatory frameworks, giving decision-makers a clear picture of resource usage and losses.
How to Create a Water Treatment and Purification Sustainability & Resource Efficiency Dashboard
You don't need to build your report from scratch; just start with a ready-to-use dashboard template from Mokkup. Add in your data and export it however you like. Here's how to do it:
1. Create or Log in to Your Mokkup Account
Start by signing up on Mokkup.ai using your email. If you already have an account, just log in, and you'll be good to go.
2. Choose and Customize Your Dashboard Template
Find the Water Treatment and Purification Sustainability & Resource Efficiency Dashboard template in the Templates section. Use the drag-and-drop editor to adjust KPIs, edit filters, or add elements based on your data.
3. Export to Your BI Tool
Once your dashboard wireframe is ready, use the BI Tool Export feature to send it directly to Power BI or Tableau for further analysis and enhancements. You can also download the dashboard as a PDF, PNG, or JPEG, embed it on a platform, or invite your team to collaborate.
Note: This is a Pro template. You'll need a Pro subscription on Mokkup to use and customize this dashboard wireframe. Upgrade anytime to unlock full access.
Water Treatment and Purification Sustainability & Resource Efficiency Dashboard Example
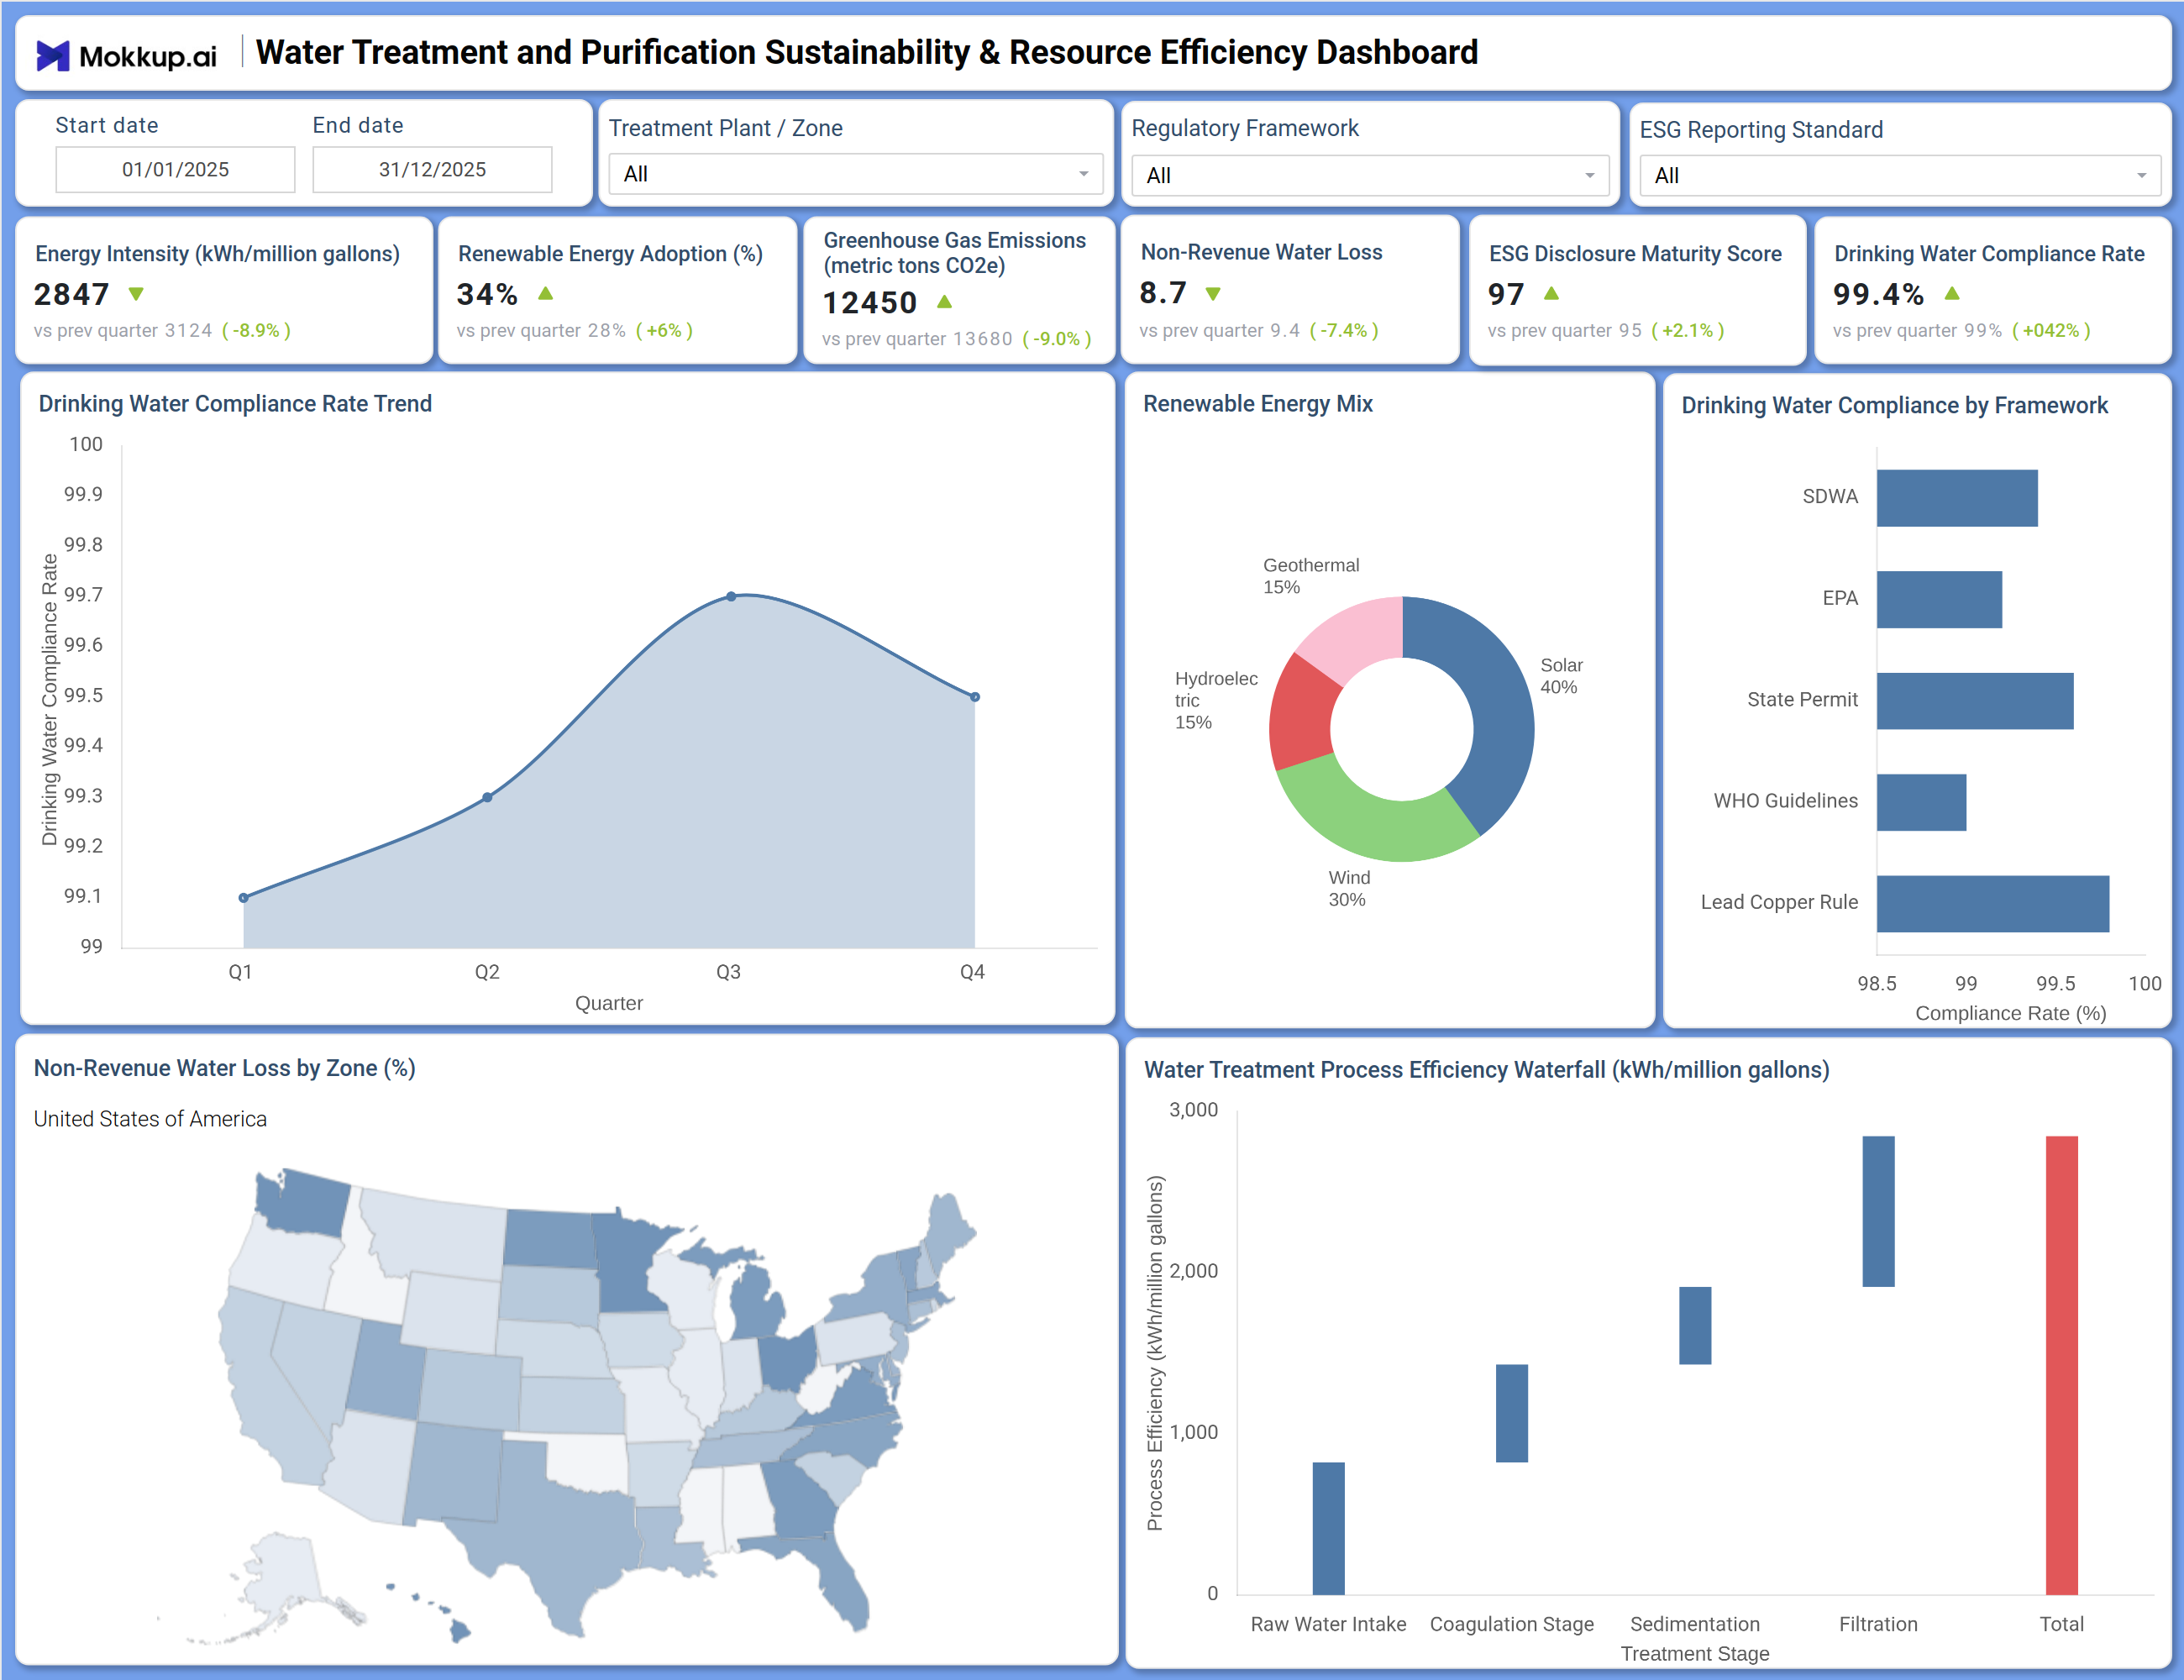
The dashboard is organized into KPI tiles at the top, followed by trend charts, distribution visuals, a geographic map, and a waterfall chart. The top row displays six metric tiles: Energy Intensity, Renewable Energy Adoption, Greenhouse Gas Emissions, Non-Revenue Water Loss, ESG Disclosure Maturity Score, and Drinking Water Compliance Rate. Filters for Start Date, End Date, Treatment Plant or Zone, Regulatory Framework, and ESG Reporting Standard scope the data to specific facilities or time periods. The Drinking Water Compliance Rate Trend line chart tracks quarterly compliance levels.
A donut chart breaks down the Renewable Energy Mix across Solar, Wind, Hydroelectric, and Geothermal, supporting renewable energy adoption water treatment analysis. A horizontal bar chart shows Drinking Water Compliance by Framework for SDWA, EPA, State Permit, WHO Guidelines, and Lead Copper Rule. The US choropleth map visualizes Non-Revenue Water Loss by Zone, functioning as a non-revenue water loss tracking dashboard at the state level. The waterfall chart covers Water Treatment Process Efficiency across Raw Water Intake, Coagulation Stage, Sedimentation Treatment Stage, and Filtration, enabling water purification energy efficiency tracking at each step.
How to Analyze Data in a Water Treatment and Purification Sustainability & Resource Efficiency Dashboard
Here is how you can analyze data from this dashboard:
- Use the Treatment Plant / Zone filter to isolate performance for specific facilities or regions
- Monitor the Drinking Water Compliance Rate Trend chart to detect quarterly drops before they trigger regulatory action
- Review the Renewable Energy Mix donut chart to assess energy source contributions and track renewable energy adoption, water treatment targets
- Use the Drinking Water Compliance by Framework bar chart to identify which standards, such as SDWA or WHO Guidelines, are near non-compliance
- Compare the Non-Revenue Water Loss by Zone map to find states with the highest loss percentages
- Analyze the Process Efficiency Waterfall to identify which treatment stage consumes the most energy, supporting water purification energy efficiency tracking
- Filter by ESG Reporting Standard to align output with specific frameworks for greenhouse gas emissions water treatment monitoring
- Track ESG Disclosure Maturity Score over time to measure progress in ESG reporting water utilities obligations
Benefits of a Water Treatment and Purification Sustainability & Resource Efficiency Dashboard
The following are the benefits of using this dashboard:
- Centralizes energy, compliance, and ESG data across treatment facilities in one structured template
- Supports drinking water compliance rate dashboard monitoring across five regulatory frameworks simultaneously
- Reduces manual data compilation for ESG reporting cycles with pre-built KPI tiles and chart layouts
- Enables zone-level analysis of non-revenue water loss to guide infrastructure decisions
- Provides a waterfall breakdown of energy by treatment stage for operational efficiency planning
- Helps utilities align with multiple ESG frameworks without rebuilding reports from scratch
- Gives plant managers and ESG teams a shared view of sustainability performance
KPIs to Track in a Water Treatment and Purification Sustainability & Resource Efficiency Dashboard
The following key KPIs can be tracked by using this dashboard:
- Energy Intensity (kWh/million gallons): Measures energy consumed per million gallons treated, a core metric for this water treatment sustainability dashboard
- Renewable Energy Adoption (%): Tracks the share of energy sourced from Solar, Wind, Hydroelectric, and Geothermal
- Greenhouse Gas Emissions (metric tons CO2e): Quantifies GHG output from operations, central to greenhouse gas emissions water treatment monitoring
- Non-Revenue Water Loss: Measures treated water lost before reaching end users, key to non-revenue water loss tracking dashboard analysis
- ESG Disclosure Maturity Score: Evaluates the completeness of ESG reporting against recognized standards, supporting ESG reporting water utilities workflows
- Drinking Water Compliance Rate: Tracks the percentage of water output meeting regulatory standards across SDWA, EPA, State Permit, WHO Guidelines, and Lead Copper Rule
Frequently Asked Questions
1. What industries benefit most from this water treatment sustainability dashboard?
Water utilities, municipal water authorities, and environmental compliance teams in the water treatment and purification sector benefit most. ESG analysts tracking resource efficiency across infrastructure assets will also find it useful.
2. Can this dashboard track compliance across multiple regulatory frameworks simultaneously?
Yes. The Drinking Water Compliance by Framework chart displays compliance rates for SDWA, EPA, State Permit, WHO Guidelines, and Lead Copper Rule side by side, enabling monitoring across all frameworks at once.
3. Is this dashboard suitable for ESG reporting water utilities submissions?
Yes. The dashboard includes an ESG Disclosure Maturity Score, Greenhouse Gas Emissions tile, and ESG Reporting Standard filter, aligning it with standard ESG reporting workflows for water utilities.