What is a Water Supply Treatment & Production Performance Dashboard?
A Water Supply Treatment & Production Performance Dashboard is an operational analytics solution used by water utilities to monitor treatment efficiency, production output, water quality compliance, plant utilization, and equipment reliability across water treatment facilities. This dashboard gives operators and plant managers a centralized view of treatment performance and production stability. A water supply treatment and production performance dashboard helps utilities improve operational efficiency, reduce downtime, and maintain regulatory compliance. The dashboard combines production trends, treatment efficiency metrics, equipment performance indicators, downtime analysis, and regional quality monitoring into one platform. Utilities use this solution to optimize treatment processes, improve supply reliability, manage operational risks, and monitor production KPIs. A water treatment production monitoring analytics dashboard also supports capacity planning and operational decision-making across multiple treatment plants and supply zones.
How to Create a Water Supply Treatment & Production Performance Dashboard
You don't need to build your report from scratch, just start with a ready-to-use dashboard template from Mokkup. Add in your data and export it however you like. Here's how to do it:
1. Create or Log in to Your Mokkup Account
Start by signing up on Mokkup.ai using your email. If you already have an account, just log in, and you'll be good to go.
2. Choose and Customize Your Dashboard Template
Find the Water Supply Treatment & Production Performance Dashboard template in the Templates section. Use the drag-and-drop editor to adjust KPIs, edit filters, or add elements based on your data.
3. Export to Your BI Tool
Once your dashboard wireframe is ready, use the BI Tool Export feature to send it directly to Power BI or Tableau for further analysis and enhancements. You can also download the dashboard as a PDF, PNG, or JPEG, embed it on a platform, or invite your team to collaborate.
Note: This is a Pro template. You'll need a Pro subscription on Mokkup to use and customize this dashboard wireframe. Upgrade anytime to unlock full access.
Water Supply Treatment & Production Performance Dashboard Example
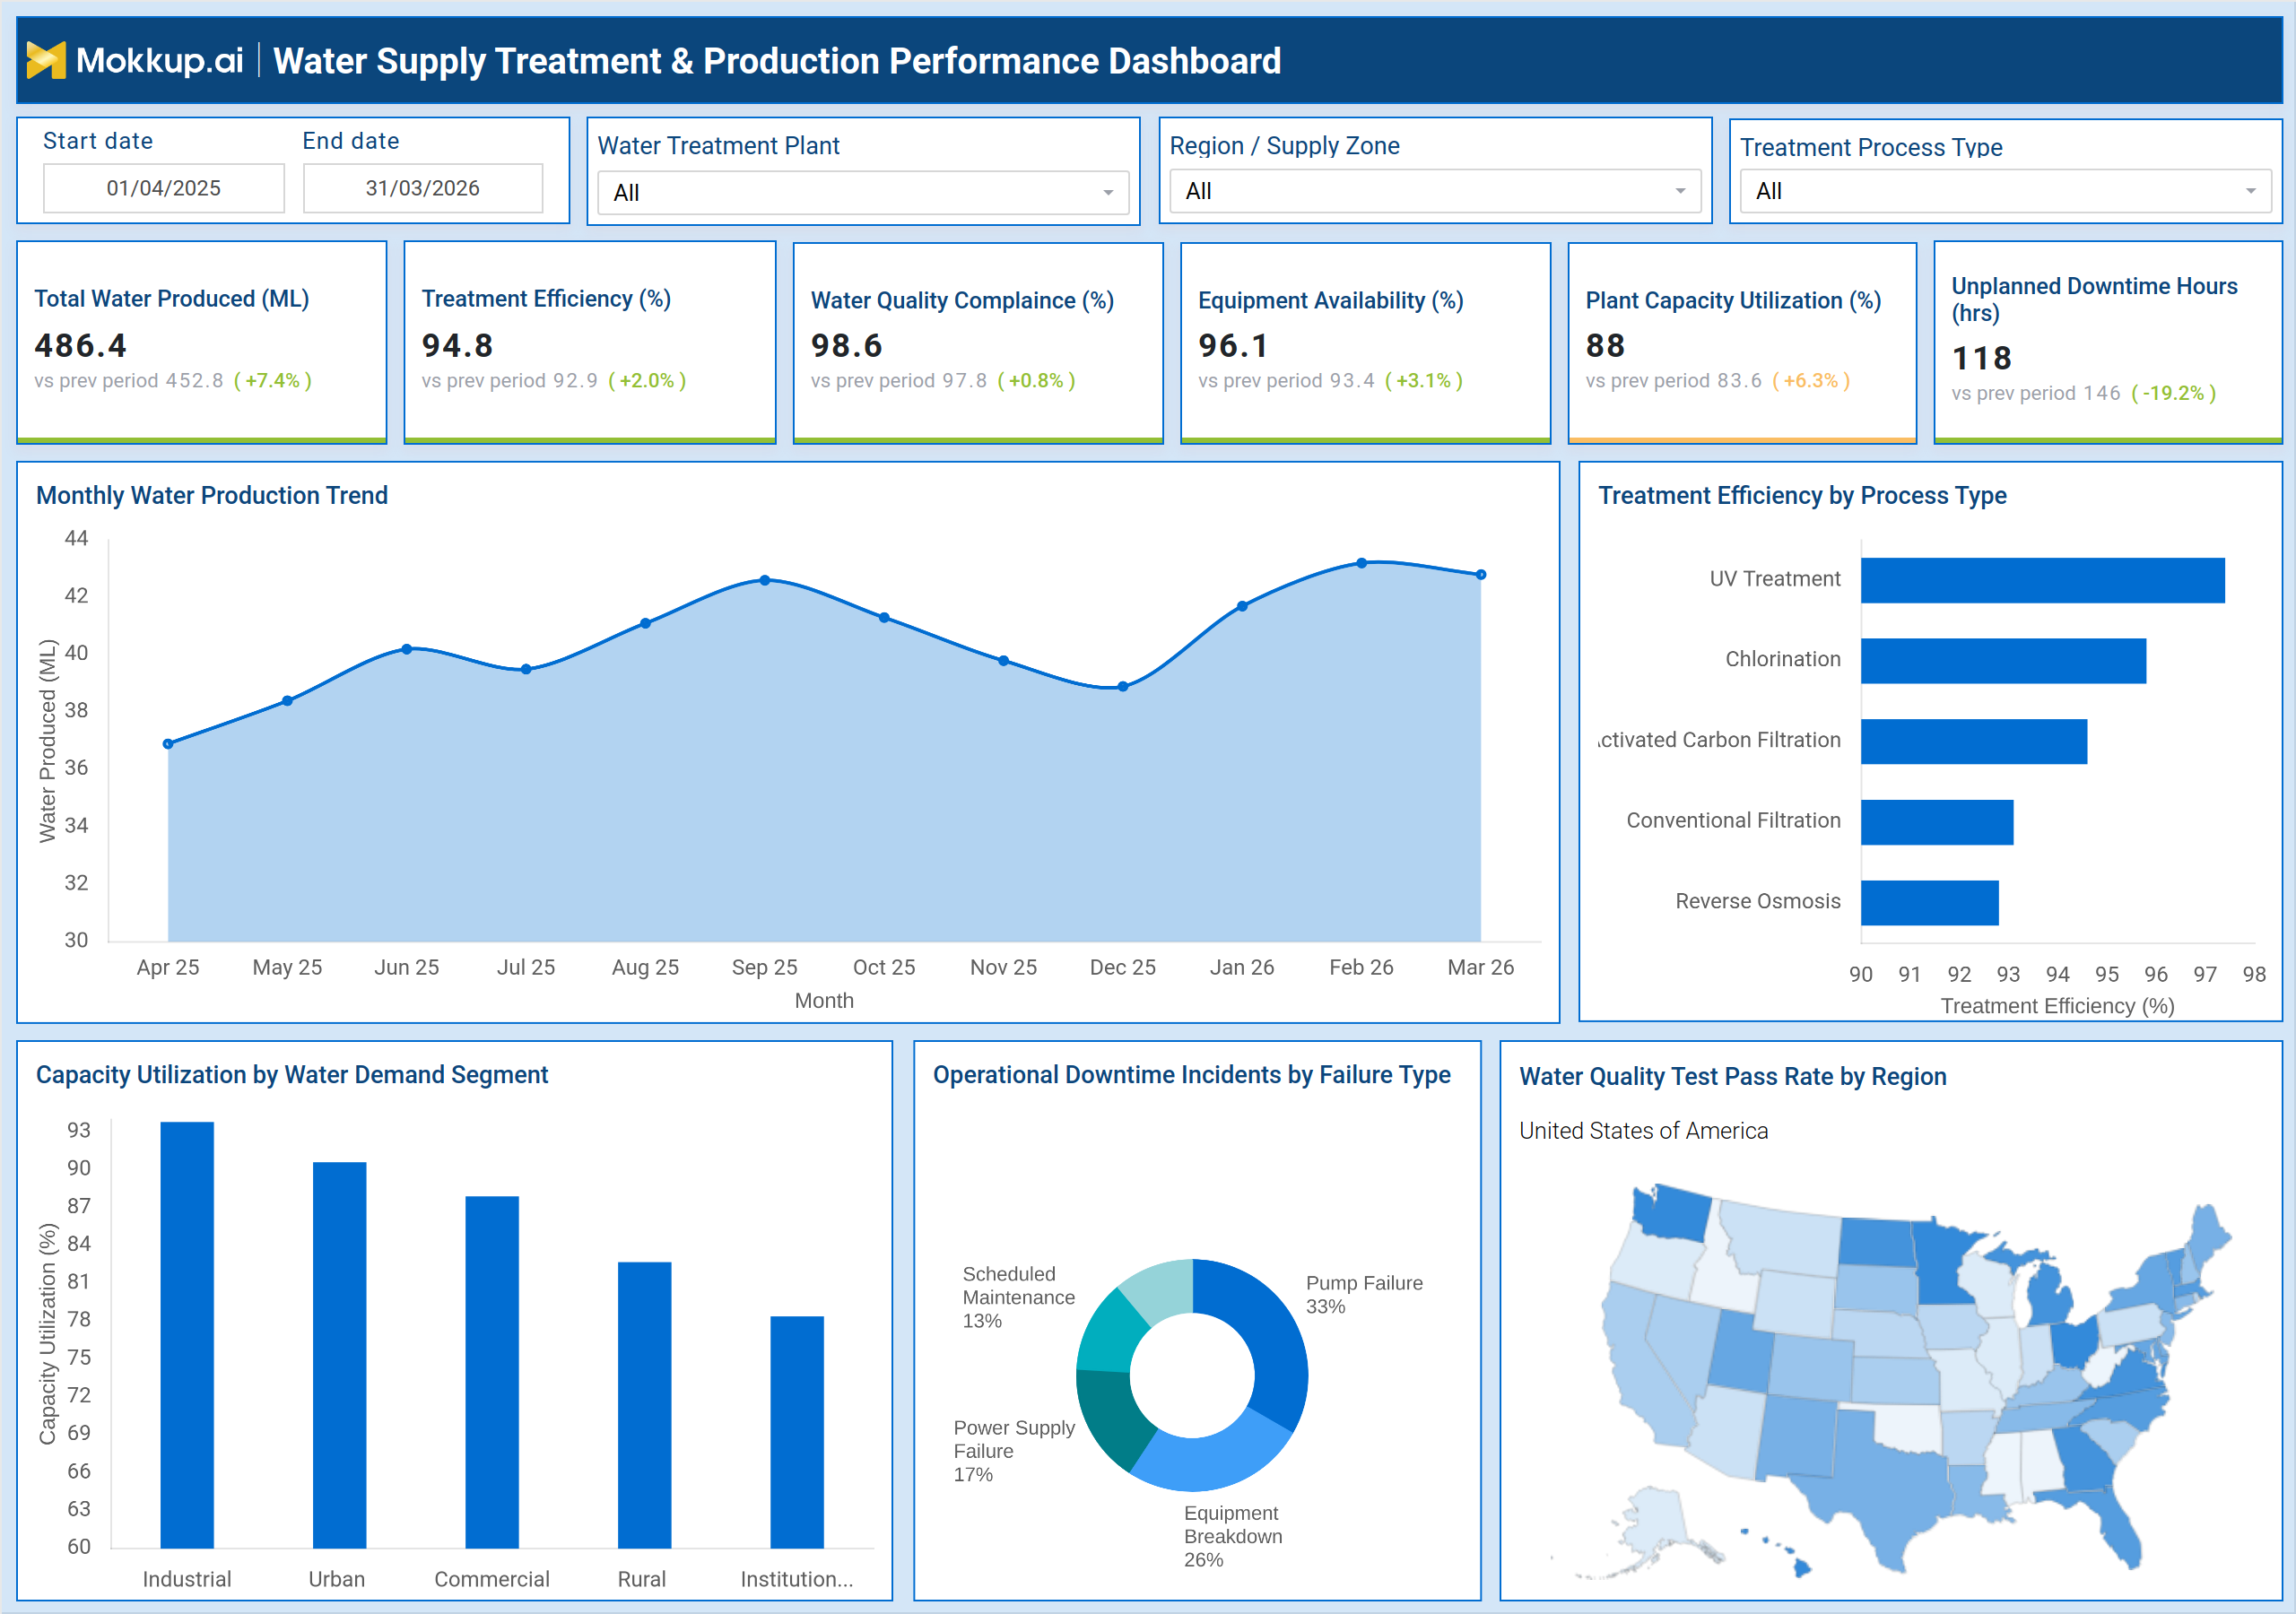
The dashboard example above demonstrates how utilities can track water treatment and production operations across different plants, regions, and process types. The KPI section highlights Total Water Produced (ML), Treatment Efficiency (%), Water Quality Compliance (%), Equipment Availability (%), Plant Capacity Utilization (%), and Unplanned Downtime Hours. These KPIs provide an operational overview of production performance and treatment stability. The Monthly Water Production Trend visual helps utilities analyze production consistency and seasonal output variations over time. The Treatment Efficiency by Process Type chart compares efficiency across UV Treatment, Chlorination, Activated Carbon Filtration, Conventional Filtration, and Reverse Osmosis systems.
This allows operators to identify the most efficient treatment technologies and improve operational planning. The dashboard also includes Capacity Utilization by Water Demand Segment to evaluate how industrial, urban, commercial, rural, and institutional demand impacts treatment operations. The Operational Downtime Incidents by Failure Type visual categorizes downtime causes such as pump failure, equipment breakdown, power supply failure, and scheduled maintenance. Regional water quality test pass rate monitoring helps utilities identify geographic performance gaps and maintain compliance standards. This water supply production efficiency performance dashboard improves operational visibility, treatment optimization, and water quality management.
How to Analyze Data in Water Supply Treatment & Production Performance Dashboard
Here is how you can analyze data from this dashboard:
- Monitor Total Water Produced (ML): Evaluate treatment plant production capacity and track overall water output trends across operations.
- Analyze Treatment Efficiency (%): Compare treatment performance across different process types to identify optimization opportunities and improve operational efficiency.
- Track Water Quality Compliance (%): Monitor compliance rates to ensure water quality consistently meets regulatory and safety standards.
- Review Equipment Availability (%): Assess equipment reliability and operational readiness to minimize disruptions and improve plant performance.
- Compare Plant Capacity Utilization (%): Evaluate resource utilization efficiency across supply zones by analyzing plant capacity usage levels.
- Analyze Unplanned Downtime Hours: Identify operational disruptions and maintenance issues by tracking unexpected downtime incidents.
- Review Monthly Production Trends: Analyze seasonal demand fluctuations and production consistency through monthly output tracking.
- Compare Treatment Efficiency Across Technologies: Evaluate filtration and purification technologies to identify the most effective treatment processes.
- Analyze Downtime Incidents by Failure Type: Identify root causes of operational disruptions by categorizing downtime incidents based on equipment or process failures.
- Monitor Regional Water Quality Test Pass Rates: Track geographic compliance performance to identify regions with elevated water quality risks or regulatory concerns.
Benefits of Water Supply Treatment & Production Performance Dashboard
The following are the benefits of using this dashboard:
- Improves Visibility into Treatment Operations: Provides comprehensive insights into water treatment and production activities for better operational monitoring and control.
- Optimizes Treatment Efficiency and Output: Helps utilities improve treatment performance and maximize production capacity across facilities.
- Supports Proactive Downtime Monitoring: Tracks operational disruptions and equipment reliability to reduce unexpected downtime and improve readiness.
- Improves Water Quality Compliance Management: Simplifies compliance tracking and reporting to ensure adherence to water quality and regulatory standards.
- Enhances Treatment Process Optimization: Compares purification and filtration methods to identify the most efficient treatment processes.
- Supports Capacity Planning and Demand Management: Helps utilities align production capacity with supply and demand requirements more effectively.
- Reduces Operational Disruptions: Enables faster identification and resolution of operational incidents through improved monitoring capabilities.
- Improves Maintenance Planning: Uses downtime analytics and equipment performance data to support proactive maintenance strategies.
- Maintains Consistent Water Supply Performance: Helps utilities ensure stable and reliable water production and distribution operations.
- Enables Data-Driven Decision-Making: Provides actionable operational and production insights to support smarter planning and management decisions.
KPIs to Track in Water Supply Treatment & Production Performance Dashboard
The following key KPIs can be tracked by using this dashboard:
- Total Water Produced (ML): Measures total treated water output across treatment facilities.
- Treatment Efficiency (%): Tracks operational efficiency of water treatment processes.
- Water Quality Compliance (%): Measures compliance with water quality and regulatory standards.
- Equipment Availability (%): Tracks operational availability and reliability of treatment equipment.
- Plant Capacity Utilization (%): Measures utilization of plant production capacity.
- Unplanned Downtime Hours (hrs): Tracks operational downtime caused by failures or disruptions.
Frequently Asked Questions
1. Why is a water supply treatment performance dashboard important?
A water treatment production and compliance dashboard helps utilities monitor production output, treatment efficiency, equipment reliability, and water quality performance.
2. What operational areas does this dashboard monitor?
The dashboard monitors water production, treatment efficiency, compliance performance, equipment availability, plant utilization, and downtime incidents.
3. How does the dashboard improve treatment efficiency?
It compares treatment process performance across multiple purification technologies and identifies operational bottlenecks affecting efficiency.