
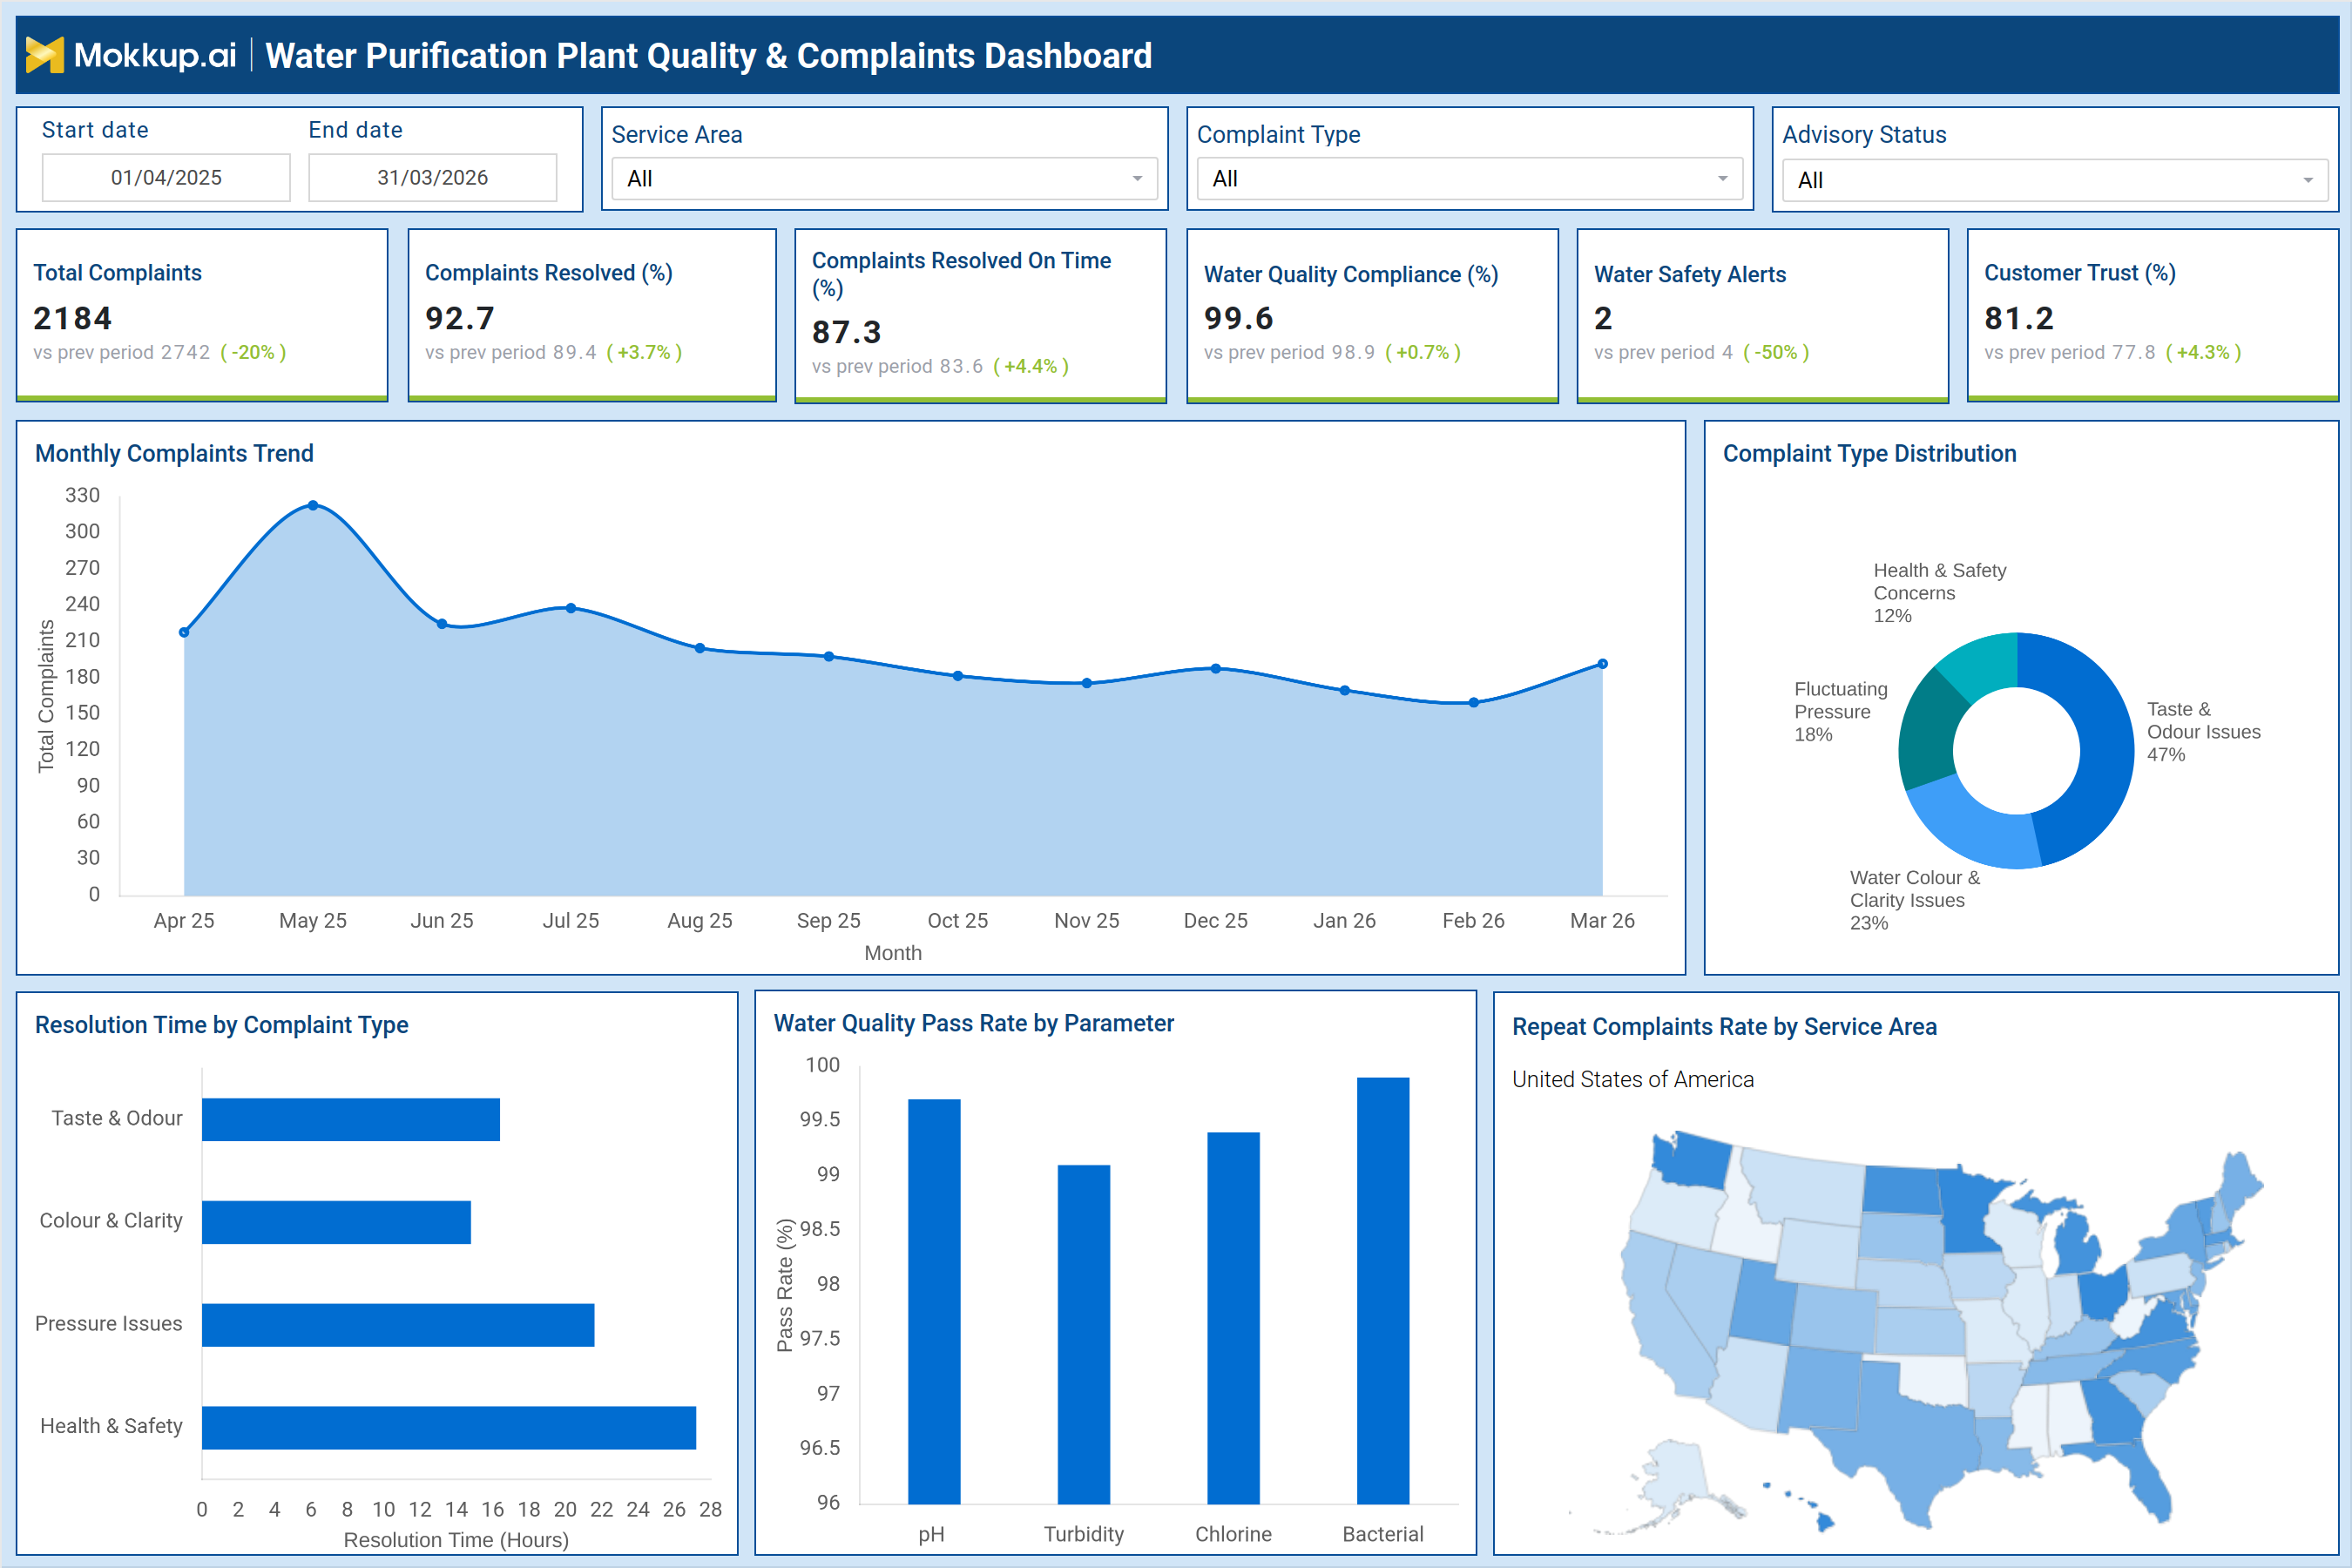
What is a Water Purification Plant Quality & Complaints Dashboard?
The Water Purification Plant Quality & Complaints Dashboard is a structured monitoring tool built for water utility managers, plant supervisors, and public service teams responsible for maintaining drinking water standards and community trust. It consolidates complaint tracking, resolution performance, and water quality parameter data into a single view, giving teams full visibility over operational health without switching between multiple reports. Built as a wireframe template on Mokkup, this dashboard supports teams that need to oversee complaint volume trends, measure how efficiently complaints are being resolved, and verify that water quality compliance is being maintained across service areas.
The Water purification plant complaint tracking dashboard addresses a common challenge in water utility operations: the gap between complaint data and water quality data is often large, leading to delayed decisions and missed signals. By bringing both into one place, the Water Purification Plant Complaints & Water Quality Dashboard enables teams to act on complaint patterns before they escalate into service advisories or public safety concerns. Whether the goal is reducing repeat complaints in specific service areas or improving on-time resolution rates, this water quality monitoring dashboard gives managers the visibility to act with precision. Teams tracking water safety alerts alongside customer trust levels gain a clear picture of how operational decisions directly affect public perception and service reliability.
How to Create a Water Purification Plant Quality & Complaints Dashboard
You don’t need to build your report from scratch, just start with a ready-to-use dashboard template from Mokkup. Add in your data and export it however you like. Here’s how to do it:
1. Create or Log in to Your Mokkup Account
Start by signing up on Mokkup.ai using your email. If you already have an account, just log in, and you'll be good to go.
2. Choose and Customize Your Dashboard Template
Find the Water Purification Plant Quality & Complaints Dashboard in the Templates section. Use the drag-and-drop editor to adjust KPIs, edit filters, or add elements based on your data.
3. Export to Your BI Tool
Once your dashboard wireframe is ready, use the BI Tool Export feature to send it directly to Power BI or Tableau for further analysis and enhancements. You can also download the dashboard as a PDF, PNG, or JPEG, embed it on a platform, or invite your team to collaborate.
Note: This is a Pro template. You'll need a Pro subscription on Mokkup to use and customize this dashboard wireframe. Upgrade anytime to unlock full access.
Water Purification Plant Quality & Complaints Dashboard Example
A water utility operations team can open this Water quality compliance monitoring dashboard at the start of each week to understand whether complaint volume is trending upward or holding steady, and whether their resolution teams are keeping pace. Rather than pulling separate reports from their CRM and water testing logs, managers view complaint trends alongside water quality compliance data in one screen. If a spike in the Monthly Complaints Trend catches their attention, they can immediately check the Complaint Type Distribution to understand whether the volume is driven by taste and odour issues, pressure fluctuations, or something more serious like health and safety concerns. Resolution teams use the dashboard to prioritize their workloads based on how different complaint types are performing. The Resolution Time by Complaint Type view lets supervisors identify which categories are taking the longest to close. If health and safety complaints are exceeding acceptable resolution windows, team leads can reallocate resources before the backlog deepens.
The on-time resolution rate KPI gives management a single number to hold teams accountable to, while the total complaints count provides the denominator for understanding workload. Water quality managers focus on the Water Quality Pass Rate by Parameter chart to verify that pH, turbidity, chlorine, and bacterial readings are within acceptable thresholds. When one parameter dips, the team investigates whether a pattern of repeat complaints from that service area correlates with the quality reading. The Repeat Complaints Rate by Service Area map overlays complaint frequency geographically, helping planners identify whether specific regions are generating disproportionate complaint volume, which often points to localized infrastructure or treatment issues. Across all teams, the dashboard turns fragmented data into a shared operational picture. Customer trust scores are tracked alongside water safety alerts so leadership can monitor how public confidence responds to service quality changes over time. Teams can correlate dips in customer trust with complaint spikes, build a case for process improvements, and track progress toward resolution targets, all without leaving a single screen.
How to Analyze Data in a Water Purification Plant Quality & Complaints Dashboard
Here is how you can analyze data from this Water Safety Alert dashboard:
- Filter by Service Area and Complaint Type to isolate issues within specific geographic zones or categories
- Use the Monthly Complaints Trend to detect seasonal patterns and compare periods using date range filters
- Cross-reference the Complaint Type Distribution with Resolution Time by Complaint Type to identify which complaint categories are both frequent and slow to resolve
- Track Water Quality Pass Rate by Parameter to verify whether quality dips correlate with complaint spikes in the same period
- Monitor Repeat Complaints Rate by Service Area on the map to identify locations generating persistent complaint volume
- Apply the Advisory Status filter to analyze complaints logged during active water safety advisories
- Compare Complaints Resolved (%) against Complaints Resolved On Time (%) to assess not just resolution volume but resolution efficiency
Benefits of a Water Purification Plant Quality & Complaints Dashboard
The following are the benefits of using this dashboard:
- Centralizes complaint tracking and water quality compliance data into one view, eliminating the need to reconcile multiple reports
- Enables operations teams to identify which complaint types are driving the highest volume and longest resolution times
- Provides geographic visibility into repeat complaint patterns through a service area map, supporting targeted infrastructure responses
- Helps management monitor customer trust trends alongside water safety alert counts to understand how operational performance affects public perception
- Supports faster decision-making by presenting KPIs with period-over-period comparisons in a single complaint resolution dashboard
- Reduces the risk of missed escalations by surfacing water safety alerts as a dedicated metric alongside overall quality compliance
KPIs to Track in a Water Purification Plant Quality & Complaints Dashboard
The following key KPIs can be tracked by using this dashboard:
- Total Complaints: Measures the overall volume of complaints received within the selected period, establishing the baseline for all resolution and performance metrics in the water purification complaint tracking workflow
- Complaints Resolved (%): Tracks the percentage of logged complaints that have been closed, indicating how effectively the resolution team is working through its workload
- Complaints Resolved On Time (%): Measures the share of complaints closed within the agreed service window, reflecting resolution efficiency and team responsiveness
- Water Quality Compliance (%): Tracks the proportion of water quality tests that meet regulatory standards, serving as the primary indicator of treatment plant performance
- Water Safety Alerts: Counts the number of active safety advisories in the selected period, providing an early warning signal for potential public health concerns and informing the complaint context
- Customer Trust (%): Measures public confidence in the water utility service, a composite metric that reflects how resolution performance and water quality standards translate into community satisfaction
Frequently Asked Questions
1. What types of complaints does this dashboard track?
The dashboard captures all complaint categories visible in the Complaint Type Distribution, including taste and odour issues, water colour and clarity problems, pressure fluctuations, and health and safety concerns. Teams can filter by complaint type to isolate any single category for deeper analysis.
2. Can this dashboard be filtered by specific service areas?
Yes. The Service Area filter allows teams to narrow the view to a specific geographic zone. The Repeat Complaints Rate by Service Area map also provides a visual breakdown of complaint concentration across regions, supporting targeted operational responses.
3. How does this dashboard help improve customer trust over time?
By tracking customer trust as a dedicated KPI alongside resolution rates and water quality compliance, teams can identify correlations between service performance and public confidence. As complaint resolution efficiency improves and water quality standards are consistently met, the customer trust metric reflects those gains providing a feedback loop that connects operational decisions to community perception.