
What is a Water Recycling Supply Chain Reuse Chemicals & Consumables Dashboard?
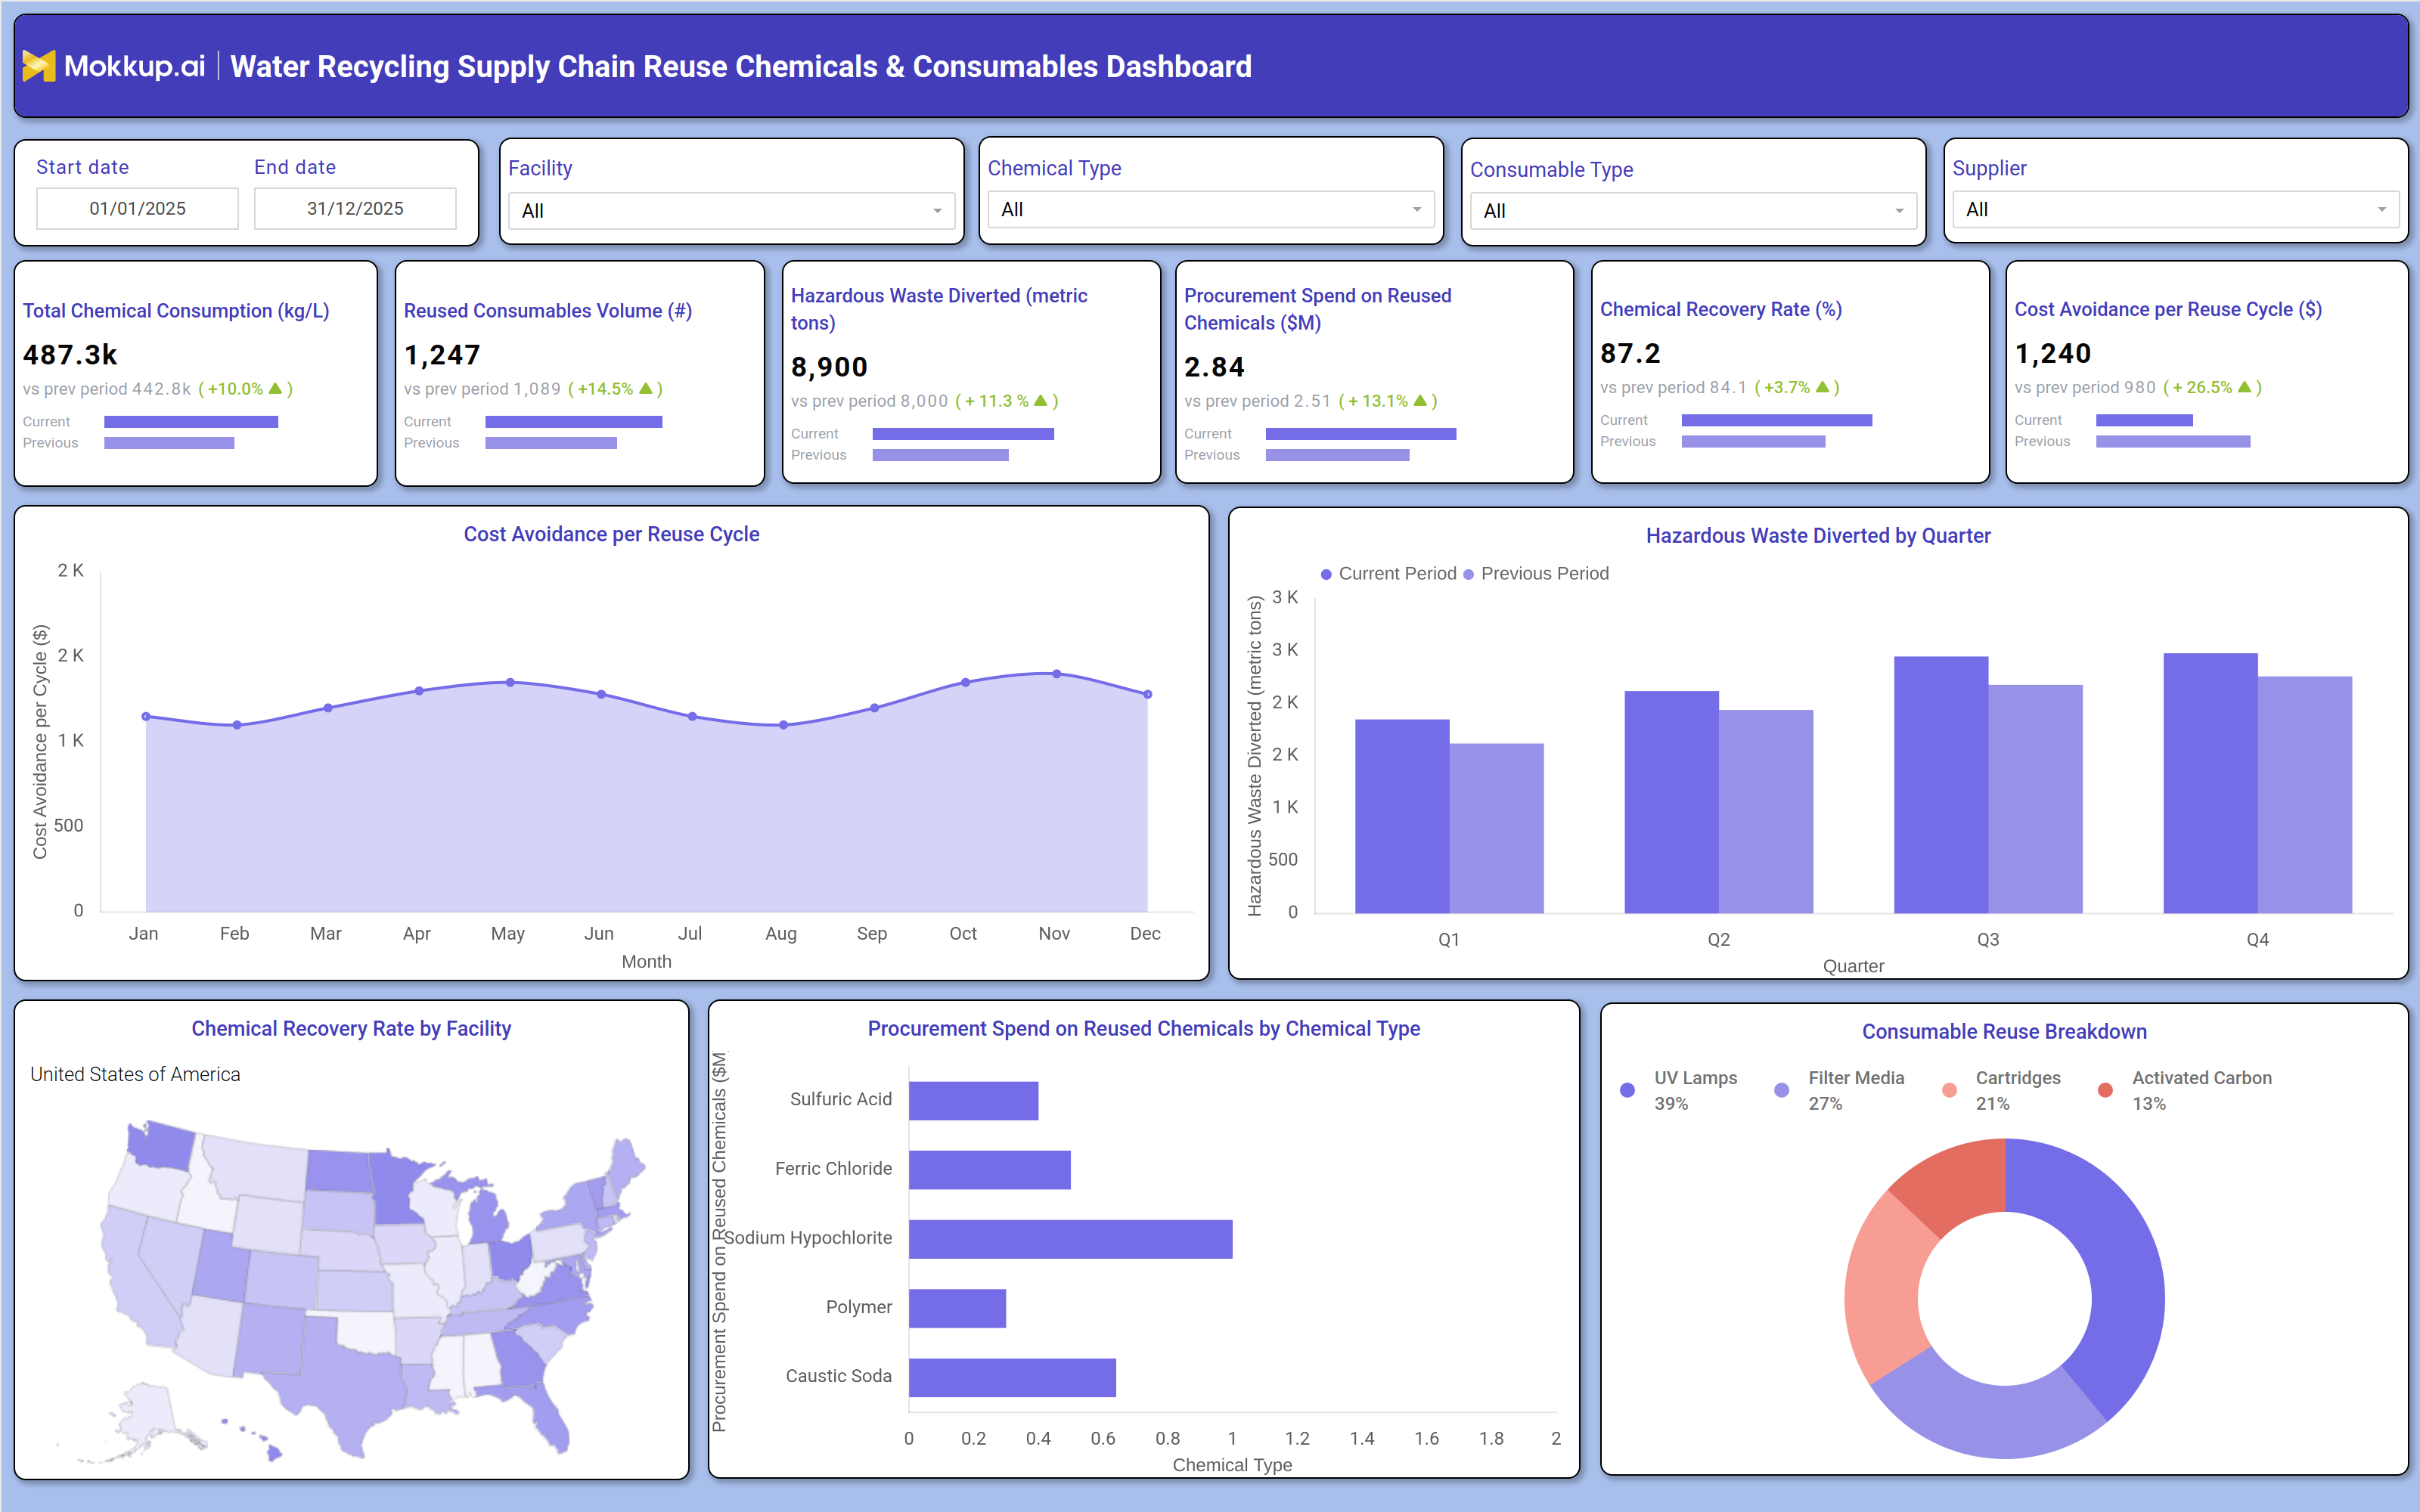
The Water Recycling Supply Chain Reuse Chemicals & Consumables Dashboard is a purpose-built analytics tool designed for water utility procurement teams, sustainability managers, and supply chain leads who need to track the performance of chemical reuse and consumable recycling programs. It consolidates procurement, consumption, recovery, and waste diversion data into a single, structured view that supports data-driven decisions across facilities and suppliers. At its core, this dashboard focuses on the economics and environmental impact of reusing treatment chemicals and consumable components in water recycling operations. Teams monitoring water recycling supply chain chemical management can use it to assess how much chemical consumption costs are being offset by reuse initiatives, which consumable categories contribute most to reuse volume, and where procurement spend on reused chemicals is concentrated across different chemical types. By presenting both current and prior period figures for every key metric, the dashboard gives operations and sustainability teams a clear picture of performance trends. Whether the goal is reducing hazardous waste diversion gaps, tracking chemical recovery rates across facilities, or optimizing procurement spend on reused materials, this dashboard brings all relevant signals into one place.
How to Create a Water Recycling Supply Chain Reuse Chemicals & Consumables Dashboard
You don't need to build your report from scratch, just start with a ready-to-use dashboard template from Mokkup. Add in your data and export it however you like. Here's how to do it:
1. Create or Log in to Your Mokkup Account
Start by signing up on Mokkup.ai using your email. If you already have an account, just log in, and you'll be good to go.
2. Choose and Customize Your Dashboard Template
Find the Water Recycling Supply Chain Reuse Chemicals & Consumables Dashboard template in the Templates section. Use the drag-and-drop editor to adjust KPIs, edit filters, or add elements based on your data.
3. Export to Your BI Tool
Once your dashboard wireframe is ready, use the BI Tool Export feature to send it directly to Power BI or Tableau for further analysis and enhancements. You can also download the dashboard as a PDF, PNG, or JPEG, embed it on a platform, or invite your team to collaborate.
Note: This is a Pro template. You'll need a Pro subscription on Mokkup to use and customize this dashboard wireframe. Upgrade anytime to unlock full access.
Water Recycling Supply Chain Reuse Chemicals & Consumables Dashboard Example
A procurement manager at a regional water recycling authority opens this dashboard at the start of a quarterly review. The question on the table: has the chemical reuse program delivered measurable cost and compliance benefits compared to the previous period? Rather than compiling data from separate procurement, lab, and waste management systems, the manager uses this dashboard to get a consolidated picture in minutes. From the KPI cards alone, teams can identify whether chemical consumption has shifted relative to volume treated, whether the chemical recovery rate across facilities is trending in the right direction, and whether cost avoidance per reuse cycle is holding steady or improving. Supply chain analysts can compare procurement spend on reused chemicals by chemical type to determine which treatment agents are driving the bulk of sourcing activity. Sustainability leads can track hazardous waste diversion quarter over quarter and identify whether the program is consistently keeping waste volumes out of disposal streams. The consumable reuse breakdown gives operations teams a clear view of how different categories contribute to overall reuse volume. Planners can compare regional chemical recovery rates using the facility-level map to prioritize underperforming sites for process improvements or supplier reassessment. By filtering on facility, chemical type, consumable type, or supplier, teams can isolate exactly the segment they need without rebuilding the view from scratch. The overall outcome this dashboard supports is accountability and continuous improvement in sustainable procurement. By tracking reuse chemical supply chain performance metrics across the full cycle, teams can demonstrate the financial and environmental returns of their reuse programs and make the case for scaling them further.
How to Analyze Data in a Water Recycling Supply Chain Reuse Chemicals & Consumables Dashboard
Here is how you can analyze data from this chemical recovery rate water treatment analytics dashboard:
- Compare performance over time: Use the date range filter to compare current and previous period performance across all KPIs.
- Analyze facility-level metrics: Filter by Facility to isolate chemical recovery rates and procurement spend for a specific site.
- Evaluate chemical spending: Filter by Chemical Type to assess spend concentration on individual treatment chemicals.
- Track consumable reuse: Filter by Consumable Type to see which reuse categories are growing or declining.
- Assess supplier impact: Filter by Supplier to evaluate vendor contribution to reuse volume and cost avoidance.
- Monitor cost avoidance trends: Review the Cost Avoidance per Reuse Cycle trend line to identify seasonal dips or months of improvement.
- Compare waste diversion performance: Use the Hazardous Waste Diverted by Quarter chart to analyze year-over-year diversion trends.
- Identify high-cost chemicals: Analyze the Procurement Spend by Chemical Type bar chart to pinpoint the most expensive chemical categories.
- Understand reuse distribution: Use the Consumable Reuse Breakdown donut chart to view the share of each consumable category.
- Spot regional performance gaps: Reference the Chemical Recovery Rate by Facility map to identify underperforming locations.
Benefits of a Water Recycling Supply Chain Reuse Chemicals & Consumables Dashboard
The following are the benefits of using this procurement spend on reused chemicals tracking dashboard:
- Centralize operational data: Consolidate procurement, recovery, and waste data into a single view for faster decision-making.
- Measure financial impact: Track cost avoidance per reuse cycle to quantify savings from sustainability initiatives.
- Compare performance over time: Analyze period-over-period changes across every KPI without manual calculations.
- Simplify ESG reporting: Monitor hazardous waste diversion and chemical recovery metrics to support sustainability reporting.
- Optimize supplier performance: Evaluate suppliers based on their contribution to reuse volume and procurement spend.
- Reduce manual reporting: Centralize chemical and consumable performance data instead of relying on multiple source systems.
- Improve facility operations: View recovery rates by region to identify sites that need operational improvements.
- Support compliance monitoring: Track reuse consumable volumes and chemical handling metrics to meet regulatory requirements.
KPIs to Track in a Water Recycling Supply Chain Reuse Chemicals & Consumables Dashboard
The following key KPIs can be tracked by using this water recycling supply chain chemical reuse dashboard:
- Total Chemical Consumption (kg/L): Total volume of treatment chemicals consumed per unit of water processed during the selected period.
- Reused Consumables Volume (count): Count of consumable components such as filters, cartridges, and UV lamps that were reused rather than disposed of.
- Hazardous Waste Diverted (metric tons): Total mass of hazardous waste kept out of disposal streams as a result of reuse and recovery activities.
- Procurement Spend on Reused Chemicals ($M): Total sourcing expenditure allocated to reused or recycled chemical inputs during the period.
- Chemical Recovery Rate (%): Percentage of consumed chemicals successfully recovered and returned to the treatment cycle.
- Cost Avoidance per Reuse Cycle ($): Dollar value of costs avoided per cycle by substituting reused chemicals and consumables for new purchases.
Frequently Asked Questions
1. What types of organizations benefit most from this dashboard?
Water utilities, municipal recycling authorities, and industrial water treatment operators with active chemical reuse or circular procurement programs benefit most. It is especially useful for teams that need to demonstrate both cost savings and environmental performance to leadership or regulators.
2. Can this dashboard be filtered by specific suppliers or chemical types?
Yes. The dashboard includes dedicated filters for Supplier, Chemical Type, Consumable Type, and Facility, allowing teams to drill into any specific segment without rebuilding the view. This makes it suitable for supplier performance reviews and category-level procurement analysis.
3. How does this dashboard support sustainability reporting?
The hazardous waste diversion and chemical recovery rate KPIs, combined with period-over-period comparisons, provide the documented metrics commonly required for ESG disclosures and environmental compliance reporting. Teams monitoring water recycling supply chain chemical management can export this data directly into reporting workflows.