What is an Oil Power Plant Petroleum Waste & Residue Management Dashboard?
A petroleum waste management dashboard is a centralized digital system used to track, analyze, and control waste and residue generated across petroleum refining and processing operations. It consolidates key indicators related to oily water, sludge, tank bottoms, spent filters, treatment efficiency, storage utilization, spill incidents, and regulatory compliance into a single operational view. By providing real-time petroleum waste monitoring, the dashboard supports refinery operations teams, environmental managers, compliance officers, and ESG leadership.
It functions as a comprehensive oil and gas waste tracking system, ensuring that waste streams are handled, treated, and disposed of in accordance with environmental regulations and corporate sustainability goals. The dashboard also serves as a petroleum residue management dashboard, enabling continuous oversight of treatment performance, disposal routing, and environmental risk exposure. It is essential for ESG reporting, regulatory audits, environmental incident prevention, and maintaining responsible refinery operations across plant units
How to Create an Oil Power Plant Petroleum Waste & Residue Management Dashboard Template
You don’t need to build your report from scratch, just start with a ready-to-use dashboard template from Mokkup. Add in your data and export it however you like. Here’s how to do it:
1. Create or Log in to Your Mokkup Account
Start by signing up on Mokkup.ai using your email. If you already have an account, just log in, and you’ll be good to go.
2. Choose and Customize Your Dashboard Template
Find the Oil Power Plant Petroleum Waste & Residue Management Dashboard template in the Templates section. Use the drag-and-drop editor to adjust KPIs, edit filters, or add elements based on your data.
3. Export to Your BI Tool
Once your dashboard wireframe is ready, use the BI Tool Export feature to send it directly to Power BI or Tableau for further analysis and enhancements. You can also download the dashboard as a PDF, PNG, or JPEG, embed it on a platform, or invite your team to collaborate.
Note: This is a Pro template. You’ll need a Pro subscription on Mokkup to use and customize this dashboard wireframe. Upgrade anytime to unlock full access.
Oil Power Plant Petroleum Waste & Residue Management Dashboard Example
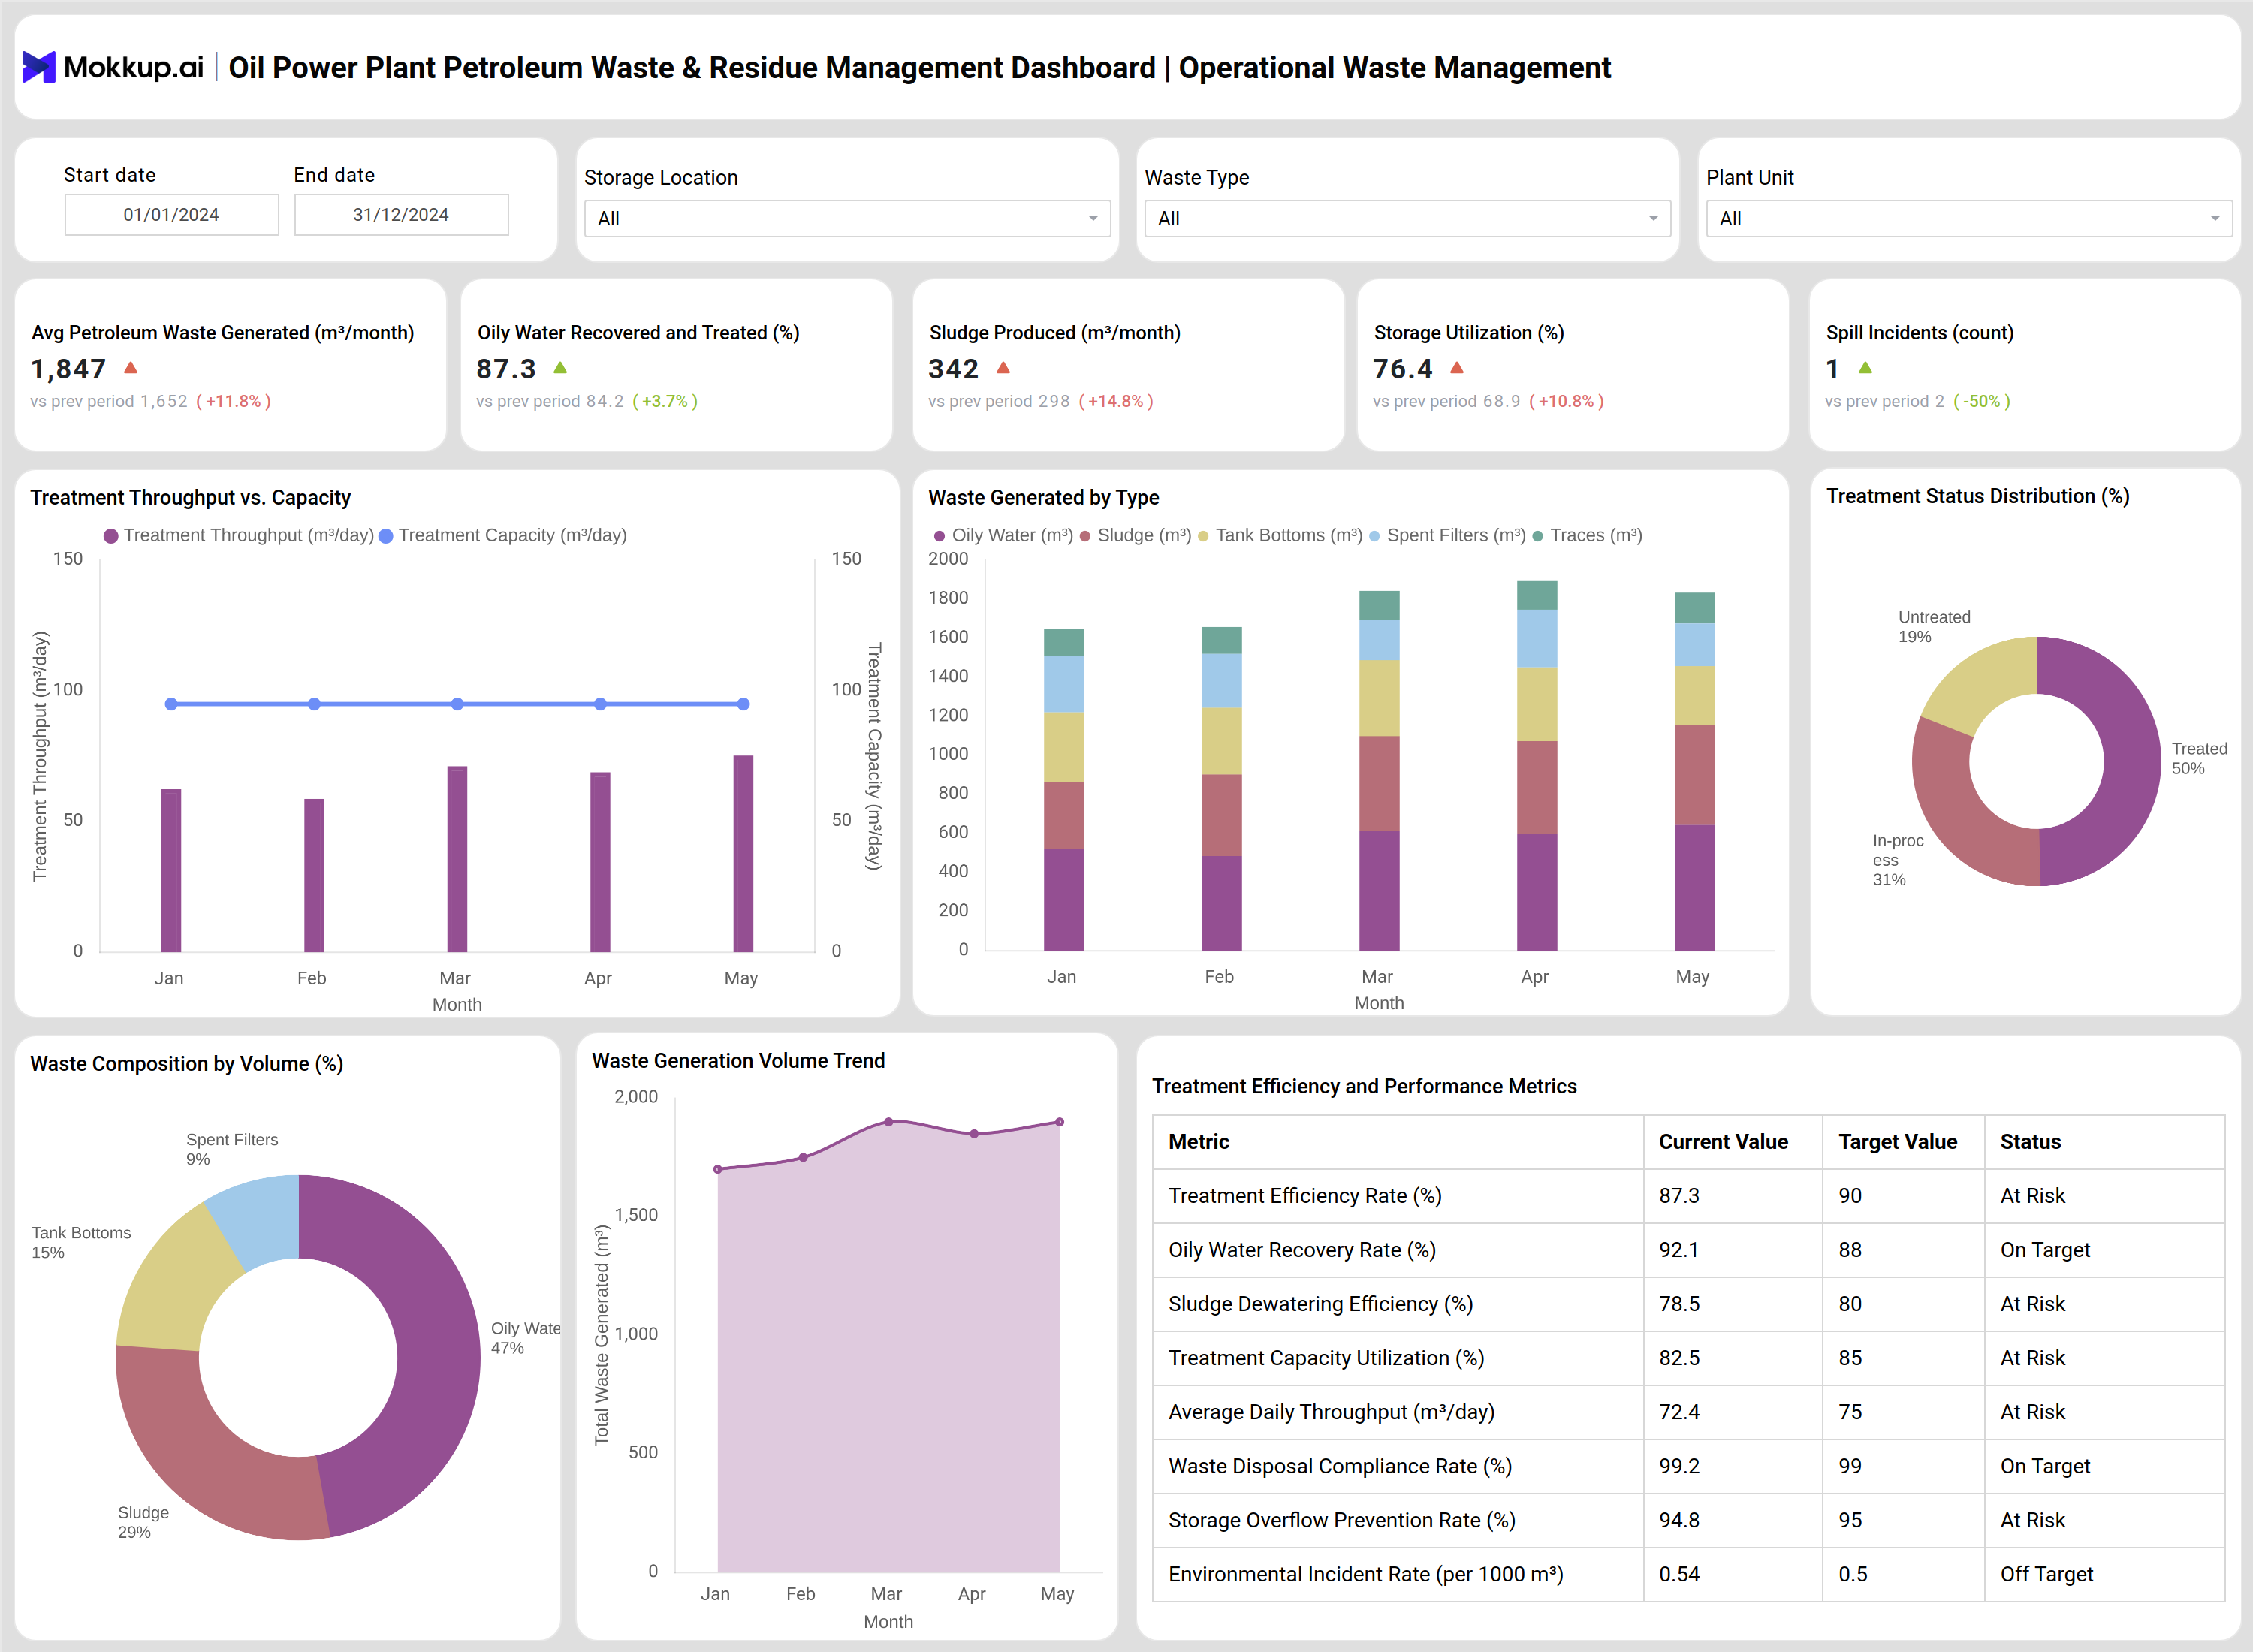
You can create an Oil Power Plant Petroleum Waste & Residue Management Dashboard using the operational and compliance modules shown in the reference images. A typical dashboard is divided into two primary sections: Operational Waste Management and Treatment, Disposal & Compliance. The Operational Waste Management section provides a high-level view of waste generation and handling performance. It displays metrics such as average petroleum waste generated per month, oily water recovered and treated, sludge produced, storage utilization, and spill incident counts. These indicators help operators understand whether waste volumes and storage levels remain within safe operational limits.
Visual components, such as treatment throughput versus capacity charts, show how effectively waste treatment units are being utilized. Waste generated by type charts breaks down oily water, sludge, tank bottoms, spent filters, and other residue streams, supporting accurate waste source analysis. Waste composition charts and generation volume trends help identify dominant waste contributors and rising generation patterns that may signal upstream process inefficiencies.
The Treatment, Disposal & Compliance section expands the analytical view by focusing on treatment quality, regulatory compliance, and downstream disposal. It tracks treatment efficiency, oil and grease levels in discharge, total petroleum hydrocarbons (TPH) in effluent, sludge dewatering efficiency, and recovered oil yield. Compliance charts compare measured discharge values against regulatory limits, enabling teams to quickly identify any exceedances. Additional modules, such as disposal route allocation, vendor performance scores, and regulatory exceedance logs, provide transparency and traceability across waste handling partners. Together, these modules form a complete refinery waste management dashboard that supports ESG compliance, risk mitigation, and data-driven environmental decision-making.
How to Analyze Data in an Oil Power Plant Petroleum Waste & Residue Management Dashboard
Here is how you can analyze data from this dashboard:
- Gauge Waste Generation Trends: Review total waste volumes to identify abnormal increases or seasonal patterns.
- Track Treatment Performance: Analyze treatment efficiency and throughput to ensure treatment units operate within design limits.
- Monitor Oily Water Recovery: Evaluate recovery rates to assess separation efficiency and reuse potential.
- Assess Storage Risk: Track storage utilization to prevent overflow and environmental incidents.
- Review Waste Composition: Identify dominant waste streams for targeted reduction strategies.
- Check Regulatory Compliance: Compare discharge parameters against regulatory limits to detect exceedances early.
- Evaluate Disposal Routes: Analyze disposal allocation to ensure environmentally preferred handling methods are used.
- Inspect Vendor Performance: Review disposal vendor scores to maintain accountability and service quality.
Benefits of an Oil Power Plant Petroleum Waste & Residue Management Dashboard
The following are the benefits of using this dashboard:
- Enhances real-time visibility into refinery waste generation and handling.
- Improves ESG compliance through centralized environmental reporting.
- Reduces environmental risk by identifying treatment and storage issues early.
- Strengthens waste treatment performance and capacity planning.
- Supports responsible disposal through a transparent route and vendor tracking.
- Simplifies regulatory audits with accurate compliance records.
- Enables data-driven waste reduction initiatives.
- Improves environmental governance across refinery operations.
KPIs to Track in a Oil Power Plant Petroleum Waste & Residue Management Dashboard
The following key KPIs can be tracked by using this dashboard:
- Average Petroleum Waste Generated (m³/month): Measures the average volume of petroleum waste produced by refinery operations each month.
- Oily Water Recovered and Treated (%): Indicates the percentage of oily water successfully recovered and treated for safe discharge or reuse.
- Sludge Produced (m³/month): Tracks the monthly volume of sludge generated during petroleum processing and treatment.
- Treatment Throughput vs Capacity (%): Compares actual waste treatment throughput against the maximum installed treatment capacity.
- Storage Utilization (%): Shows the percentage of waste storage capacity currently in use across storage facilities.
- Spill Incidents (count): Records the number of petroleum waste spills or leak incidents during the reporting period.
- Treatment Efficiency Rate (%): Measures how effectively waste treatment systems remove contaminants from waste streams.
- Oil & Grease in Discharge (mg/L): Monitors oil and grease concentration in treated effluent to ensure regulatory compliance.
- Total Petroleum Hydrocarbons in Effluent (mg/L): Tracks hydrocarbon concentration in discharged wastewater after treatment.
- Sludge Dewatering Efficiency (%): Indicates how efficiently moisture is removed from sludge during dewatering processes.
- Waste Disposal Compliance Rate (%): Measures adherence to approved disposal methods and regulatory requirements.
- Environmental Incident Rate (per 1000 m³): Calculates the frequency of environmental incidents per thousand cubic meters of waste handled.
Frequently Asked Questions
1. Why is a petroleum waste management dashboard important for refineries?
It provides real-time visibility into waste generation, treatment, and compliance, helping refineries reduce environmental and regulatory risk.
2. What type of waste does the dashboard track?
It tracks oily water, sludge, tank bottoms, spent filters, and other petroleum residues.
3. Can this dashboard support ESG reporting?
Yes. It serves as a centralized environmental reporting tool aligned with ESG disclosure and regulatory requirements.
4. Who uses this dashboard in a refinery?
Environmental managers, operations teams, compliance officers, and refinery leadership.
5. Does the dashboard help reduce waste generation?
Yes. Trend and composition analysis help identify inefficiencies and opportunities for waste reduction.