
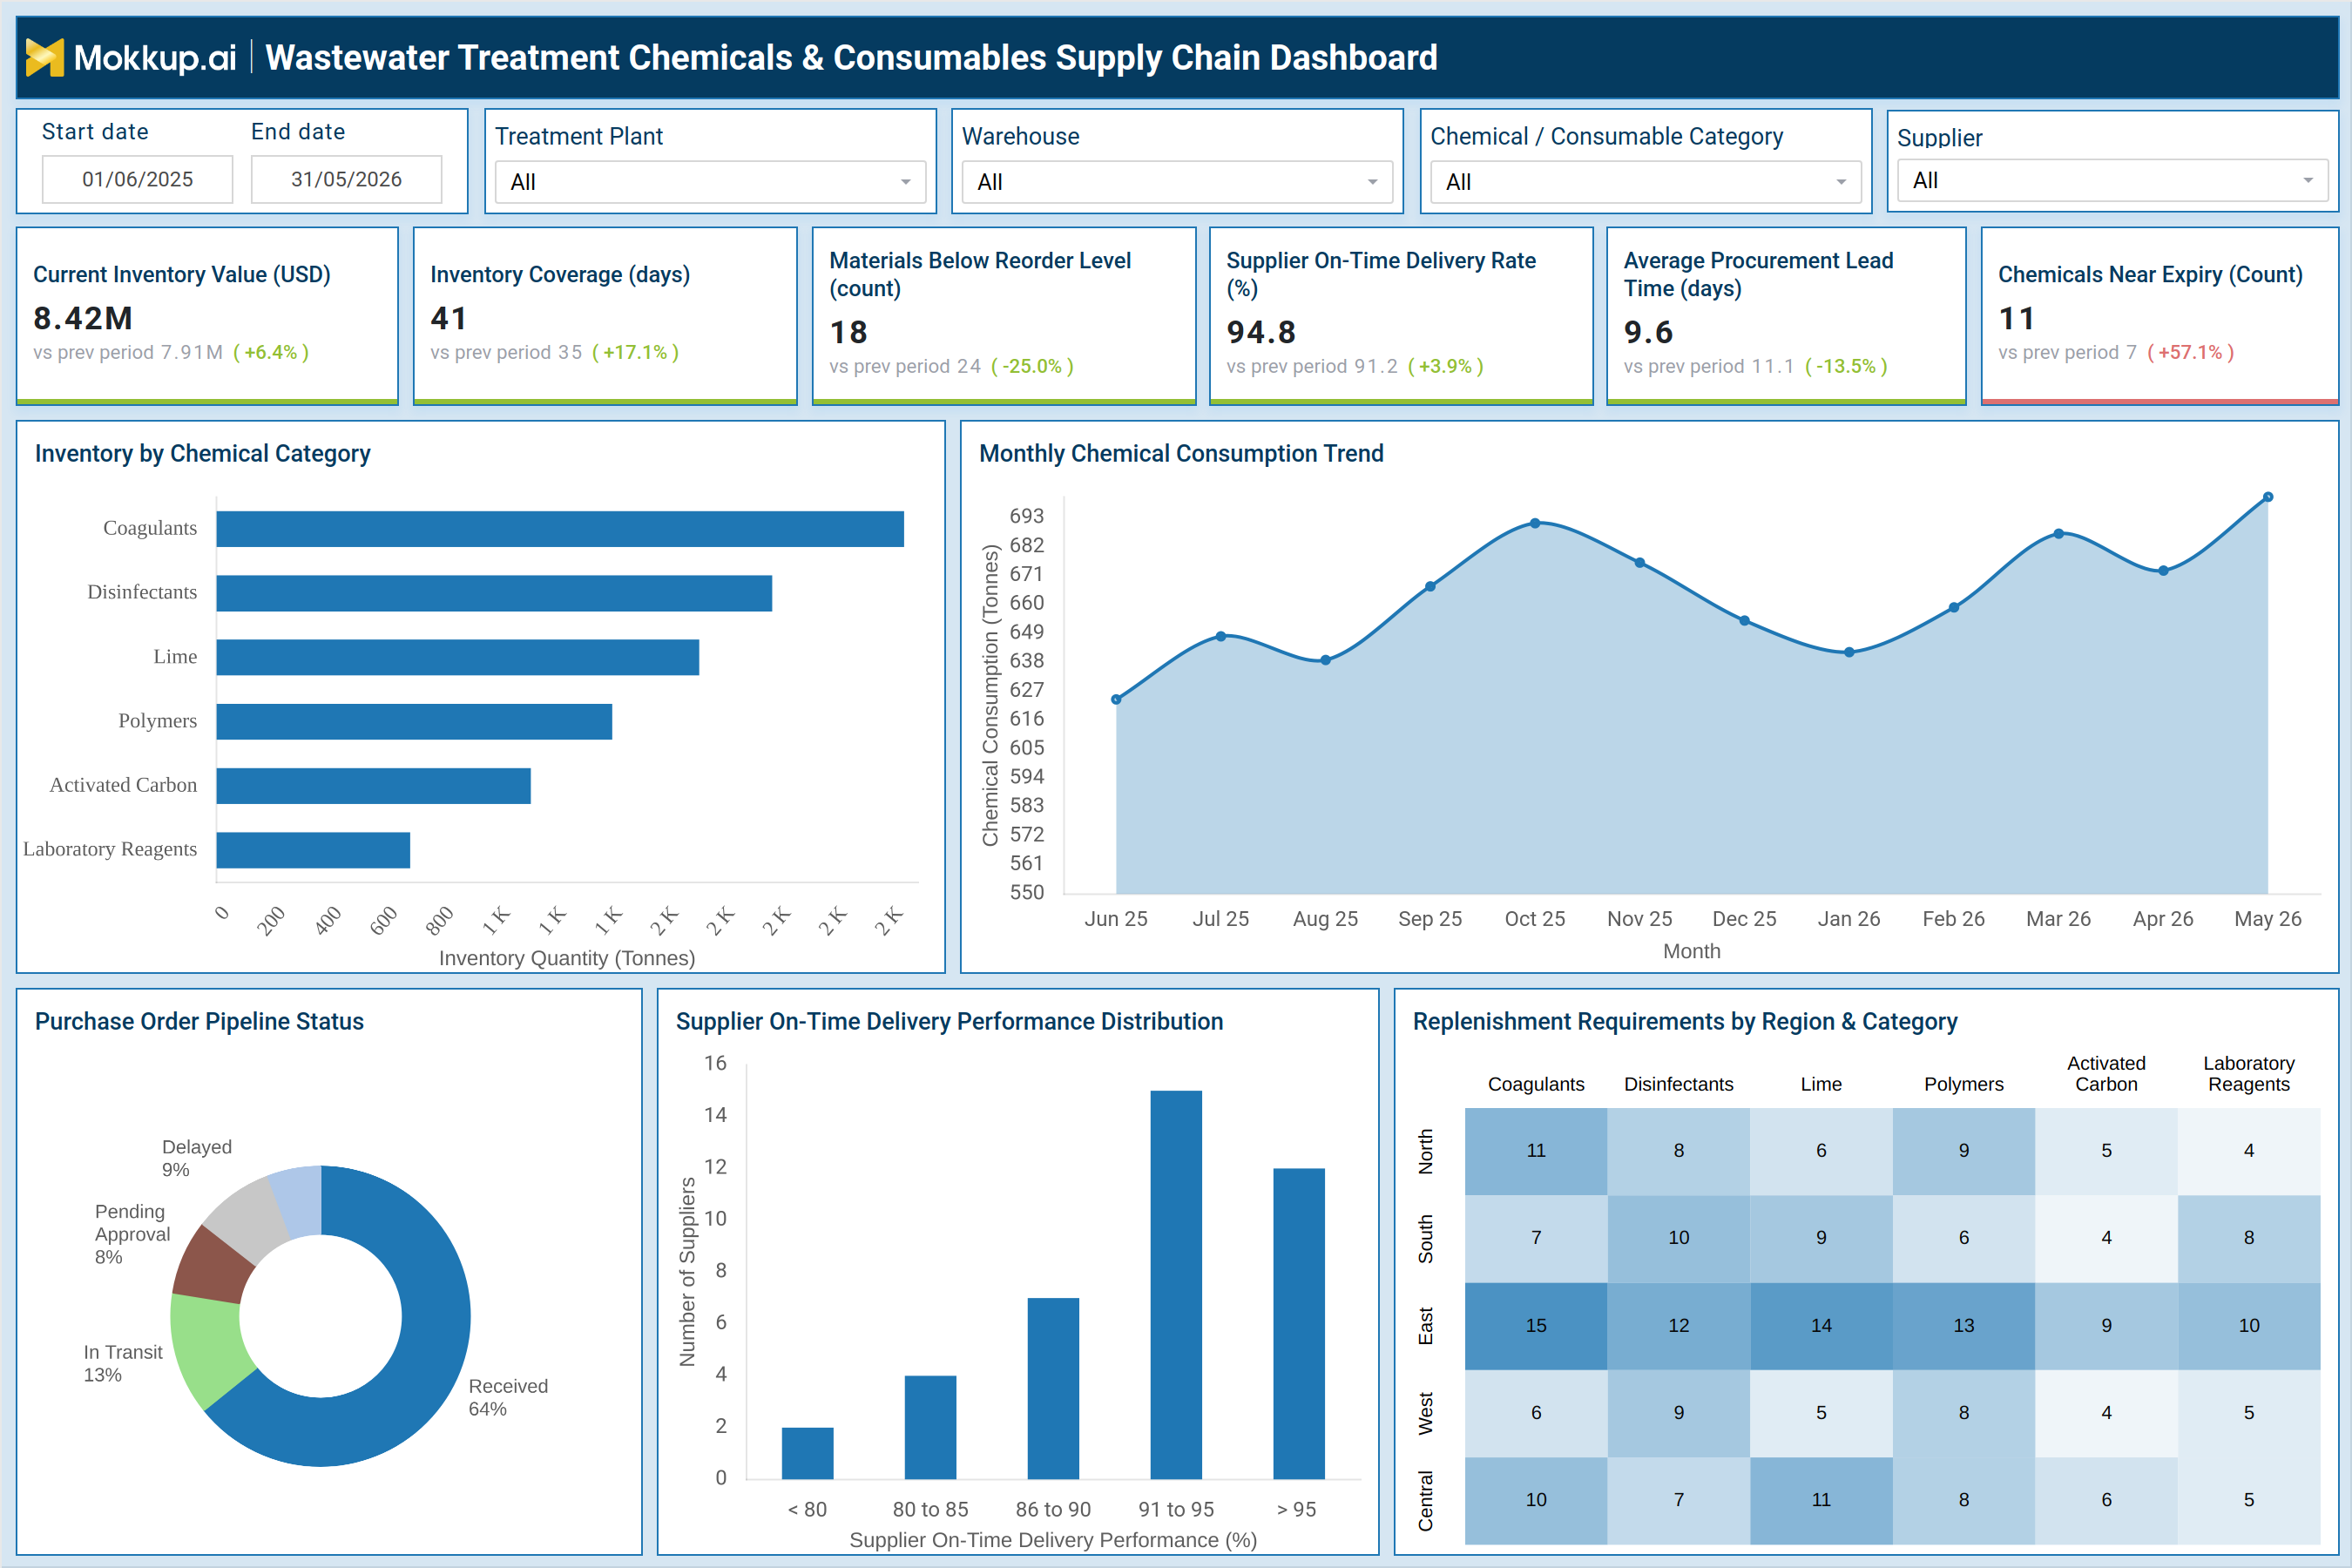
What is a Wastewater Treatment Chemicals & Consumables Supply Chain Dashboard?
The Wastewater Treatment Chemicals & Consumables Supply Chain Dashboard is a purpose-built analytics tool designed to give procurement teams, plant operations managers, and supply chain analysts a consolidated view of chemical inventory health, supplier performance, and replenishment requirements across treatment facilities. Managing chemicals such as coagulants, disinfectants, lime, polymers, activated carbon, and laboratory reagents involves constant monitoring of stock levels, reorder thresholds, procurement lead times, and supplier reliability. This dashboard consolidates those variables into a single, structured interface that supports faster, more informed purchasing decisions.
The dashboard tracks critical supply chain KPIs — Key Performance Indicators — that directly affect operational continuity and regulatory compliance in wastewater treatment. From current inventory value and coverage days to supplier on-time delivery rates and materials below reorder level, each metric is designed to surface actionable signals rather than just numbers. By filtering data across treatment plant, warehouse, chemical category, and supplier, teams can isolate issues at any level of the supply chain and act before stockouts or expired inventory create operational disruptions. For organizations managing chemical inventory management for wastewater facilities across multiple regions, this dashboard provides the granular and cross-regional visibility needed to maintain treatment standards.
How to Create a Wastewater Treatment Chemicals & Consumables Supply Chain Dashboard
You don't need to build your report from scratch, just start with a ready-to-use dashboard template from Mokkup. Add in your data and export it however you like. Here's how to do it:
1. Create or Log in to Your Mokkup Account
Start by signing up on Mokkup.ai using your email. If you already have an account, just log in, and you'll be good to go.
2. Choose and Customize Your Dashboard Template
Find the Wastewater Treatment Chemicals & Consumables Supply Chain Dashboard template in the Templates section. Use the drag-and-drop editor to adjust KPIs, edit filters, or add elements based on your data.
3. Export to Your BI Tool
Once your dashboard wireframe is ready, use the BI Tool Export feature to send it directly to Power BI or Tableau for further analysis and enhancements. You can also download the dashboard as a PDF, PNG, or JPEG, embed it on a platform, or invite your team to collaborate.
Note: This is a Pro template. You'll need a Pro subscription on Mokkup to use and customize this dashboard wireframe. Upgrade anytime to unlock full access.
Wastewater Treatment Chemicals & Consumables Supply Chain Dashboard Example
A procurement manager at a regional water utility opens this dashboard at the start of each week to assess whether chemical stock levels across facilities are sufficient to maintain uninterrupted treatment operations. The KPI row immediately surfaces how many materials have dropped below their reorder level and whether the current inventory covers enough treatment days — two numbers that set the tone for the week's purchasing priorities. If inventory coverage is tightening, the manager knows to fast-track purchase orders before treatment capacity is affected. Deeper in the dashboard, the inventory breakdown by chemical category allows operations teams to compare stock volumes across coagulants, disinfectants, lime, polymers, activated carbon, and laboratory reagents. This helps planners spot which specific chemical categories are running thin relative to consumption patterns visible in the monthly consumption trend line chart. When consumption is trending upward heading into a high-demand season, procurement teams can proactively increase order quantities before shortfall conditions emerge. The purchase order pipeline status view shows where existing orders currently stand — received, in transit, pending approval, or delayed — so teams can follow up on at-risk deliveries without waiting for a disruption.
Supplier performance analysis is another core use case. The on-time delivery performance distribution chart helps supply chain analysts identify which supplier segments are consistently meeting delivery commitments and which are falling short. For facilities operating under strict treatment schedules, a supplier on-time delivery tracking approach lets procurement teams renegotiate terms or qualify backup suppliers before performance gaps become operational problems. The average procurement lead time KPI adds further context, showing whether sourcing cycles are extending — a signal that can trigger early reordering. The replenishment requirements matrix rounds out the dashboard by showing, by region and chemical category, where restocking actions are most urgent. This cross-regional procurement planning view is particularly valuable for multi-facility operators who need to balance inventory across North, South, East, West, and Central locations without over-stocking any single warehouse. Together, these views give procurement and operations teams a complete picture of supply chain health and the information needed to keep treatment facilities running at full capacity.
How to Analyze Data in a Wastewater Treatment Chemicals & Consumables Supply Chain Dashboard
Here is how you can analyze data from this dashboard:
- Treatment Plant and Chemical Filtering – Filter data by treatment plant and chemical category to identify inventory gaps at specific facilities.
- Inventory Coverage vs. Lead Time – Compare inventory coverage days with procurement lead times to identify potential stockout risks.
- Monthly Consumption Trends – Monitor chemical consumption trends to identify seasonal demand patterns and optimize ordering.
- Purchase Order Pipeline Monitoring – Review purchase order status to identify delayed or pending approvals requiring action.
- Replenishment Priority Analysis – Cross-reference replenishment needs with current inventory levels to prioritize chemical restocking.
- Supplier Delivery Performance – Evaluate supplier on-time delivery rates to identify reliable vendors and address supplier performance issues.
- Expiry Risk Monitoring – Track chemicals nearing expiry alongside inventory value to reduce waste and improve inventory management.
- Warehouse Stock Distribution – Analyze inventory across warehouses to maintain balanced stock levels and prevent overstocking or shortages.
Benefits of a Wastewater Treatment Chemicals & Consumables Supply Chain Dashboard
The following are the benefits of using this dashboard:
- Centralized Chemical Inventory Visibility – Consolidate chemical inventory data across all facilities and warehouses into a single dashboard.
- Reduced Stockout Risk – Identify materials below reorder levels early to prevent critical shortages.
- Improved Supplier Accountability – Track on-time delivery performance to evaluate and improve supplier reliability.
- Enhanced Chemical Inventory Management – Monitor chemical inventory by category and region for better operational control.
- Faster Procurement Decisions – Combine lead time, inventory coverage, and purchase pipeline data to streamline procurement.
- Cross-Regional Procurement Planning – Map replenishment needs across facilities to optimize inventory distribution.
- Reduced Chemical Waste – Track chemicals nearing expiry alongside inventory value to minimize waste.
- Simplified Compliance Monitoring – Maintain clear visibility into chemical inventory and consumption trends to support audits and compliance reporting.
KPIs to Track in a Wastewater Treatment Chemicals & Consumables Supply Chain Dashboard
The following key KPIs can be tracked by using this dashboard:
- Current Inventory Value (USD): Total monetary value of all chemicals and consumables currently in stock across facilities.
- Inventory Coverage (days): Number of days current stock can sustain operations without additional procurement; a core indicator for supply chain risk management for water treatment plants.
- Materials Below Reorder Level (count): Number of chemical items that have fallen below the minimum threshold requiring immediate replenishment action.
- Supplier On-Time Delivery Rate (%): Percentage of supplier deliveries received within the agreed delivery window; central to supplier on-time delivery tracking.
- Average Procurement Lead Time (days): Average number of days from purchase order placement to delivery; critical for setting reorder points accurately.
- Chemicals Near Expiry (count): Number of chemical items approaching their expiration date, used to prioritize consumption or disposal and reduce waste.
Frequently Asked Questions
1. What types of chemicals are tracked in the Wastewater Treatment Chemicals & Consumables Supply Chain Dashboard?
The dashboard tracks six chemical and consumable categories: coagulants, disinfectants, lime, polymers, activated carbon, and laboratory reagents. Each category can be filtered independently to support focused analysis by procurement or plant operations teams.
2. How does the dashboard support chemical supply chain optimization for water utilities?
It combines inventory coverage, reorder alerts, supplier delivery performance, and regional replenishment requirements in one interface. This structure allows teams to identify supply risks early, prioritize restocking actions, and evaluate supplier reliability without switching between separate reports. Chemical supply chain optimization for water utilities depends on exactly this kind of integrated, multi-metric view.
3. Can the dashboard be used for multi-facility supply chain management?
Yes. The replenishment requirements matrix breaks down stock needs by region — North, South, East, West, and Central — and by chemical category. Combined with the warehouse and treatment plant filters, this makes the dashboard well-suited for procurement visibility in water treatment operations spanning multiple facilities.