
What is a Water Recycling Recycled Water Contamination Risk Dashboard?
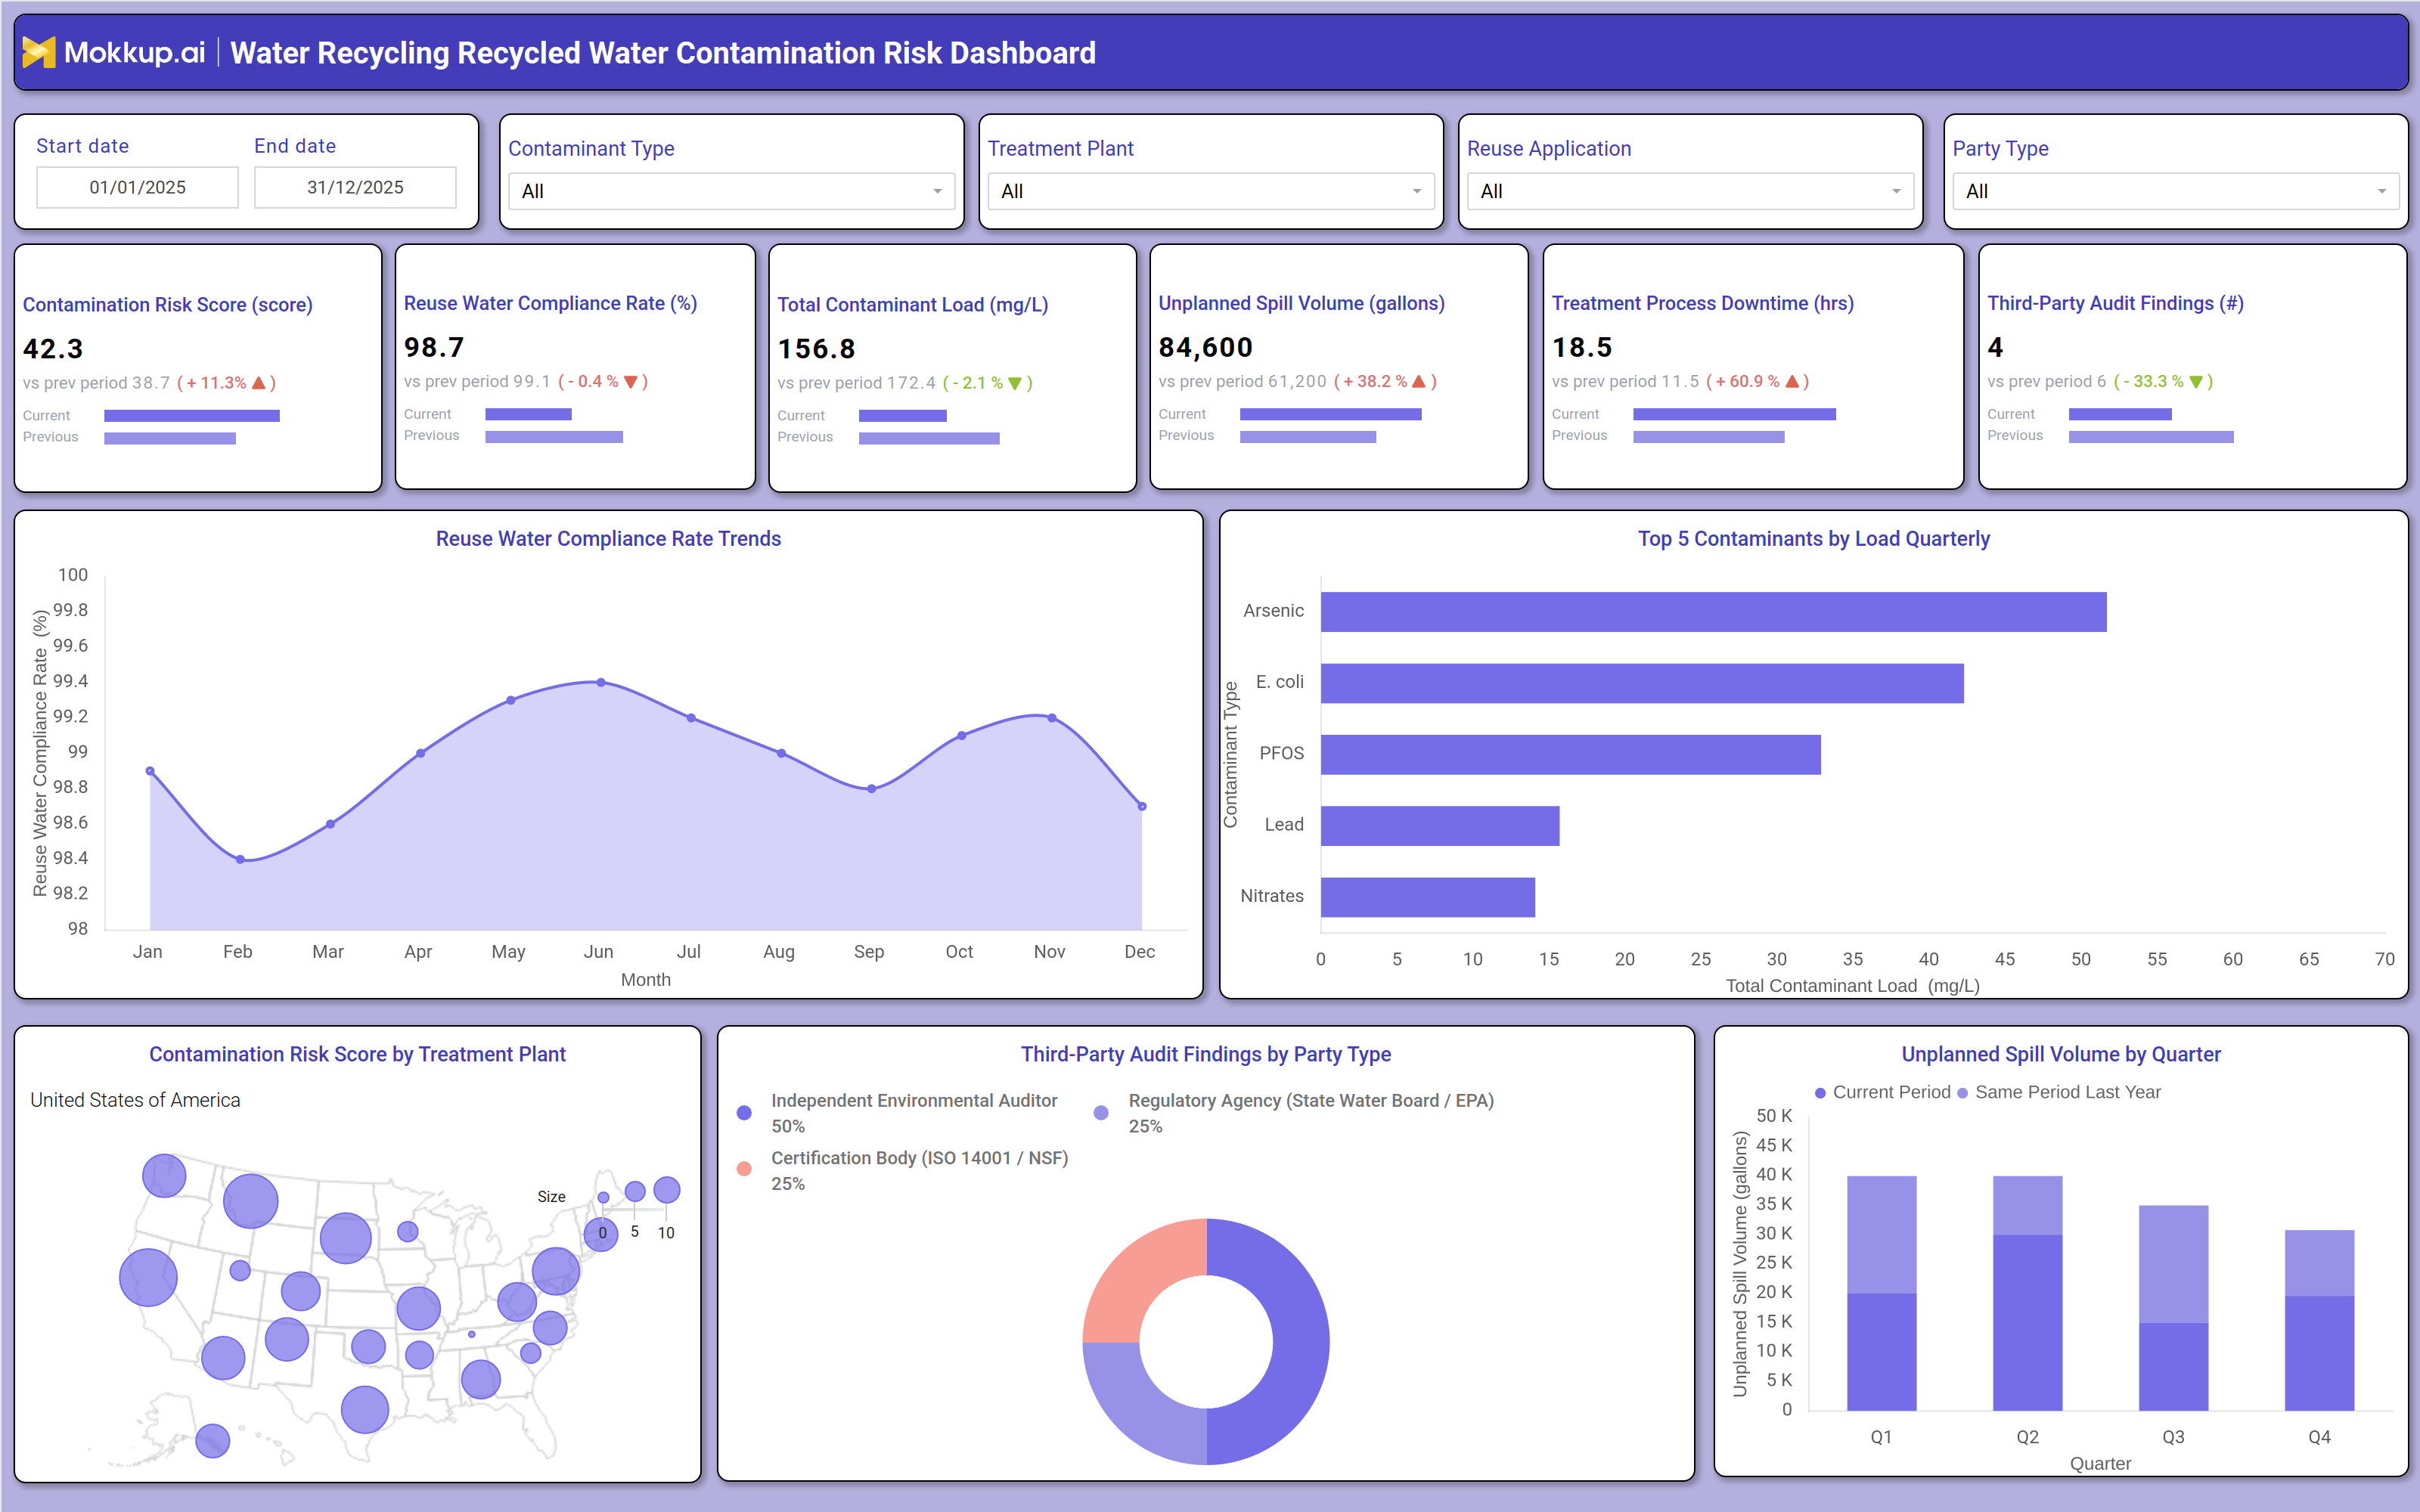
The Water Recycling Recycled Water Contamination Risk Dashboard is a purpose-built recycled water contamination risk dashboard template for utilities and reuse facilities that need to monitor contamination exposure across treatment plants, contaminants, and reuse applications from one screen. It brings together a contamination risk score, reuse water compliance rate, total contaminant load, unplanned spill volume, treatment process downtime, and third-party audit findings, replacing scattered lab reports and audit logs with a single reference point for water reuse compliance monitoring. Filters for date range, contaminant type, treatment plant, reuse application, and party type let compliance officers and plant managers narrow the view to the facility or contaminant class they are reviewing. As a Mokkup.ai wireframe, the layout is fully editable before export to a BI tool.
How to Create a Water Recycling Recycled Water Contamination Risk Dashboard
You don't need to build your report from scratch, just start with a ready-to-use dashboard template from Mokkup. Add in your data and export it however you like. Here's how to do it:
1. Create or Log in to Your Mokkup Account
Start by signing up on Mokkup.ai using your email. If you already have an account, just log in, and you'll be good to go.
2. Choose and Customize Your Dashboard Template
Find the Water Recycling Recycled Water Contamination Risk Dashboard template in the Templates section. Use the drag-and-drop editor to adjust KPIs, edit filters, or add elements based on your data.
3. Export to Your BI Tool
Once your dashboard wireframe is ready, use the BI Tool Export feature to send it directly to Power BI or Tableau for further analysis and enhancements. You can also download the dashboard as a PDF, PNG, or JPEG, embed it on a platform, or invite your team to collaborate.
Note: This is a Pro template. You'll need a Pro subscription on Mokkup to use and customize this dashboard wireframe. Upgrade anytime to unlock full access.
Water Recycling Recycled Water Contamination Risk Dashboard Example
A compliance manager at a water reclamation utility opens the Water Recycling Recycled Water Contamination Risk Dashboard at the start of a reporting cycle to answer one question: is contamination exposure trending in a direction that puts reuse permits or public health commitments at risk? Rather than requesting updates from the lab, operations, and audit teams separately, the manager filters by treatment plant and contaminant type to see where risk is concentrated before it becomes a compliance incident. From the overview, the team can identify which contaminants contribute most to the overall contaminant load and prioritize corrective sampling for those substances first. Managers can track how the reuse water compliance rate moves month over month and flag periods when it dips below internal thresholds, even briefly. Planners can compare unplanned spill volume and treatment process downtime across quarters to determine whether operational disruptions are driving contamination risk upward, and this contaminant load tracking dashboard view makes it straightforward to connect a downtime spike to a subsequent spill event. When the map view shows risk concentrated at specific plants, teams can direct site audits and maintenance resources toward those locations instead of spreading effort evenly across the network. Reviewing third-party audit findings by party type also helps leadership understand whether internal reviews, regulators, or certification bodies are catching the most issues, which shapes how audit programs get resourced going forward. Used consistently, this water recycling risk management dashboard template helps utilities catch contamination risk early, defend compliance positions with auditors and regulators, and reduce the operational surprises that come from unplanned spills and treatment downtime.
How to Analyze Data in a Water Recycling Recycled Water Contamination Risk Dashboard
Here is how you can analyze data from this dashboard:
- Treatment Plant and Contaminant Filtering – Filter data by treatment plant and contaminant type to identify areas with the highest contamination risk.
- Contamination Risk Trend Analysis – Compare current contamination risk scores with previous periods to monitor changes over time.
- Reuse Water Compliance Monitoring – Track compliance rate trends to identify periods falling below target thresholds.
- Top Contaminant Analysis – Review the highest contaminant loads to prioritize sampling and treatment efforts.
- Spill vs. Downtime Analysis – Compare unplanned spill volumes with treatment downtime to identify potential operational correlations.
- Audit Findings Analysis – Segment audit findings by party type to identify the most common compliance issues.
- Reuse Program Performance Analysis – Apply reuse application and party type filters to evaluate contaminant trends for specific water reuse programs.
Benefits of a Water Recycling Recycled Water Contamination Risk Dashboard
The following are the benefits of using this dashboard:
- Centralized Contamination Monitoring – Consolidate contamination risk, compliance rates, and contaminant loads into a single dashboard.
- Reduced Reporting Effort – Combine laboratory, audit, and operational data to simplify water reuse compliance reporting.
- Faster Root Cause Analysis – Link spill volumes, process downtime, and audit findings to identify the causes of contamination issues.
- Proactive Risk Management – Support planning with a customizable dashboard for monitoring water recycling risks.
- Improved Audit Readiness – Track audit findings by party type to stay prepared for regulatory and certification reviews.
- Geographic Risk Benchmarking – Compare contamination risk across treatment plants to identify high-risk facilities and prioritize improvements.
KPIs to Track in a Water Recycling Recycled Water Contamination Risk Dashboard
The following key KPIs can be tracked by using this dashboard:
- Contamination Risk Score – A composite score reflecting overall contamination exposure across treatment plants and contaminants.
- Reuse Water Compliance Rate (%) – The share of reuse water output meeting regulatory and permit standards.
- Total Contaminant Load (mg/L) – The aggregate concentration of monitored contaminants across the reuse water supply.
- Unplanned Spill Volume (gallons) – The volume of recycled water released outside planned discharge events, monitored through unplanned spill volume tracking to catch abnormal releases early.
- Treatment Process Downtime (hrs) – The hours treatment processes were offline or degraded, a leading indicator of rising contamination risk.
- Third-Party Audit Findings (count) – The count of issues identified by external auditors, regulators, or certification bodies.
Frequently Asked Questions
1. What is the Water Recycling Recycled Water Contamination Risk Dashboard used for?
It gives water utilities and reuse operators a single view of contamination risk score, compliance rate, and contaminant load across treatment plants and reuse applications. Teams use it to catch contamination issues early and prepare for audits.
2. Which KPIs matter most on this dashboard?
Contamination risk score and reuse water compliance rate are the primary indicators, supported by contaminant load, spill volume, downtime, and audit findings. Together, they show whether risk is rising before it affects compliance status.
3. Can I customize this dashboard template for my own facilities?
Yes, the template is built in Mokkup.ai so you can adjust filters, KPIs, and layout for your own treatment plant contamination risk score reporting and unplanned spill volume tracking needs, then export it to Power BI or Tableau. A Pro subscription is required to customize and export it.