
What is a Water Recycling Contract & Tariff Dashboard?
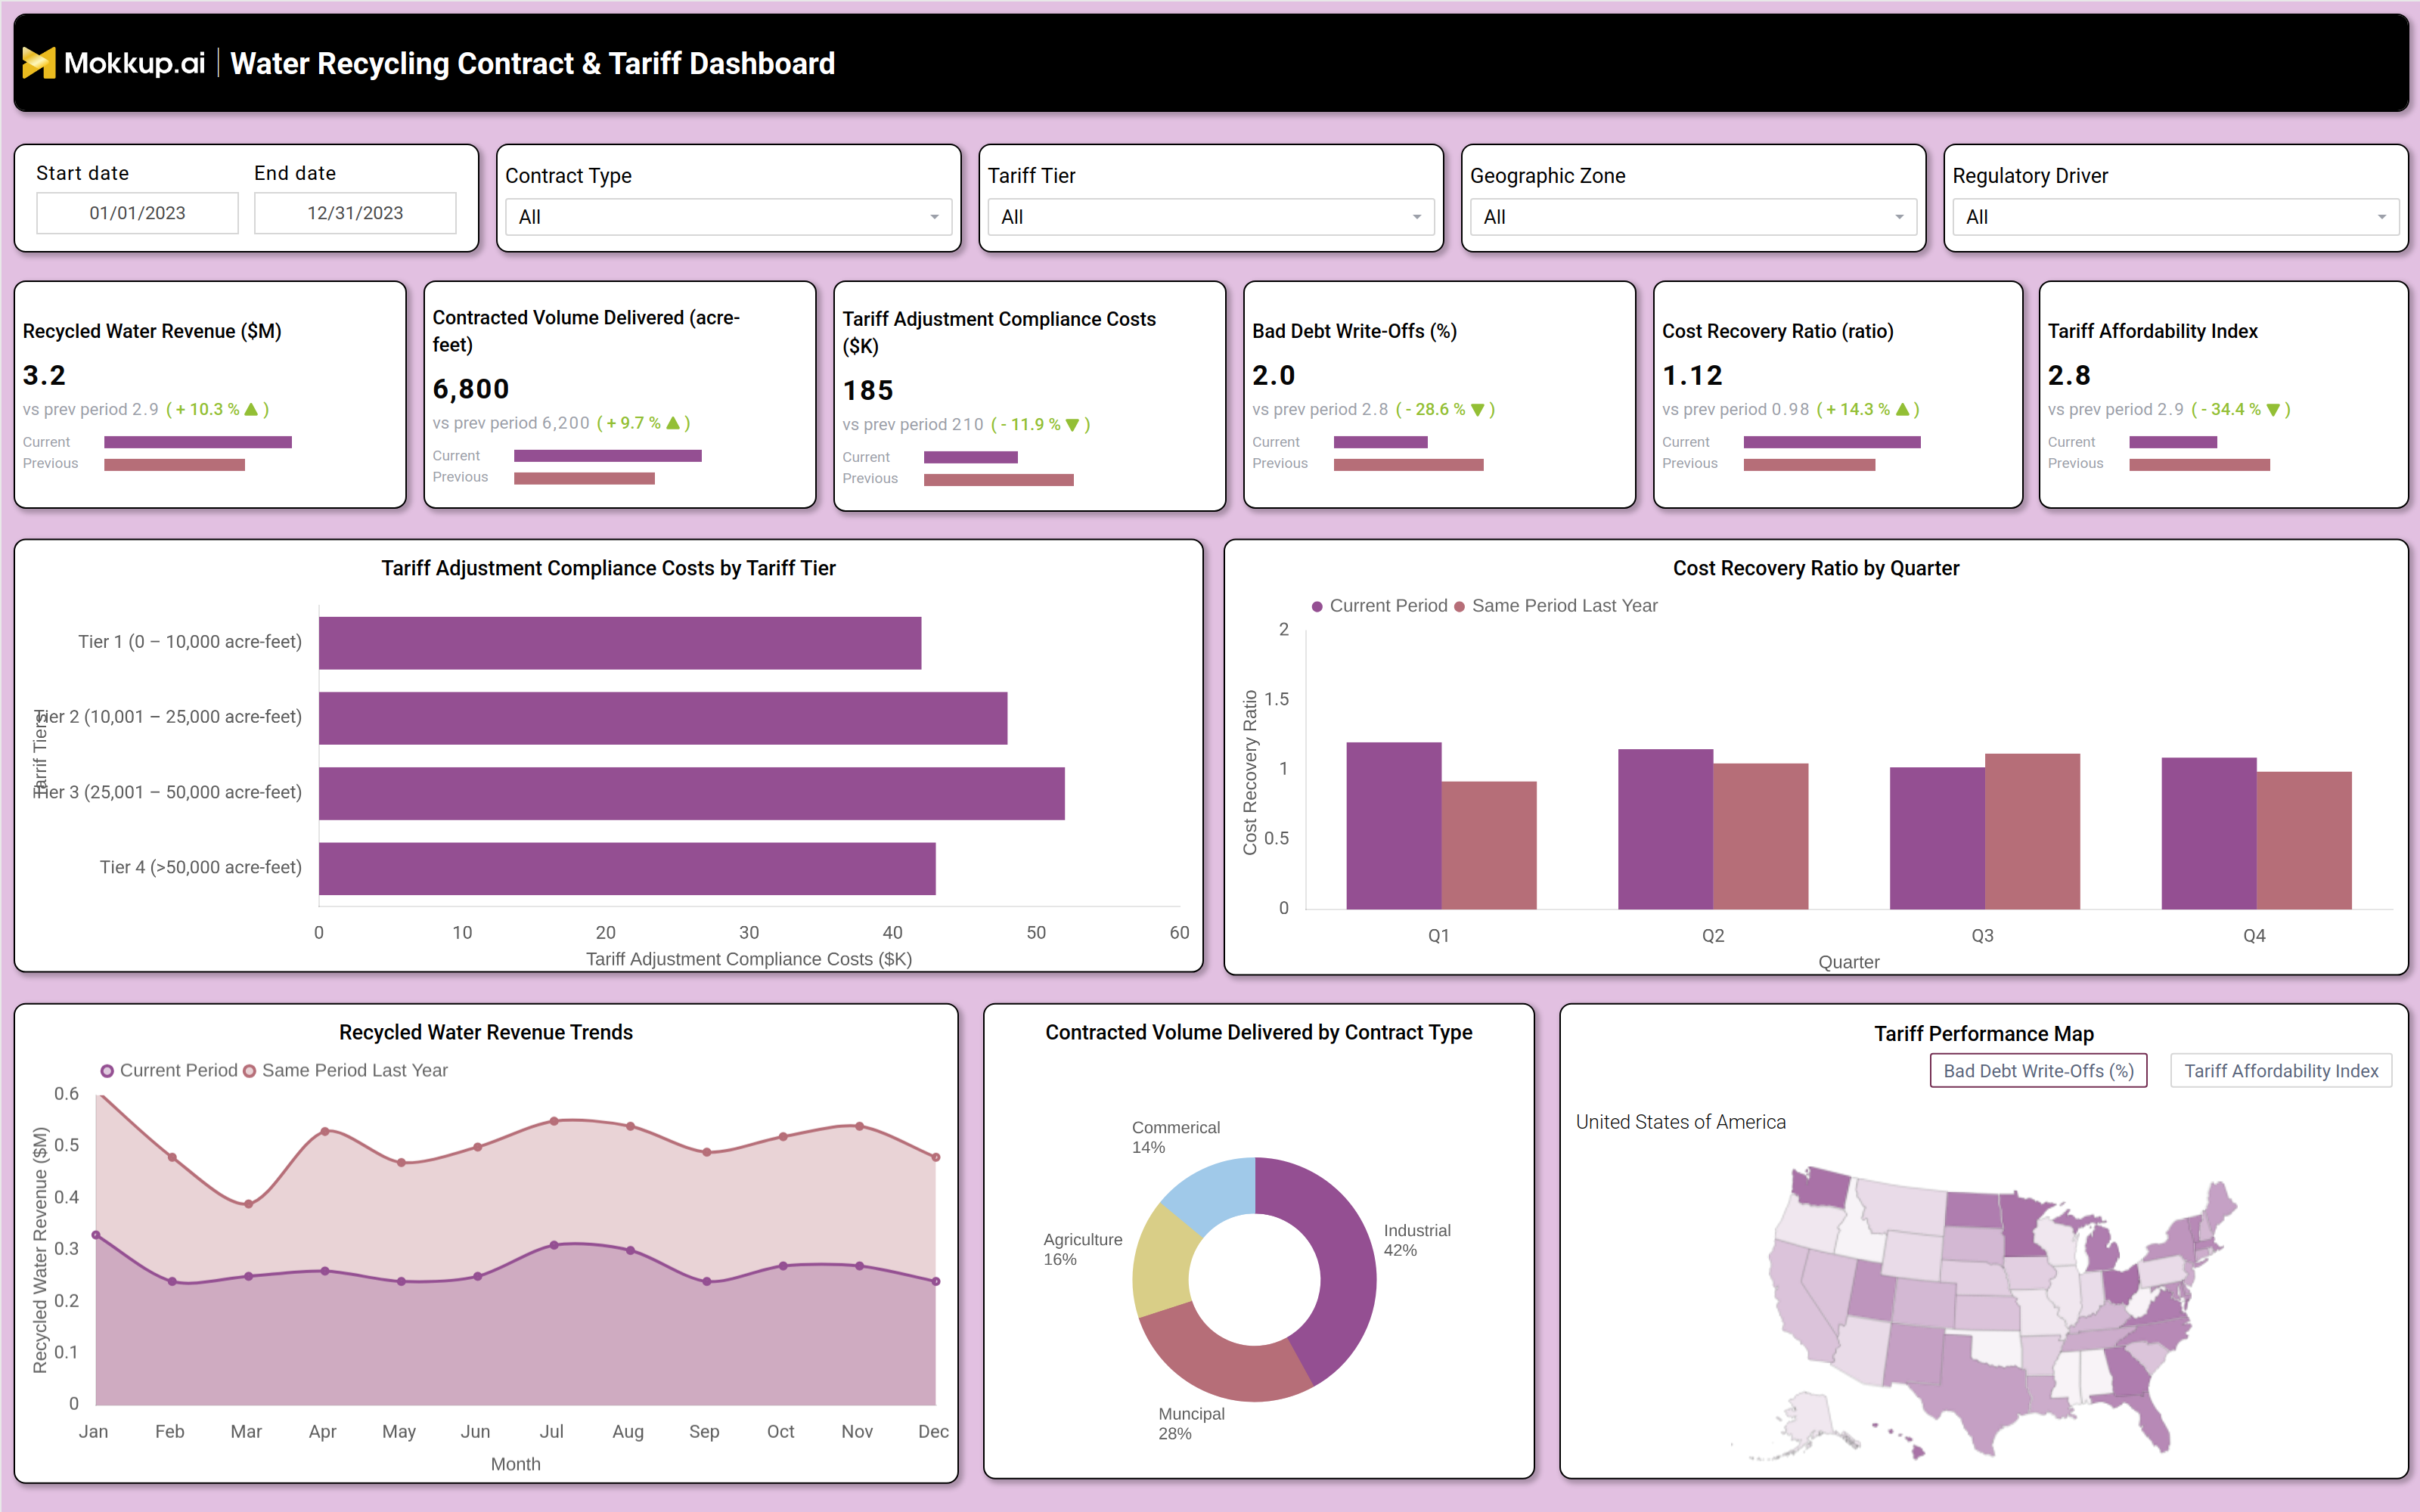
A Water Recycling Contract & Tariff Dashboard is a specialized analytics tool designed for water utilities to monitor, manage, and optimize wastewater reuse agreements and pricing structures. This dashboard consolidates contract performance, tariff compliance, revenue trends, and operational costs into a single interface, enabling utilities to make data-driven decisions. By tracking contracted volumes, tariff adjustments, bad debt write-offs, and cost recovery ratios, utilities can ensure financial sustainability while promoting water recycling initiatives. The dashboard also helps identify tariff affordability challenges, compliance risks, and revenue opportunities, making it essential for sustainable water utility management.
How to Create a Water Recycling Contract & Tariff Dashboard
You don’t need to build your report from scratch; just start with a ready-to-use dashboard template from Mokkup. Add in your data and export it however you like. Here’s how to do it:
1. Create or Log in to Your Mokkup Account
Start by signing up on Mokkup.ai using your email. If you already have an account, just log in, and you’ll be good to go.
2. Choose and Customize Your Dashboard Template
Find the Water Recycling Contract & Tariff Dashboard template in the Templates section. Use the drag and drop editor to adjust KPIs, edit filters, or add elements based on your data.
3. Export to Your BI Tool
Once your dashboard wireframe is ready, use the BI Tool Export feature to send it directly to Power BI or Tableau for further analysis and enhancements. You can also download the dashboard as a PDF, PNG, or JPEG, embed it on a platform, or invite your team to collaborate.
Note: This is a Pro template. You’ll need a Pro subscription on Mokkup to use and customize this dashboard wireframe. Upgrade anytime to unlock full access.
Water Recycling Contract & Tariff Dashboard Example
A well-structured Water Recycling Contract & Tariff Dashboard includes interactive filters for date ranges, contract types, tariff tiers, geographic zones, and regulatory drivers, allowing utilities to drill down into specific data segments. Key performance tiles display recycled water revenue, contracted volume delivered, tariff adjustment compliance costs, bad debt write offs, cost recovery ratios, and tariff affordability indexes.
Trend charts compare current performance against previous periods, while tariff tier breakdowns highlight compliance costs across different usage levels. A geographic heatmap visualizes tariff performance and bad debt risks by region, and a contract type distribution chart shows how recycled water is allocated across municipal, industrial, agricultural, and commercial sectors. Together, these components provide a comprehensive view of water recycling contract efficiency and financial health, helping utilities optimize pricing, reduce losses, and improve sustainability.
How to Analyze Data in a Water Recycling Contract & Tariff Dashboard
Here is how you can analyze data from this tariff affordability dashboard:
- Review recycled water revenue trends to assess financial performance and identify growth opportunities.
- Monitor contracted volume delivered to ensure compliance with water recycling agreements.
- Track tariff adjustment compliance costs to evaluate the financial impact of regulatory changes.
- Analyze bad debt writeoffs to detect payment collection inefficiencies and revenue leakage.
- Evaluate cost recovery ratios to determine if tariffs cover operational and capital expenses.
- Assess tariff affordability indexes to ensure pricing remains sustainable for end users.
- Compare performance across tariff tiers to optimize pricing structures for different usage levels.
- Use geographic heatmaps to identify highrisk regions for bad debt or low adoption.
- Examine contract type distributions to allocate resources effectively across sectors.
Benefits of a Water Recycling Contract & Tariff Dashboard
The following are the benefits of using this bad debt tracking dashboard:
- Improves financial transparency by tracking revenue, costs, and compliance.
- Enhances contract management by monitoring delivery volumes and pricing adjustments.
- Reduces revenue losses by identifying bad debt risks and payment inefficiencies.
- Optimizes tariff structures to balance affordability and cost recovery.
- Supports regulatory compliance by tracking tariff adjustments and reporting requirements.
- Enables data driven decision making for sustainable water recycling programs.
- Enhances stakeholder reporting with clear visualizations of performance metrics.
KPIs to Track in a Water Recycling Contract & Tariff Dashboard
The following key KPIs can be tracked by using this dashboard:
- Recycled Water Revenue ($M): Total revenue generated from recycled water sales.
- Contracted Volume Delivered (acre feet): Volume of recycled water supplied under contractual agreements.
- Tariff Adjustment Compliance Costs ($K): Expenses incurred due to regulatory tariff changes.
- Bad Debt WriteOffs (%): Percentage of uncollected revenue from nonpaying customers.
- Cost Recovery Ratio (ratio): Measures whether tariffs cover operational and capital costs.
- Tariff Affordability Index: Assesses whether pricing remains accessible to end users.
Frequently Asked Questions
1. What is a cost recovery ratio dashboard used for?
It helps utilities track contract performance, tariff compliance, revenue trends, and cost recovery to optimize water recycling programs.
2. What data sources feed into this water recycling contract dashboard?
Billing systems, contract management software, financial records, and regulatory compliance reports provide the necessary data.
3. Who should use a recycled water tariff dashboard?
Water utility managers, financial analysts, regulatory compliance teams, and sustainability officers benefit from this dashboard.