
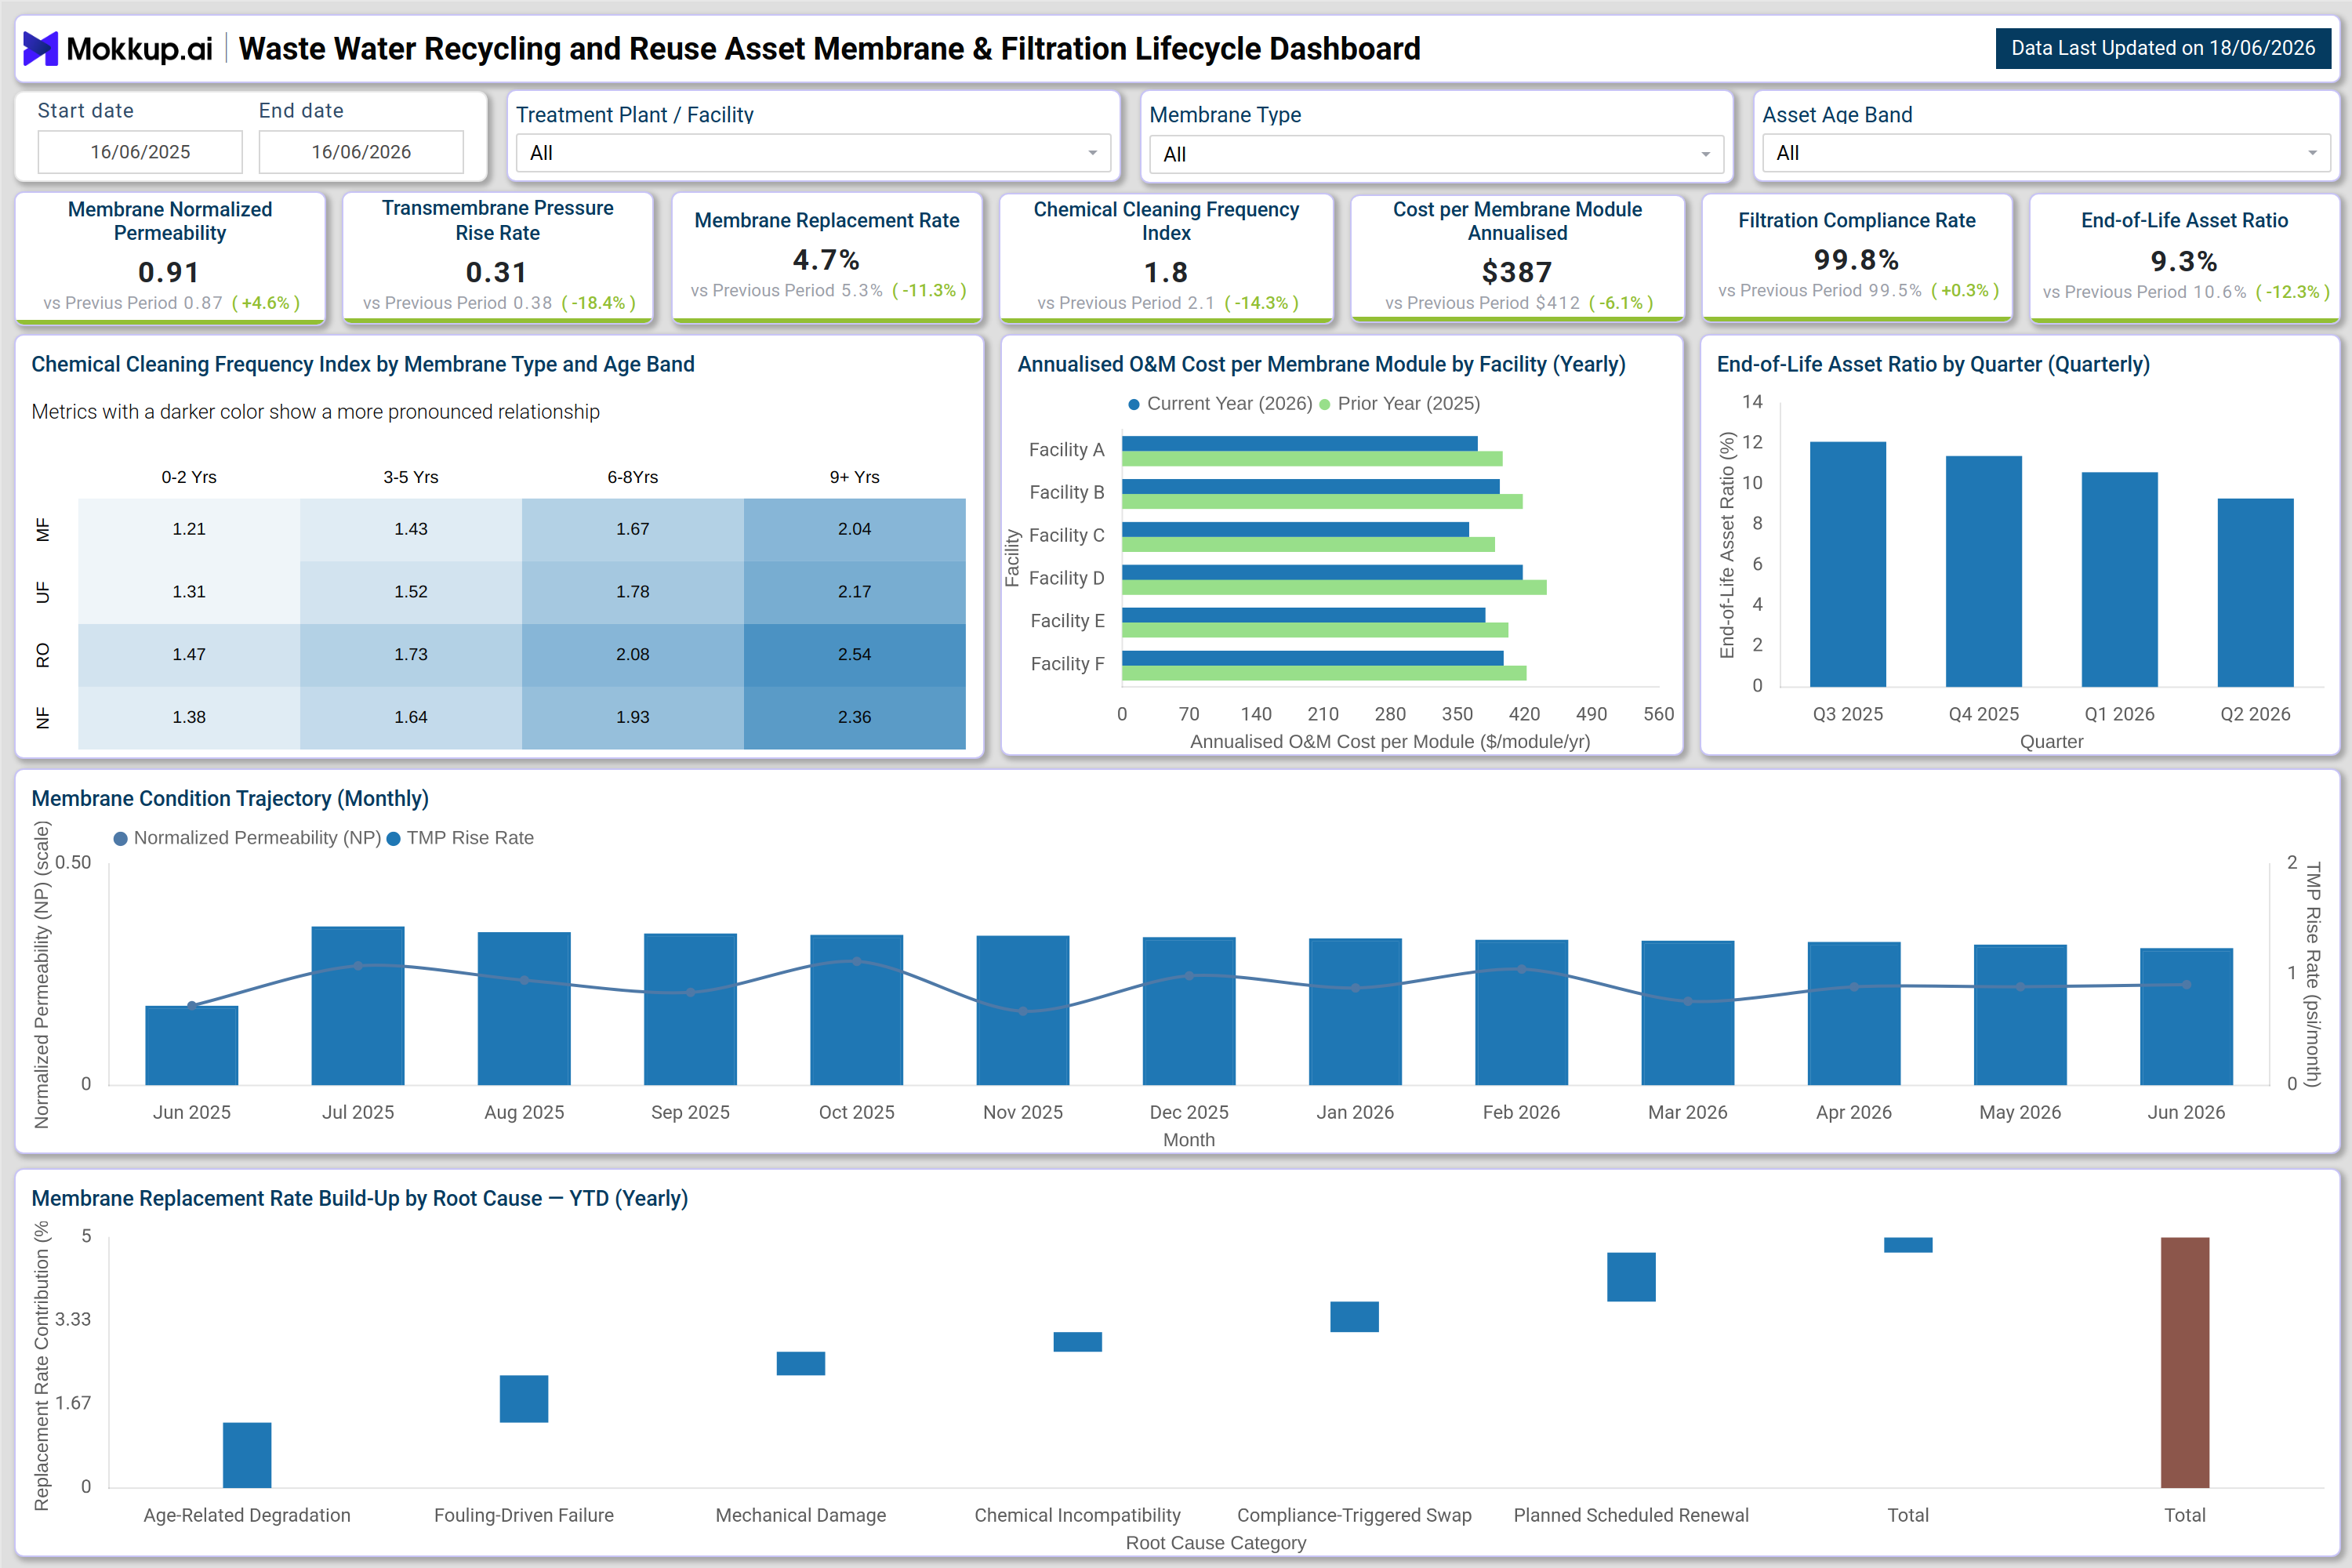
What is a Wastewater Recycling and Reuse Asset Membrane & Filtration Lifecycle Dashboard?
The Waste Water Recycling and Reuse Asset Membrane & Filtration Lifecycle Dashboard is a structured performance monitoring tool built for water utility managers, asset engineers, and operations teams overseeing filtration infrastructure in recycling and reuse facilities. It consolidates key indicators of membrane health, maintenance costs, and asset compliance into a single view, enabling teams to track degradation trends and act before costly failures occur. This membrane filtration lifecycle tracking dashboard for water reuse surfaces operational signals that are often scattered across maintenance logs and lab reports. By bringing normalized permeability trends, replacement rate drivers, and annualized cost data together, the dashboard allows teams to compare membrane performance across facilities and age bands without switching between systems.
The dashboard is designed around the operational reality that membrane performance degrades gradually and unpredictably. Factors like fouling severity, chemical incompatibility, and age-related wear each contribute differently to asset attrition. With the chemical cleaning frequency index for wastewater treatment assets visible alongside cost and compliance data, maintenance planners can identify which membrane types demand the most intervention and whether those interventions are delivering adequate performance returns. The membrane normalized permeability trend analysis dashboard view makes it possible to distinguish cyclical performance dips from sustained decline.
How to Create a Wastewater Recycling and Reuse Asset Membrane & Filtration Lifecycle Dashboard
You don't need to build your report from scratch; just start with a ready-to-use dashboard template from Mokkup. Add in your data and export it however you like. Here's how to do it:
1. Create or Log in to Your Mokkup Account
Start by signing up on Mokkup.ai using your email. If you already have an account, just log in, and you'll be good to go.
2. Choose and Customize Your Dashboard Template
Find the Wastewater Recycling and Reuse Asset Membrane & Filtration Lifecycle Dashboard template in the Templates section. Use the drag-and-drop editor to adjust KPIs, edit filters, or add elements based on your data.
3. Export to Your BI Tool
Once your dashboard wireframe is ready, use the BI Tool Export feature to send it directly to Power BI or Tableau for further analysis and enhancements. You can also download the dashboard as a PDF, PNG, or JPEG, embed it on a platform, or invite your team to collaborate.
Note: This is a Pro template. You'll need a Pro subscription on Mokkup to use and customize this dashboard wireframe. Upgrade anytime to unlock full access.
Waste Water Recycling and Reuse Asset Membrane & Filtration Lifecycle Dashboard Example
A plant engineer at a regional water authority opens this dashboard at the start of a monthly asset review to determine whether any membrane assets across their treatment facilities are degrading faster than scheduled. They filter by facility and membrane type, then examine the condition trajectory to assess whether normalized permeability and transmembrane pressure have moved in ways that signal accelerated fouling. With this membrane normalized permeability trend analysis dashboard view, teams can identify whether a performance dip is an isolated anomaly or part of a consistent downward trend that warrants intervention.
From that starting point, operations managers can compare annualized O&M costs by facility year-over-year and prioritize budget decisions around the highest-cost assets. The annualized O&M cost per membrane module analytics tool built into the facility chart helps them identify whether a high-cost site is also delivering lower performance — which often makes the case for earlier membrane swap-outs rather than continued maintenance investment. Teams conducting wastewater membrane replacement rate monitoring by root cause can distinguish between age-related degradation, fouling-driven failures, mechanical damage, and compliance-triggered swaps, each of which demands a different operational response.
The chemical cleaning frequency index table adds another layer of diagnostic clarity. By reviewing cleaning demand across membrane types and age bands, planners using the chemical cleaning frequency index for wastewater treatment assets can identify which asset cohorts are consuming disproportionate maintenance resources. Membranes showing high cleaning frequency alongside declining permeability become candidates for early retirement rather than continued treatment. The result is a team that approaches procurement and replacement planning with asset condition data rather than fixed schedules. Filtration asset end-of-life ratio tracking in recycling plants becomes a proactive planning input rather than a reactive trigger. Teams can align replacement procurement with quarterly end-of-life ratio projections, reduce emergency replacements, and sustain filtration compliance across the facility network.
How to Analyze Data in a Wastewater Recycling and Reuse Asset Membrane & Filtration Lifecycle Dashboard
Here is how you can analyze data from this dashboard:
- Use the Treatment Plant/Facility and Membrane Type filters to isolate performance data for specific asset segments
- Review the Chemical Cleaning Frequency Index table to identify membrane types with disproportionately high cleaning demand by age band
- Track the Membrane Condition Trajectory chart monthly to distinguish sustained performance decline from temporary variation
- Compare Annualized O&M Cost per Membrane Module across facilities year-over-year to identify cost outliers
- Examine the Replacement Rate Build Up by Root Cause chart to categorize failures as preventable or age-driven
- Monitor End-of-Life Asset Ratio by quarter to anticipate upcoming capital replacement requirements
- Use the Asset Age Band filter to segment performance analysis by membrane vintage and maintenance history
Benefits of a Wastewater Recycling and Reuse Asset Membrane & Filtration Lifecycle Dashboard
The following are the benefits of using this dashboard:
- Centralized Membrane Performance Visibility – Consolidate membrane health, operating costs, and compliance metrics into a single operational view across all treatment facilities for improved monitoring and decision-making.
- Early Detection of Membrane Degradation – Identify declining membrane performance before complete failure occurs, helping maintain treatment efficiency and prevent operational disruptions.
- Data-Driven Replacement Planning – Support cost-effective membrane replacement decisions by linking operations and maintenance (O&M) expenses with performance outcomes and asset condition.
- Reduced Unplanned Downtime – Analyze replacement and cleaning trends to uncover root causes of failures, enabling proactive maintenance and minimizing unexpected outages.
- Improved Budget Planning – Track quarterly end-of-life ratios and cost trends to improve forecasting accuracy, optimize maintenance budgets, and support long-term asset planning.
- Audit-Ready Compliance Reporting – Monitor filtration compliance rates at the facility level to ensure regulatory adherence and simplify audit preparation.
- Cross-Facility Performance Benchmarking – Compare membrane performance and maintenance metrics across facilities to prioritize resources, share best practices, and maximize operational efficiency.
KPIs to Track in a Wastewater Recycling and Reuse Asset Membrane & Filtration Lifecycle Dashboard
The following key KPIs can be tracked by using this dashboard:
- KPIs (Key Performance Indicators) are measurable values that reflect how effectively an asset or operation is performing against defined targets. In membrane filtration operations, KPIs signal health, cost efficiency, and compliance standing.
- Membrane Normalized Permeability — measures water flow rate through membranes adjusted for pressure and temperature, the primary indicator of membrane condition
- Transmembrane Pressure Rise Rate — tracks the rate at which pressure differential across a membrane increases, signaling fouling or structural degradation
- Membrane Replacement Rate — the percentage of membranes replaced within a defined period, reflecting overall asset attrition across the facility
- Chemical Cleaning Frequency Index — quantifies how often membranes require chemical cleaning, indicating fouling intensity and cleaning cycle effectiveness
- Cost per Membrane Module Annualized — the total annual operating and maintenance cost attributed to each membrane module across the facility
- Filtration Compliance Rate — the proportion of filtration outputs meeting regulatory and water quality compliance standards
- End-of-Life Asset Ratio — the percentage of membrane assets that have reached or exceeded their operational lifecycle threshold, driving replacement planning
Frequently Asked Questions
1. What types of facilities benefit most from the Waste Water Recycling and Reuse Asset Membrane & Filtration Lifecycle Dashboard?
Municipal wastewater treatment plants, industrial water recycling operations, and multi-facility utility networks gain the most value. Any operation running membrane-based filtration systems with multiple asset age cohorts benefits from centralized lifecycle visibility.
2. How does the dashboard support membrane replacement planning?
The Membrane Replacement Rate Build Up by Root Cause chart breaks down replacements by cause category, including age-related degradation, fouling-driven failure, and planned scheduled renewal. This helps planners distinguish between avoidable failures and expected end-of-life cycles when building procurement forecasts.
3. Can this dashboard be filtered by facility or membrane type?
Yes, the dashboard includes filters for Treatment Plant/Facility, Membrane Type, and Asset Age Band. These allow users to isolate performance data for specific asset segments and compare results across different operational configurations.