What is a Desalination Plant Operations & Performance Monitoring Dashboard?
A Desalination Plant Operations & Performance Monitoring Dashboard is a centralized analytics solution used to monitor water production, operational efficiency, energy usage, equipment reliability, and compliance performance across desalination facilities. It helps plant managers, utility operators, and engineering teams track historical operational KPIs from seawater treatment and reverse osmosis systems. This dashboard combines production trends, plant utilization, energy intensity, membrane cleaning performance, downtime causes, and water quality metrics into a single operational view. A desalination plant operations performance monitoring dashboard supports faster operational decisions by identifying process inefficiencies, equipment failures, and production losses before they impact output. It is widely used in seawater treatment facilities to improve operational reliability, optimize energy consumption, and maintain regulatory compliance. The dashboard also functions as a desalination plant operational efficiency analytics dashboard by helping teams analyze high-energy sections, monitor membrane fouling trends, and evaluate plant-wide operational stability. With integrated production and maintenance insights, organizations can improve throughput while reducing operating costs.
How to Create a Desalination Plant Operations & Performance Monitoring Dashboard
You don’t need to build your report from scratch; just start with a ready-to-use dashboard template from Mokkup. Add in your data and export it however you like. Here’s how to do it:
1. Create or Log in to Your Mokkup Account
Start by signing up on Mokkup.ai using your email. If you already have an account, just log in, and you’ll be good to go.
2. Choose and Customize Your Dashboard Template
Find the Desalination Plant Operations & Performance Monitoring Dashboard template in the Templates section. Use the drag-and-drop editor to adjust KPIs, edit filters, or add elements based on your data.
3. Export to Your BI Tool
Once your dashboard wireframe is ready, use the BI Tool Export feature to send it directly to Power BI or Tableau for further analysis and enhancements. You can also download the dashboard as a PDF, PNG, or JPEG, embed it on a platform, or invite your team to collaborate.
Note: This is a Pro template. You’ll need a Pro subscription on Mokkup to use and customize this dashboard wireframe. Upgrade anytime to unlock full access.
Desalination Plant Operations & Performance Monitoring Dashboard Example
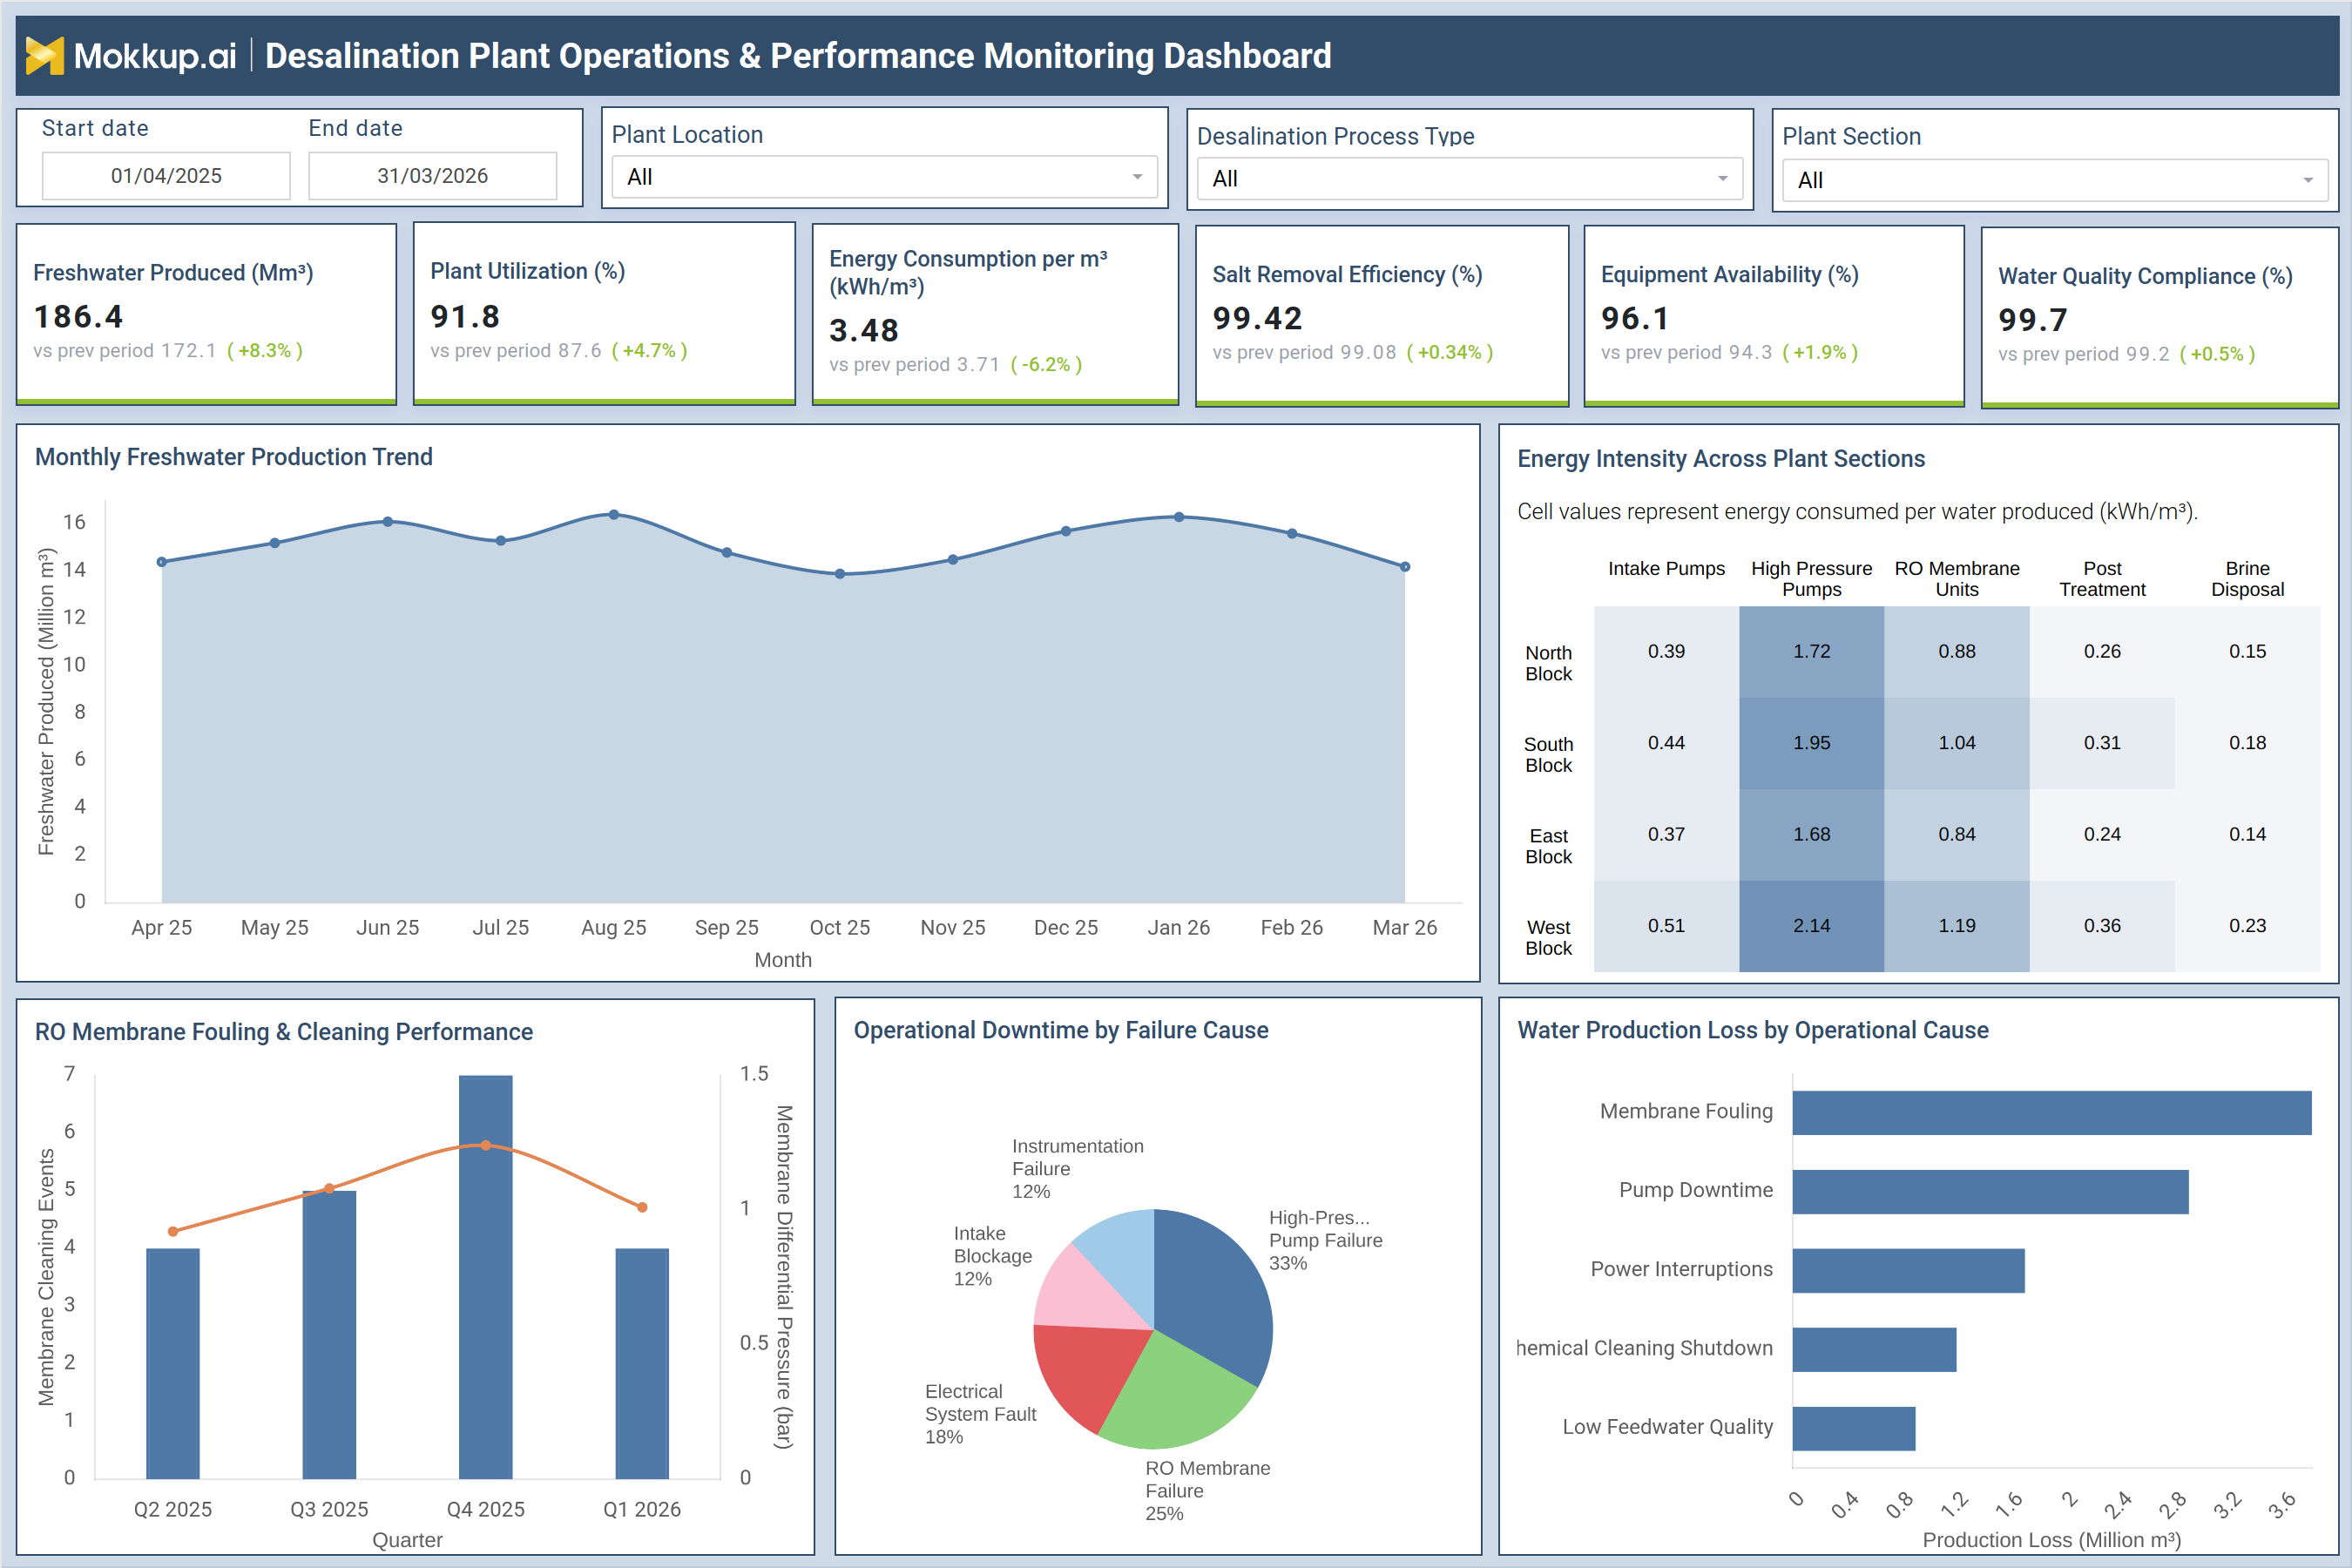
A typical seawater desalination performance monitoring dashboard includes KPI cards for freshwater produced, plant utilization, energy consumption per cubic meter, salt removal efficiency, equipment availability, and water quality compliance. In the provided dashboard example, operators can analyze monthly freshwater production trends alongside operational reliability indicators. The dashboard also includes an energy intensity heatmap showing energy consumed across plant sections such as intake pumps, high-pressure pumps, RO membrane units, post-treatment systems, and brine disposal units.
This helps engineering teams identify high-energy operational zones and optimize efficiency. The desalination plant production and energy analytics dashboard further tracks membrane fouling and cleaning performance, operational downtime causes, and production loss drivers. Operators can identify whether membrane fouling, pump downtime, electrical faults, or feedwater quality issues are affecting output. These insights support preventive maintenance planning and operational optimization. In addition, the dashboard acts as a reverse osmosis desalination performance dashboard by monitoring RO membrane cleaning frequency, membrane pressure differentials, and production loss caused by membrane inefficiencies. This helps improve membrane lifecycle management and operational continuity.
How to Analyze Data in Desalination Plant Operations & Performance Monitoring Dashboard
Here is how you can analyze data from this dashboard:
- Monitor freshwater production trends to identify production stability and seasonal demand patterns
- Compare plant utilization against production output to evaluate operational efficiency
- Analyze energy consumption per m³ to identify high-energy operational processes
- Review salt removal efficiency to ensure desalination quality targets are maintained
- Track equipment availability to identify reliability and maintenance issues
- Analyze water quality compliance trends to monitor regulatory performance
- Use energy intensity heatmaps to identify inefficient plant sections and optimize energy use
- Monitor RO membrane fouling trends to improve cleaning schedules and membrane efficiency
- Evaluate operational downtime causes to identify recurring equipment failures
- Track production losses caused by membrane fouling, pump failures, or feedwater quality issues
- Compare operational performance across plant locations and process types
- Identify operational bottlenecks affecting throughput and reliability
Benefits of Desalination Plant Operations & Performance Monitoring Dashboard
The following are the benefits of using this dashboard:
- Improves desalination plant operational visibility
- Reduces energy consumption and operational costs
- Enhances reverse osmosis process efficiency
- Supports predictive maintenance planning
- Minimizes operational downtime and failures
- Improves freshwater production consistency
- Helps maintain water quality compliance standards
- Enables faster operational decision-making
- Optimizes membrane cleaning and replacement schedules
- Improves plant reliability and asset utilization
- Identifies operational causes of production loss
- Supports data-driven desalination process optimization
KPIs to Track in Desalination Plant Operations & Performance Monitoring Dashboard
The following key KPIs can be tracked by using this Desalination operations KPI monitoring dashboard:
- Freshwater Produced (Mm³): Measures total freshwater generated by the desalination plant
- Plant Utilization (%): Tracks percentage utilization of desalination plant capacity
- Energy Consumption per m³ (kWh/m³): Measures energy consumed for each cubic meter of water produced
- Salt Removal Efficiency (%): Tracks desalination effectiveness in removing salt content
- Equipment Availability (%): Measures operational availability of plant equipment
- Water Quality Compliance (%): Tracks compliance with treated water quality standards
- Membrane Cleaning Events: Measures the frequency of RO membrane cleaning activities
- Membrane Differential Pressure (bar): Tracks membrane fouling and operational resistance levels
- Operational Downtime Incidents: Measures the number of plant downtime events
- Production Loss Volume (Million m³): Tracks water production losses caused by operational failures
- High-Pressure Pump Failure Rate (%): Measures the reliability of high-pressure pumping systems
- Energy Intensity by Plant Section: Tracks energy usage across desalination operational units
Frequently Asked Questions
1. What is the purpose of a desalination plant monitoring dashboard?
A desalination dashboard helps operators monitor production, energy efficiency, operational reliability, membrane performance, and water quality compliance in a centralized analytics platform.
2. Who uses a desalination operations dashboard?
Plant managers, operations teams, utility executives, maintenance engineers, and process optimization teams use these dashboards for operational monitoring and performance management.
3. Why is energy monitoring important in desalination plants?
Desalination is energy intensive. Monitoring energy consumption helps reduce operational costs and improve plant efficiency.