
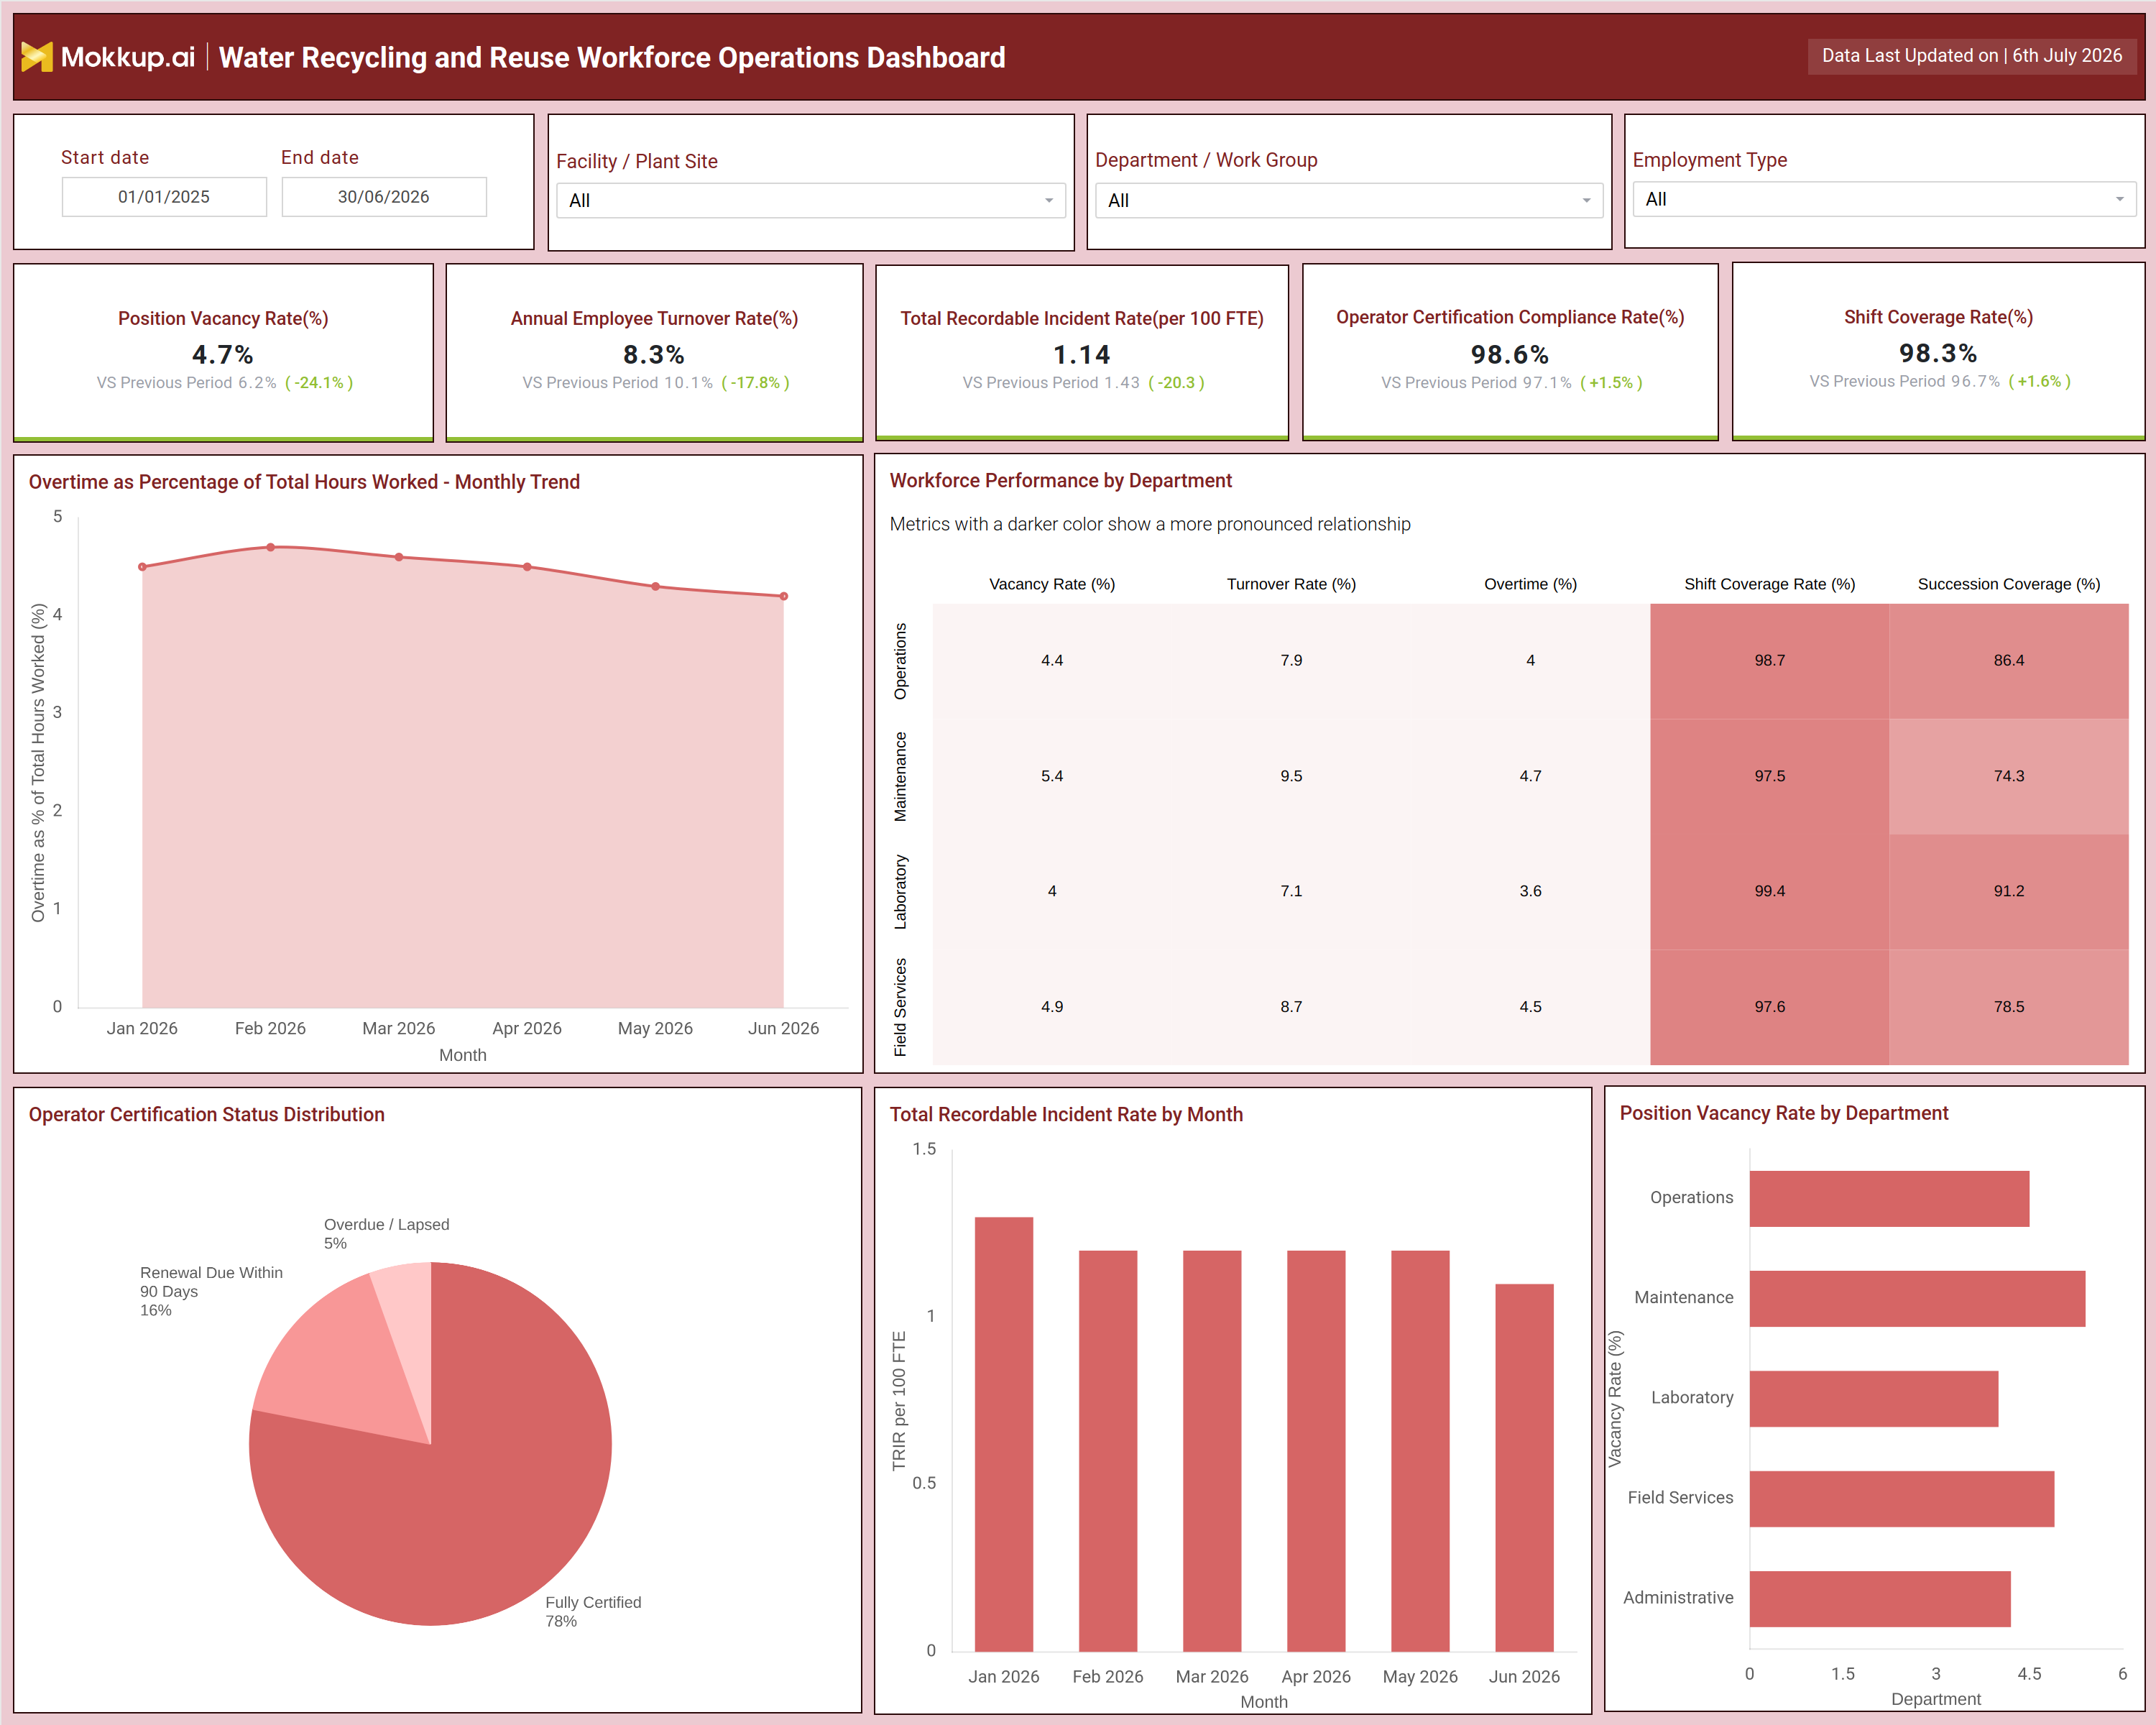
What is a Water Recycling and Reuse Workforce Operations Dashboard?
The Water Recycling and Reuse Workforce Operations Dashboard is a water recycling workforce operations dashboard built for utility HR teams, plant managers, and operations leaders who need visibility into staffing health, safety performance, and certification status across recycling and reuse facilities. It consolidates workforce indicators such as position vacancy, employee turnover, overtime load, and operator certification standing into a single view, filterable by facility or plant site, department or work group, employment type, and date range.
Rather than pulling data manually from HR systems, safety logs, and training records, teams get one dashboard that connects staffing capacity to operational risk. This makes it useful for organizations that need continuous total recordable incident rate monitoring dashboard visibility alongside workforce planning data, since safety outcomes and staffing gaps are often linked. The dashboard is built as a customizable template, so utilities can adapt filters and metrics to match their own facility structure and workforce categories.
How to Create a Water Recycling and Reuse Workforce Operations Dashboard
You don’t need to build your report from scratch; just start with a ready-to-use dashboard template from Mokkup. Add in your data and export it however you like. Here’s how to do it:
1. Create or Log in to Your Mokkup Account
Start by signing up on Mokkup.ai using your email. If you already have an account, just log in, and you'll be good to go.
2. Choose and Customize Your Dashboard Template
Find the Water Recycling and Reuse Workforce Operations Dashboard template in the Templates section. Use the drag-and-drop editor to adjust KPIs, edit filters, or add elements based on your data.
3. Export to Your BI Tool
Once your dashboard wireframe is ready, use the BI Tool Export feature to send it directly to Power BI or Tableau for further analysis and enhancements. You can also download the dashboard as a PDF, PNG, or JPEG, embed it on a platform, or invite your team to collaborate.
Note: This is a Pro template. You'll need a Pro subscription on Mokkup to use and customize this dashboard wireframe. Upgrade anytime to unlock full access.
Water Recycling and Reuse Workforce Operations Dashboard Example
A workforce operations manager at a water recycling facility opens this dashboard at the start of a reporting cycle to check whether staffing and safety metrics are holding steady across sites. The immediate question is usually the same: are any departments running short-staffed, and is that shortage showing up in overtime or safety numbers? Filtering by facility, department, or employment type lets the manager narrow the view to a single plant or work group without leaving the dashboard. From there, the manager can review workforce performance by department to compare vacancy, turnover, overtime, and coverage side by side, which makes it easy to spot which teams are under the most strain.
If overtime is climbing in one department while shift coverage is dropping, that combination signals a staffing risk before it turns into a compliance or safety issue. Certification status is reviewed alongside these figures so the team knows whether upcoming renewals will widen any coverage gaps. Trend charts covering incident rates and overtime over recent months help the manager judge whether current staffing decisions are improving or worsening safety outcomes. The result is a workforce view that ties staffing decisions directly to safety and compliance outcomes. Instead of reacting to a certification lapse or a spike in incidents after the fact, teams can plan hiring, training, and scheduling around the departments that need attention most, keeping recycling and reuse operations fully staffed and compliant.
How to Analyze Data in a Water Recycling and Reuse Workforce Operations Dashboard
Here is how you can analyze data from this dashboard:
- Filter by facility, department, or employment type to isolate performance for a specific site or work group.
- Compare vacancy and turnover figures across departments to identify where staffing gaps are widening.
- Track employee turnover rate tracking for water utilities data, month over month, to catch retention issues early.
- Review the overtime trend line alongside the shift coverage rate to see if short staffing is driving extra hours.
- Use the workforce performance by department table to spot which teams combine high turnover with low succession coverage.
- Check the operator certification compliance monitoring tool data to flag renewals due within 90 days before they lapse.
- Monitor the total recordable incident rate monitoring dashboard trends by month to judge whether safety performance is improving.
- Cross-check position vacancy rate tracking for utilities by department against incident and overtime data to prioritize hiring.
Benefits of a Water Recycling and Reuse Workforce Operations Dashboard
The following are the benefits of using this dashboard:
- Combines staffing, safety, and certification data in a single water recycling workforce operations dashboard instead of separate spreadsheets.
- Makes it faster to identify departments where vacancy or turnover is putting shift coverage at risk.
- Surfaces certification renewal gaps before they affect operator compliance.
- Helps safety and HR teams align on the departments most exposed to incident risk.
- Supports facility-level comparisons through consistent filtering across plant sites.
- Reduces manual reporting effort during workforce and safety reviews.
- Gives leadership a clear view of workforce performance by department dashboard data for planning decisions.
- Improves accountability by tracking trends over time rather than single-period snapshots.
KPIs to Track in a Water Recycling and Reuse Workforce Operations Dashboard
The following key KPIs can be tracked by using this dashboard:
- Position Vacancy Rate (%): share of open positions against total budgeted roles, used for position vacancy rate tracking for utilities across departments.
- Annual Employee Turnover Rate (%): measures how many employees leave over a year, a core input for employee turnover rate tracking for water utilities.
- Total Recordable Incident Rate (per 100 FTE): standardized measure of workplace safety incidents relative to workforce size.
- Operator Certification Compliance Rate (%): share of operators holding valid certifications required to run recycling and reuse equipment.
- Shift Coverage Rate (%): percentage of scheduled shifts filled without gaps, reflecting staffing reliability.
Frequently Asked Questions
1. What does the Water Recycling and Reuse Workforce Operations Dashboard track?
It tracks workforce capacity, safety, and compliance metrics across recycling and reuse facilities, including vacancy, turnover, overtime, certification status, and recordable incidents. As a water recycling workforce operations dashboard, it consolidates these figures into filterable views by facility, department, and employment type.
2. How does the dashboard support operator certification tracking?
The dashboard breaks down certification status into fully certified, renewal due, and overdue categories, giving teams an operator certification compliance monitoring tool that flags gaps before they affect plant operations. This helps prioritize training schedules ahead of certification deadlines.
3. Can the dashboard be customized for different facility structures?
Yes, filters for facility, department, and employment type can be adjusted to match a utility's own structure. Since it is built on a customizable template, teams can adapt views such as the total recordable incident rate monitoring dashboard to fit their specific reporting needs.