
What is a Water Purification Plant Process Efficiency Dashboard?
A water purification process efficiency dashboard is a data-driven analytics solution designed to monitor and optimize the performance of each stage in a water treatment plant. It provides visibility into critical treatment processes such as coagulation, flocculation, sedimentation, filtration, and disinfection. This water treatment plant process efficiency dashboard focuses on measuring how effectively resources such as chemicals, energy, and equipment are used to achieve desired water quality outcomes. It tracks operational KPIs, including treatment compliance, turbidity removal, chemical dosing efficiency, and energy consumption. Using a water purification process performance analytics dashboard, utilities can identify inefficiencies across treatment stages, reduce operational costs, and improve plant throughput. It also functions as a water treatment process optimization dashboard, enabling operators to balance process efficiency with regulatory compliance and output targets.
How to Create a Water Purification Plant Process Efficiency Dashboard
You don't need to build your report from scratch, just start with a ready-to-use dashboard template from Mokkup. Add in your data and export it however you like. Here's how to do it:
1. Create or Log in to Your Mokkup Account
Start by signing up on Mokkup.ai using your email. If you already have an account, just log in, and you'll be good to go.
2. Choose and Customize Your Dashboard Template
Find the Water Purification Plant Process Efficiency Dashboard template in the Templates section. Use the drag-and-drop editor to adjust KPIs, edit filters, or add elements based on your data.
3. Export to Your BI Tool
Once your dashboard wireframe is ready, use the BI Tool Export feature to send it directly to Power BI or Tableau for further analysis and enhancements. You can also download the dashboard as a PDF, PNG, or JPEG, embed it on a platform, or invite your team to collaborate.
Note: This is a Pro template. You'll need a Pro subscription on Mokkup to use and customize this dashboard wireframe. Upgrade anytime to unlock full access.
Water Purification Plant Process Efficiency Dashboard Example
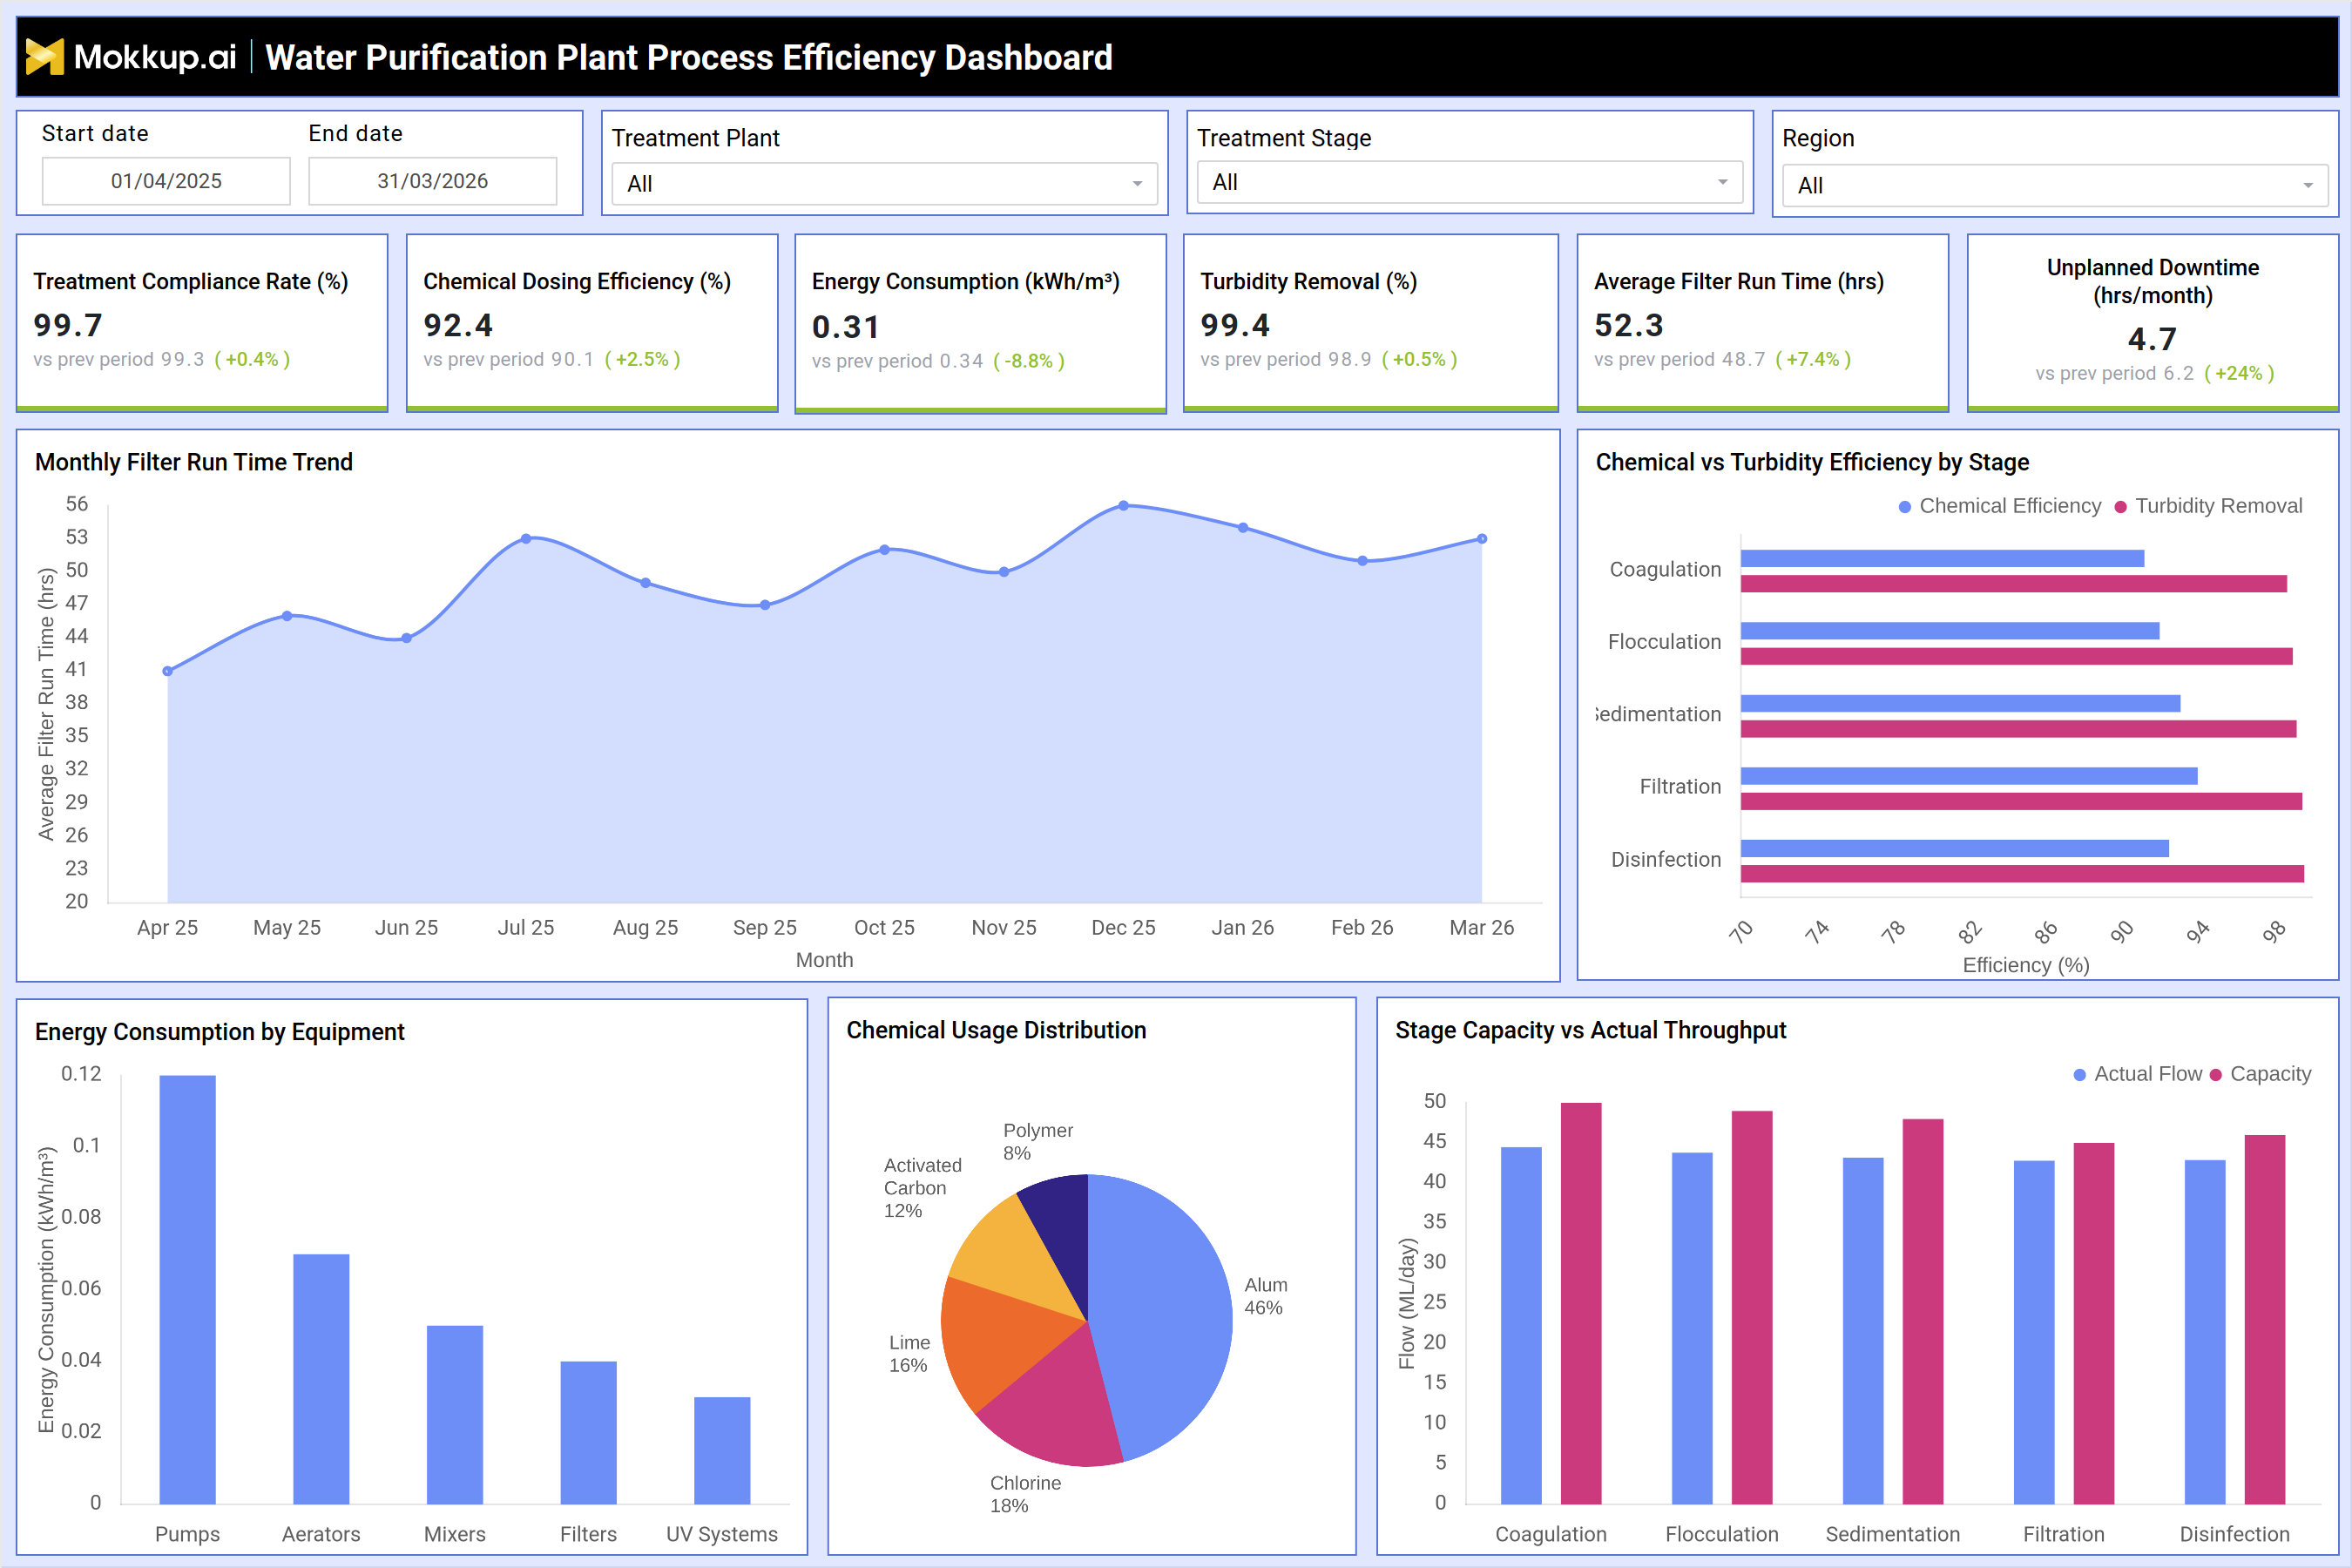
A typical water purification plant efficiency monitoring dashboard provides a detailed breakdown of process performance across all treatment stages. For example, the dashboard shows a treatment compliance rate of 99.7%, indicating strong adherence to water quality standards. Chemical dosing efficiency stands at 92.4%, reflecting optimized chemical usage. Energy consumption is measured at 0.31 kWh/m³, showing efficient energy utilization across operations. Turbidity removal efficiency is at 99.4%, confirming effective impurity removal. The average filter run time is 52.3 hours, indicating stable filtration performance. However, unplanned downtime is recorded at 4.7 hours per month, highlighting an area for operational improvement.
The monthly filter run time trend shows fluctuations, helping operators identify periods of reduced efficiency. The comparison of chemical efficiency versus turbidity removal across treatment stages reveals performance gaps between coagulation, flocculation, sedimentation, filtration, and disinfection. Energy consumption by equipment indicates pumps as the highest energy consumers, followed by aerators and mixers. Chemical usage distribution highlights alum as the most used chemical, followed by chlorine and lime. Stage capacity versus actual throughput shows slight underutilization across treatment stages, indicating opportunities for capacity optimization. This example demonstrates how the water treatment process KPI monitoring dashboard supports performance improvement and operational efficiency.
How to Analyze Data in a Water Purification Plant Process Efficiency Dashboard
Here is how you can analyze data from this dashboard:
- Monitor treatment compliance rate: Ensure regulatory adherence by tracking how consistently the treatment process meets required standards.
- Track chemical dosing efficiency: Evaluate chemical usage optimization by measuring how effectively chemicals are used during treatment.
- Analyze energy consumption (kWh/m³): Assess operational efficiency by monitoring energy usage per unit of treated water.
- Evaluate turbidity removal: Measure treatment effectiveness by analyzing how well suspended particles are removed from water.
- Monitor average filter run time (hrs): Assess filtration stability by tracking how long filters operate before requiring cleaning or backwashing.
- Track unplanned downtime (hrs/month): Identify operational disruptions by monitoring unexpected downtime occurrences.
- Analyze monthly filter run time trends: Detect performance fluctuations by reviewing how filter efficiency changes over time.
- Compare chemical vs turbidity efficiency by stage: Identify process gaps by evaluating how chemical usage correlates with turbidity removal at each stage.
- Review energy consumption by equipment: Identify high-energy assets by analyzing which equipment consumes the most power.
- Analyze chemical usage distribution: Optimize chemical consumption by understanding how chemicals are used across different processes.
- Evaluate stage capacity vs actual throughput: Improve plant utilization by comparing designed capacity with actual operational output.
Benefits of Water Purification Plant Process Efficiency Dashboard
The following are the benefits of using this dashboard:
- Provides end-to-end visibility into treatment process performance: Delivers a comprehensive view of all treatment stages, enabling better monitoring and control of overall process performance.
- Improves chemical dosing efficiency and reduces wastage: Ensures optimal use of chemicals by minimizing overuse and improving dosing accuracy.
- Enhances energy efficiency and lowers operational costs: Reduces energy consumption across processes, leading to cost savings and more sustainable operations.
- Supports compliance with water quality standards: Helps maintain adherence to regulatory requirements by consistently monitoring treatment quality.
- Identifies inefficiencies across treatment stages: Highlights performance gaps and bottlenecks within different stages of the treatment process.
- Reduces unplanned downtime through proactive monitoring: Detects potential issues early, enabling preventive actions to avoid unexpected disruptions.
- Optimizes plant capacity utilization and throughput: Ensures maximum use of available capacity while maintaining efficient output levels.
- Enables data-driven decision-making for process optimization: Provides actionable insights that support informed decisions to improve operational performance.
- Improves overall plant reliability and performance: Enhances consistency and dependability of plant operations over time.
- Supports continuous operational improvement: Drives ongoing enhancements by leveraging performance data and monitoring trends.
KPIs to Track in Water Purification Plant Process Efficiency Dashboard
The following key KPIs can be tracked by using this dashboard:
- Treatment Compliance Rate (%) – Measures adherence to water quality standards
- Chemical Dosing Efficiency (%) – Indicates effectiveness of chemical usage
- Energy Consumption (kWh/m³) – Tracks energy used per unit of treated water
- Turbidity Removal (%) – Measures efficiency of impurity removal
- Average Filter Run Time (hrs) – Indicates filtration performance stability
- Unplanned Downtime (hrs/month) – Tracks unexpected operational interruptions
Frequently Asked Questions
1. What is the purpose of a water purification process efficiency dashboard?
It helps monitor treatment performance, optimize resource usage, and ensure compliance with water quality standards.
2. How does this dashboard improve operational efficiency?
The water treatment process optimization dashboard identifies inefficiencies in chemical usage, energy consumption, and equipment performance, enabling corrective actions.
3. Why is turbidity removal an important metric?
Turbidity removal indicates how effectively impurities are removed, directly impacting water quality compliance.