
What is a Water Purification Plant Operations Performance Dashboard?
A water purification plant operations dashboard is a centralized analytics tool used to monitor treatment efficiency, operational performance, energy usage, and compliance across water treatment facilities. It consolidates data from multiple process stages, such as intake, filtration, disinfection, and distribution, to provide an operational view. This water treatment plant performance monitoring dashboard tracks critical metrics, including treated water volume, energy consumption, downtime, regulatory compliance, and safety performance. It helps plant operators and managers ensure that water quality standards are met while maintaining operational efficiency. Using a water purification operations analytics dashboard, utilities can identify inefficiencies in treatment processes, monitor energy costs, and optimize plant performance. It also acts as a water treatment efficiency performance dashboard, enabling data-driven decisions to reduce operational costs and improve service reliability.
How to Create a Water Purification Plant Operations Performance Dashboard
You don't need to build your report from scratch, just start with a ready-to-use dashboard template from Mokkup. Add in your data and export it however you like. Here's how to do it:
1. Create or Log in to Your Mokkup Account
Start by signing up on Mokkup.ai using your email. If you already have an account, just log in, and you'll be good to go.
2. Choose and Customize Your Dashboard Template
Find the Water Purification Plant Operations Performance Dashboard template in the Templates section. Use the drag-and-drop editor to adjust KPIs, edit filters, or add elements based on your data.
3. Export to Your BI Tool
Once your dashboard wireframe is ready, use the BI Tool Export feature to send it directly to Power BI or Tableau for further analysis and enhancements. You can also download the dashboard as a PDF, PNG, or JPEG, embed it on a platform, or invite your team to collaborate.
Note: This is a Pro template. You'll need a Pro subscription on Mokkup to use and customize this dashboard wireframe. Upgrade anytime to unlock full access.
Water Purification Plant Operations Performance Dashboard Example
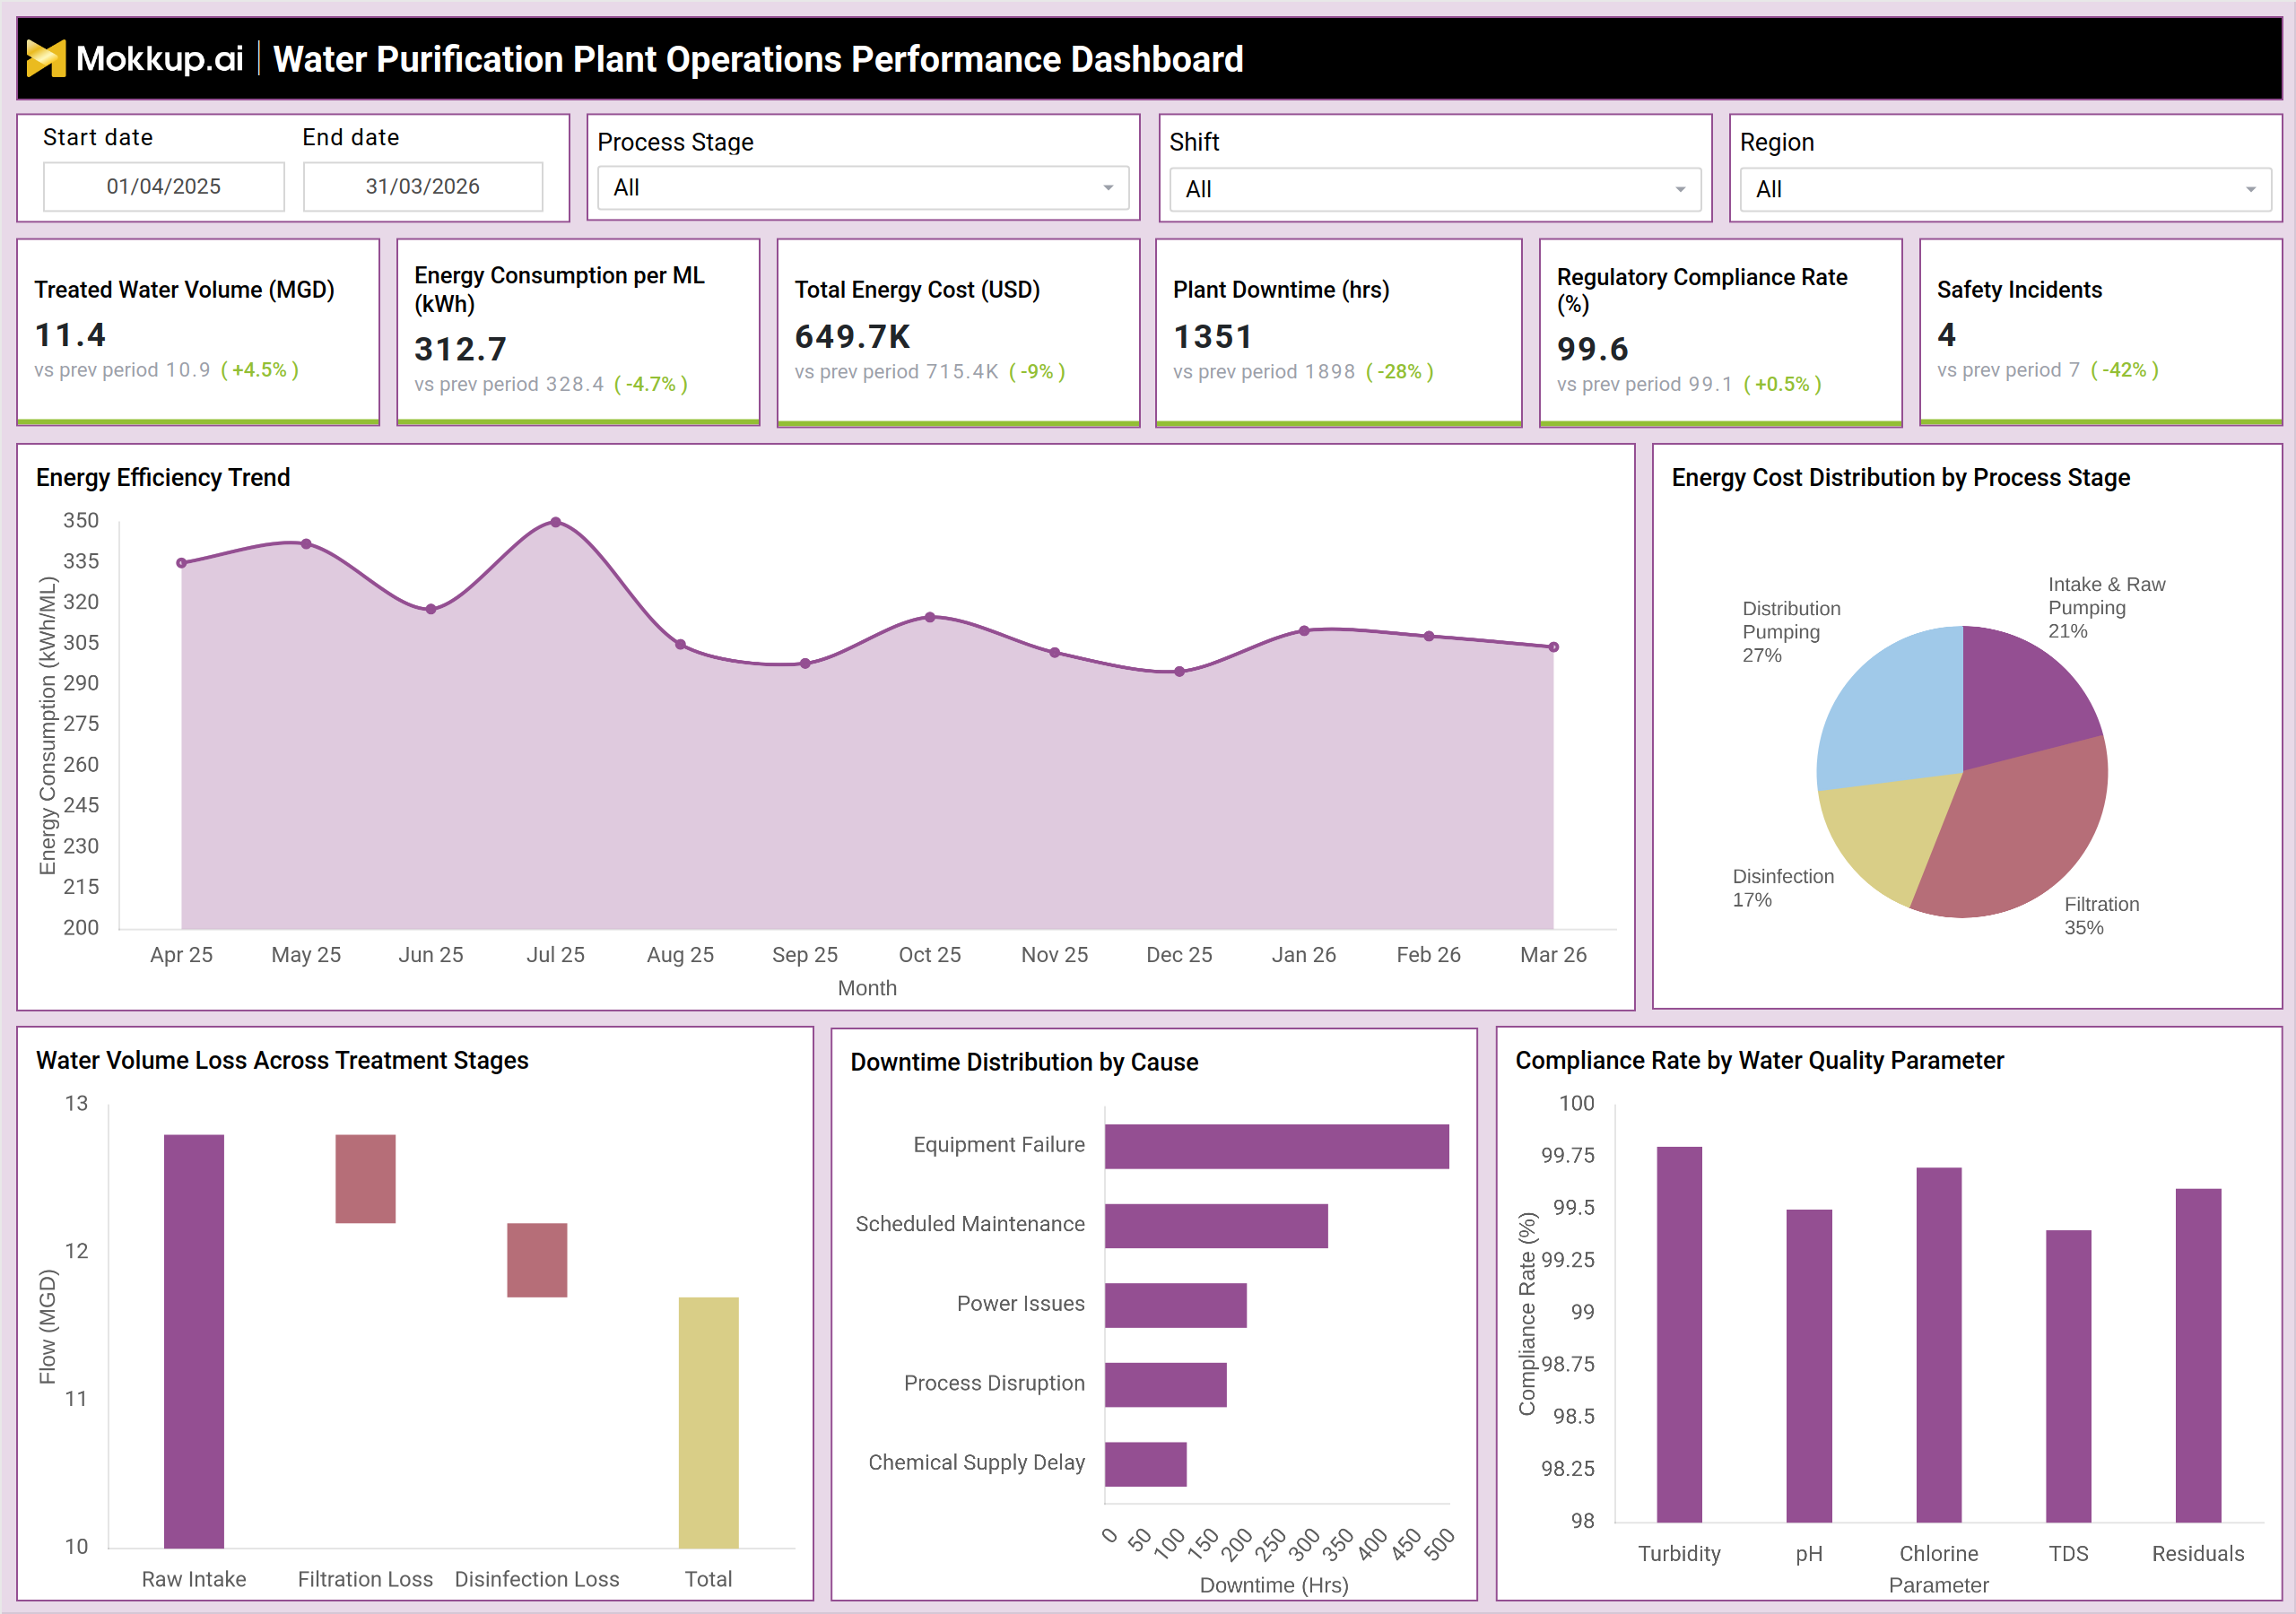
A typical water treatment plant operations analytics dashboard provides a comprehensive overview of plant performance across operational, energy, and compliance dimensions. For example, the dashboard shows treated water volume at 11.4 MGD, indicating stable production. Energy consumption per ML is 312.7 kWh, reflecting efficient energy usage compared to previous periods. Total energy cost is 649.7K USD, showing cost optimization. Plant downtime is recorded at 1,351 hours, which is lower than the previous period, indicating improved operational reliability.
Regulatory compliance rate is at 99.6%, ensuring adherence to water quality standards. Safety incidents are reduced to 4, highlighting improved workplace safety. Energy efficiency trends show fluctuations in consumption across months, helping identify high-usage periods. Energy cost distribution across process stages indicates filtration as the most energy-intensive stage, followed by distribution pumping and raw intake. Water volume loss across treatment stages highlights losses during filtration and disinfection processes. Downtime distribution shows equipment failure and scheduled maintenance as major contributors. Compliance rates across parameters such as turbidity, pH, chlorine, and TDS remain consistently high. This example demonstrates how the water purification plant KPI monitoring dashboard helps utilities optimize performance, control costs, and maintain compliance.
How to Analyze Data in Water Purification Plant Operations Performance Dashboard
Here is how you can analyze data from this dashboard:
- Monitor treated water volume (MGD): Assess plant output capacity by tracking the processed water volume, ensuring production targets are consistently met.
- Track energy consumption per ML: Evaluate operational efficiency by measuring energy use per unit of water treated.
- Analyze total energy cost (USD): Identify cost-saving opportunities by reviewing overall energy expenditure and spotting areas of excessive spend.
- Monitor plant downtime (hrs): Detect operational disruptions by tracking how often and how long the plant is non-operational.
- Evaluate regulatory compliance rate: Ensure adherence to water quality standards by measuring compliance against regulatory benchmarks.
- Track safety incidents: Assess workplace safety performance by monitoring the frequency and severity of safety-related events.
- Analyze energy efficiency trends: Identify peak consumption periods and inefficiencies by studying energy usage patterns over time.
- Review energy cost distribution by process stage: Locate high-cost operations by breaking down energy expenses across different stages of the treatment process.
- Monitor water volume loss across treatment stages: Reduce inefficiencies by identifying where water losses occur during treatment.
- Analyze downtime distribution by cause: Identify root issues by categorizing downtime based on underlying reasons such as equipment failure or maintenance.
- Evaluate compliance by water quality parameters: Maintain treatment standards by assessing compliance across specific water quality metrics.
Benefits of Water Purification Plant Operations Performance Dashboard
The following are the benefits of using this dashboard:
- Provides visibility into plant operations and performance: Offers a clear, real-time view of plant activities and key performance metrics, enabling better operational oversight.
- Improves energy efficiency and reduces operational costs: Optimizes energy usage across processes, helping lower overall operating expenses.
- Enhances compliance with water quality and regulatory standards: Ensures that treatment processes consistently meet required quality benchmarks and regulatory requirements.
- Reduces downtime through proactive monitoring and maintenance: Minimizes disruptions by identifying potential issues early and enabling timely maintenance actions.
- Identifies inefficiencies in treatment processes: Highlights bottlenecks and performance gaps, allowing targeted process improvements.
- Improves safety performance and incident management: Strengthens workplace safety by tracking incidents and implementing preventive measures.
- Enables data-driven decision-making for plant optimization: Supports informed decisions using data insights to improve overall plant performance.
- Enhances resource utilization across treatment stages: Ensures optimal use of energy, water, and workforce across all stages of treatment.
- Supports continuous improvement in water treatment operations: Drives ongoing enhancements through consistent monitoring and performance evaluation.
- Strengthens reliability and service delivery: Improves consistency in operations, ensuring dependable water supply and service quality.
KPIs to Track in Water Purification Plant Operations Performance Dashboard
The following key KPIs can be tracked by using this dashboard:
- Treated Water Volume (MGD) – Measures total water processed by the plant
- Energy Consumption per ML (kWh) – Indicates energy efficiency of operations
- Total Energy Cost (USD) – Tracks overall energy expenditure
- Plant Downtime (hrs) – Measures total time of operational interruptions
- Regulatory Compliance Rate (%) – Indicates adherence to water quality standards
- Safety Incidents – Tracks the number of workplace safety events
Frequently Asked Questions
1. Why is a water purification plant operations dashboard important?
It provides a centralized view of operational, energy, and compliance metrics, helping utilities optimize performance and ensure a safe water supply.
2. How does this dashboard improve efficiency?
The water treatment efficiency performance dashboard identifies high energy usage, process inefficiencies, and downtime, enabling targeted improvements.
3. What causes high energy consumption in water treatment plants?
Energy-intensive stages such as filtration and pumping are the main contributors to high energy usage.