
What is a Water Purification Plant Financial Performance Dashboard?
A water purification plant financial performance dashboard is a data analytics solution used to monitor cost, revenue, and profitability across water treatment operations. It provides a consolidated view of financial KPIs such as treatment cost, revenue generation, cost recovery, and operational efficiency. This water treatment plant financial analytics dashboard helps utilities track how effectively financial resources are utilized in water purification processes. It connects operational data such as treatment volume and energy usage with financial outcomes, enabling better cost control and revenue optimization. Using a water purification financial performance monitoring dashboard, utilities can identify cost drivers, analyze revenue streams, and measure financial sustainability. It also functions as a water treatment cost and revenue analytics dashboard, helping decision-makers improve margins, reduce losses, and optimize financial performance across treatment plants.
How to Create a Water Purification Plant Financial Performance Dashboard
You don't need to build your report from scratch, just start with a ready-to-use dashboard template from Mokkup. Add in your data and export it however you like. Here's how to do it:
1. Create or Log in to Your Mokkup Account
Start by signing up on Mokkup.ai using your email. If you already have an account, just log in, and you'll be good to go.
2. Choose and Customize Your Dashboard Template
Find the Water Purification Plant Financial Performance Dashboard template in the Templates section. Use the drag-and-drop editor to adjust KPIs, edit filters, or add elements based on your data.
3. Export to Your BI Tool
Once your dashboard wireframe is ready, use the BI Tool Export feature to send it directly to Power BI or Tableau for further analysis and enhancements. You can also download the dashboard as a PDF, PNG, or JPEG, embed it on a platform, or invite your team to collaborate.
Note: This is a Pro template. You'll need a Pro subscription on Mokkup to use and customize this dashboard wireframe. Upgrade anytime to unlock full access.
Water Purification Plant Financial Performance Dashboard Example
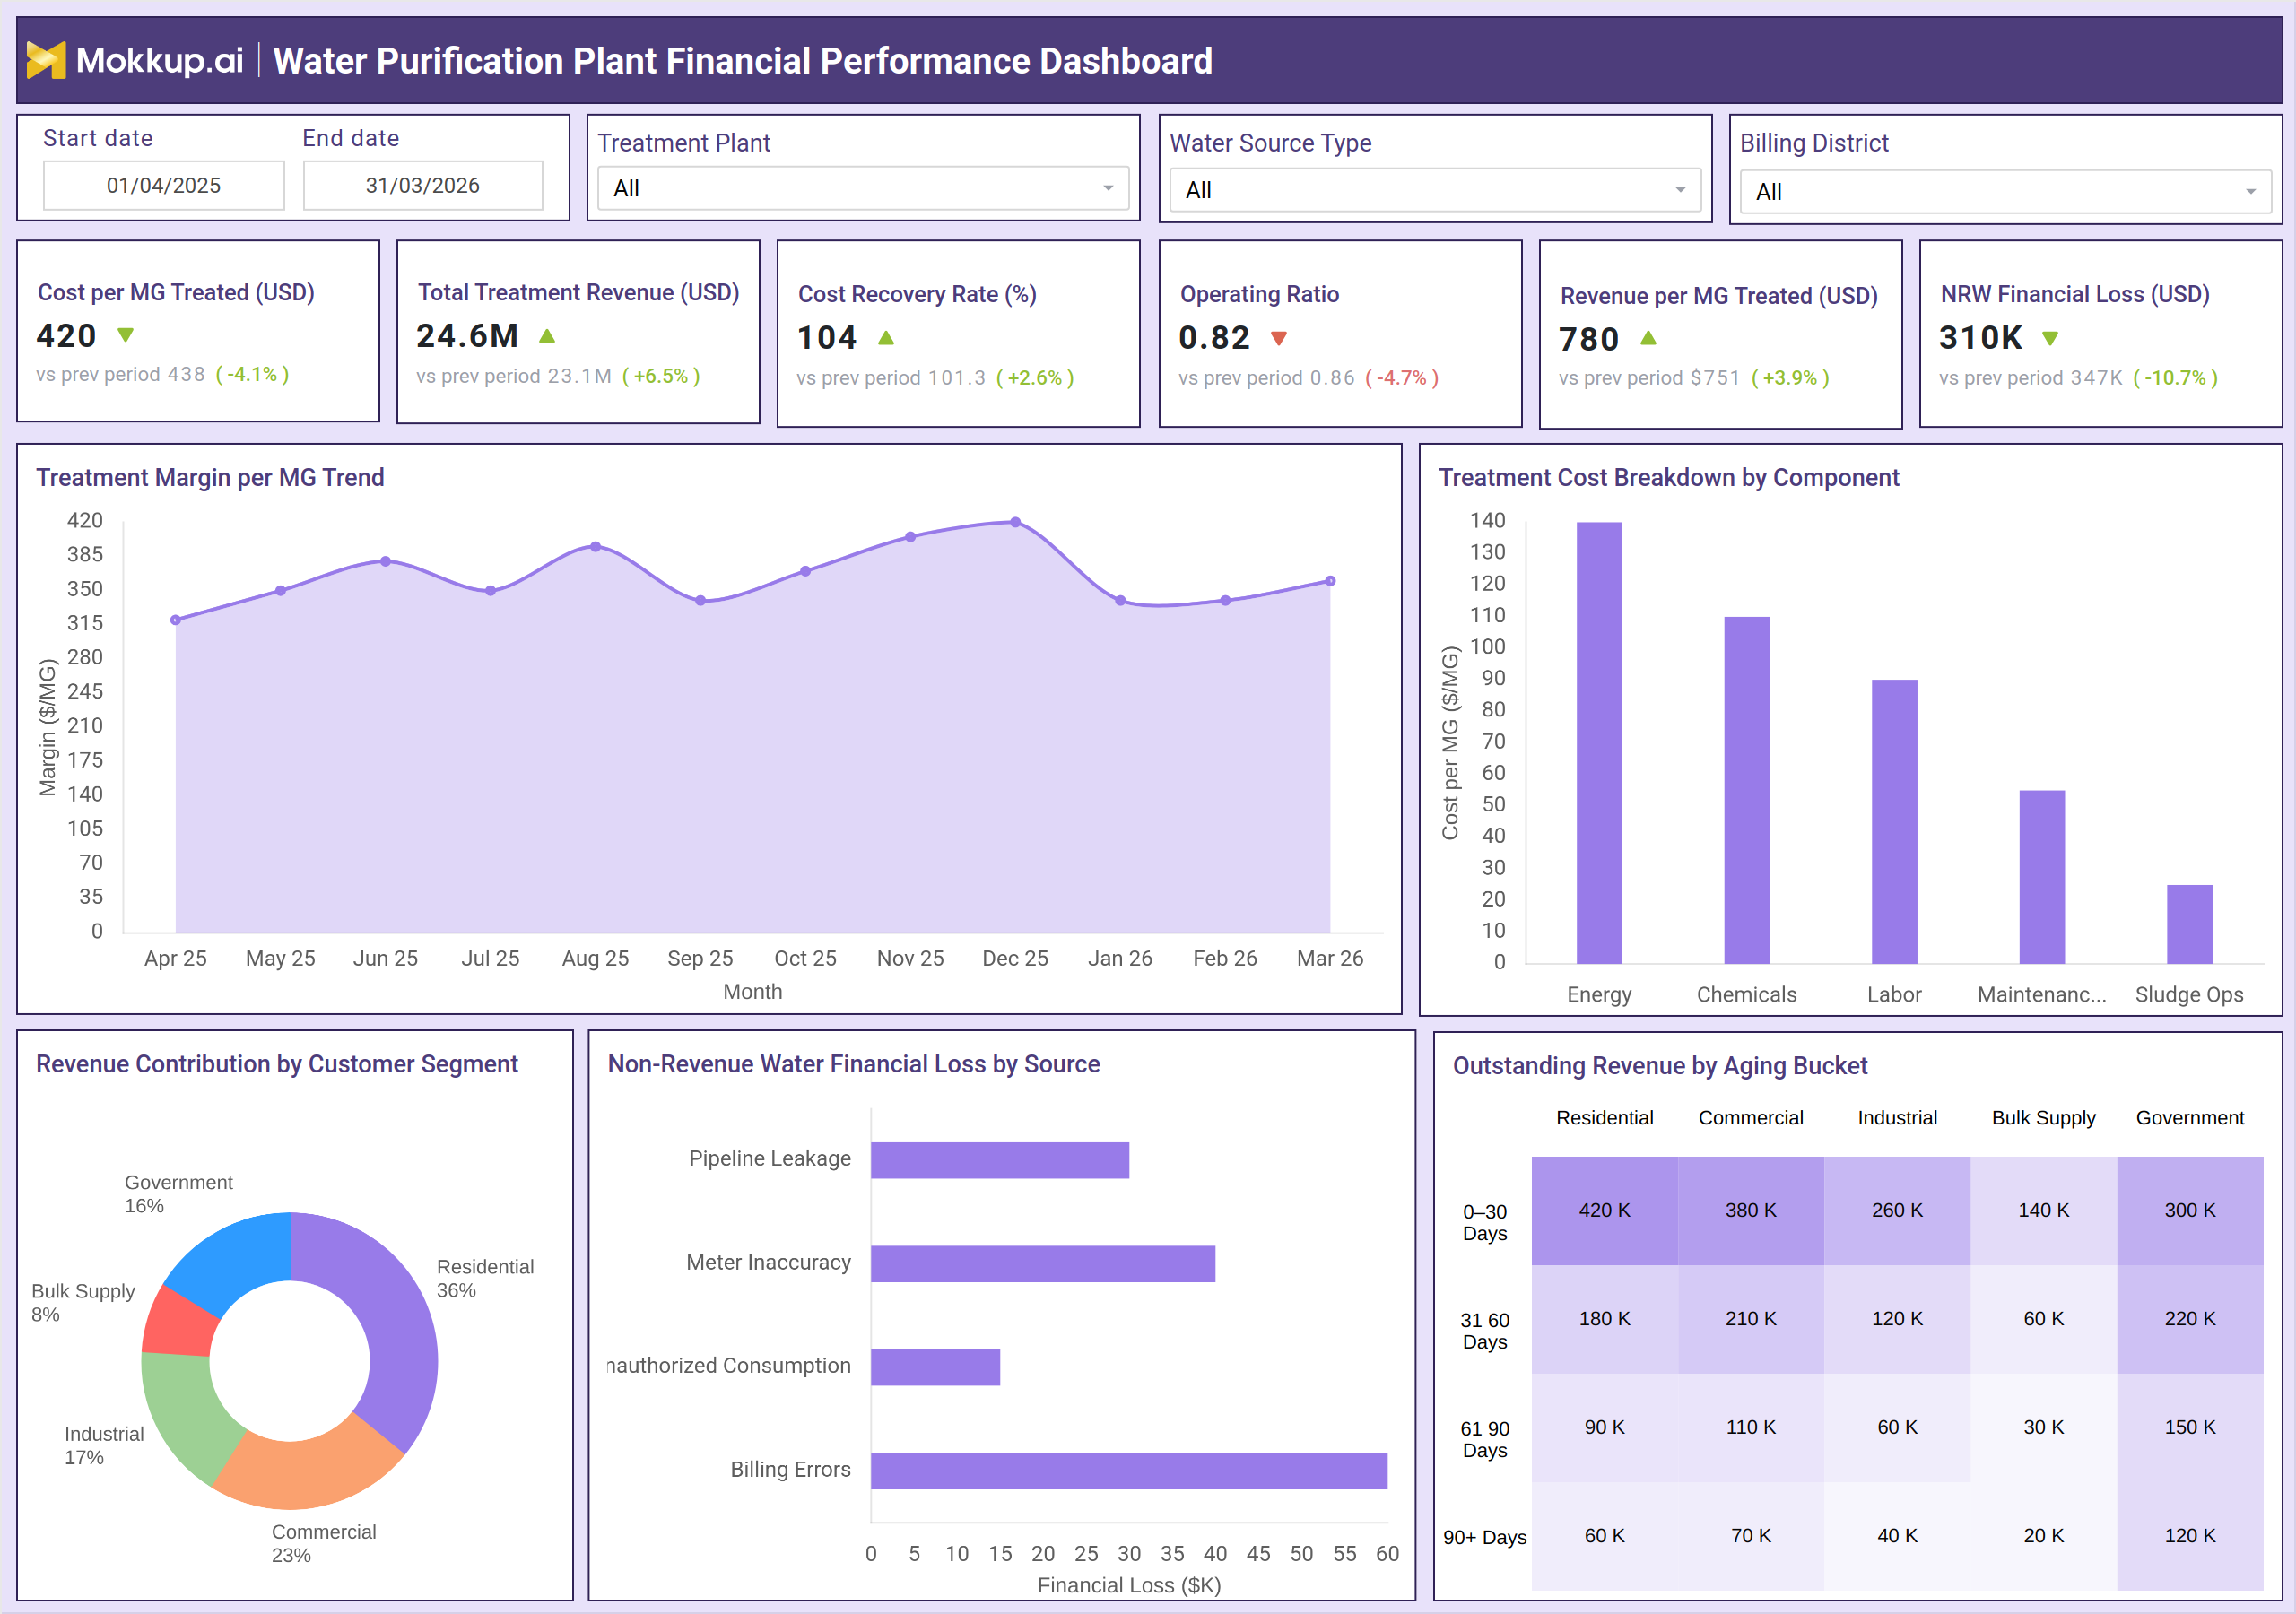
A typical water treatment financial KPI monitoring dashboard provides a comprehensive breakdown of financial performance across treatment operations. For example, the dashboard shows cost per MG treated at 420 USD, indicating efficient cost management compared to the previous period. Total treatment revenue stands at 24.6M USD, reflecting growth in revenue generation. The cost recovery rate is 104%, showing that revenue exceeds operational costs. The operating ratio is 0.82, indicating improved operational efficiency. Revenue per MG treated is 780 USD, highlighting strong revenue generation per unit. NRW (Non-Revenue Water) financial loss is 310K USD, showing reduced financial leakage.
The treatment margin per MG trend shows fluctuations across months, helping identify periods of high profitability. Cost breakdown by component indicates energy as the largest cost driver, followed by chemicals and labor. Revenue contribution by customer segment shows residential and commercial users contributing the highest share. NRW financial loss by source highlights billing errors and meter inaccuracies as major contributors. Outstanding revenue aging analysis shows a significant portion of receivables in the 0–30 days bucket, but also identifies overdue payments in the 60+ days category. This example demonstrates how the water purification plant cost optimization dashboard supports financial planning and performance improvement.
How to Analyze Data in a Water Purification Plant Financial Performance Dashboard
Here is how you can analyze data from this dashboard:
- Monitor cost per MG treated (USD): Evaluate treatment cost efficiency by tracking the cost incurred to process each million gallons of water.
- Track total treatment revenue (USD): Assess revenue growth by monitoring total income generated from water treatment operations.
- Analyze cost recovery rate: Measure financial sustainability by comparing revenue against operational costs to ensure adequate cost recovery.
- Evaluate operating ratio: Assess operational cost efficiency by analyzing the proportion of operating expenses to total revenue.
- Monitor revenue per MG treated (USD): Understand unit profitability by evaluating how much revenue is generated per unit of treated water.
- Track NRW financial loss (USD): Identify revenue leakage by measuring financial losses due to non-revenue water (NRW).
- Analyze treatment margin trends: Detect profitability fluctuations by reviewing changes in treatment margins over time.
- Review cost breakdown by component: Identify major cost drivers by analyzing expenses across categories such as energy, labor, and maintenance.
- Evaluate revenue contribution by customer segment: Understand revenue sources by examining which customer groups contribute most to total revenue.
- Analyze NRW loss by source: Identify root causes of financial losses by breaking down NRW into sources such as leaks, theft, or metering issues.
- Monitor outstanding revenue aging: Manage receivables and cash flow by tracking overdue payments and their aging profile.
Benefits of Water Purification Plant Financial Performance Dashboard
The following are the benefits of using this dashboard:
- Provides comprehensive financial visibility: Offers a consolidated view of costs, revenues, and profitability across all treatment operations in one place.
- Improves cost efficiency and reduces operational expenses: Identifies cost drivers and inefficiencies, enabling targeted cost reduction strategies across treatment processes.
- Enhances revenue optimization and cost recovery: Tracks revenue streams and recovery rates, helping utilities ensure financial sustainability.
- Reduces non-revenue water financial losses: Identifies and quantifies NRW losses by source, enabling targeted interventions to reduce revenue leakage.
- Supports data-driven financial planning: Enables informed financial decisions by connecting operational performance data with financial outcomes.
- Improves cash flow management: Tracks outstanding revenue aging to help utilities manage receivables and reduce overdue payment risk.
- Enables benchmarking across treatment plants: Compares financial performance across facilities to identify best practices and improvement opportunities.
KPIs to Track in Water Purification Plant Financial Performance Dashboard
The following key KPIs can be tracked by using this dashboard:
- Cost per MG Treated (USD) – Measures cost efficiency per unit of water treated
- Total Treatment Revenue (USD) – Tracks total revenue generated from operations
- Cost Recovery Rate (%) – Indicates whether revenue covers operational costs
- Operating Ratio – Measures operational efficiency relative to revenue
- Revenue per MG Treated (USD) – Tracks revenue generated per unit of water
- NRW Financial Loss (USD) – Measures revenue loss due to non-revenue water
Frequently Asked Questions
1. Why is a financial performance dashboard important for water treatment plants?
It provides visibility into costs, revenue, and profitability, helping utilities maintain financial sustainability.
2. How does this dashboard improve cost efficiency?
The water treatment cost and revenue analytics dashboard identifies cost drivers and inefficiencies, enabling targeted cost reduction strategies.
3. What is the cost recovery rate in water utilities?
It measures whether the revenue generated is sufficient to cover operational costs. A value above 100% indicates profitability.