What is a Natural Gas Distribution Financial Performance Dashboard
A Natural Gas Distribution Financial Performance Dashboard is a centralized analytics solution designed to monitor revenue, margins, costs, and operational efficiency across natural gas utilities. It consolidates financial and operational data into a single natural gas utilities financial KPI dashboard, enabling management to track profitability, cost structure, and working capital performance.
This dashboard wireframe typically includes revenue trends, gross margin, EBITDA margin, cost per SCM, days sales outstanding, and unaccounted gas percentage. It also integrates procurement analytics through a natural gas procurement cost distribution dashboard and operational cost insights using a natural gas network operations cost dashboard. By combining financial and operational KPIs, the dashboard supports performance benchmarking, cost optimization, and regulatory compliance across gas distribution networks.
How to Create a Natural Gas Distribution Financial Performance Dashboard
You don’t need to build your report from scratch, just start with a ready-to-use Natural Gas Distribution Financial Performance dashboard template from Mokkup. Add in your data and export it however you like. Here’s how to do it:
1. Create or Log in to Your Mokkup Account
Start by signing up on Mokkup.ai using your email. If you already have an account, just log in, and you’ll be good to go.
2. Choose and Customize Your Dashboard Template
Find the Natural Gas Distribution Financial Performance Dashboard template in the Templates section. Use the drag-and-drop editor to adjust KPIs, edit filters, or add elements based on your data.
3. Export to Your BI Tool
Once your dashboard wireframe is ready, use the BI Tool Export feature to send it directly to Power BI or Tableau for further analysis and enhancements. You can also download the dashboard as a PDF, PNG, or JPEG, embed it on a platform, or invite your team to collaborate.
Note: This is a Pro template. You’ll need a Pro subscription on Mokkup to use and customize this dashboard wireframe. Upgrade anytime to unlock full access.
Natural Gas Distribution Financial Performance Dashboard Example
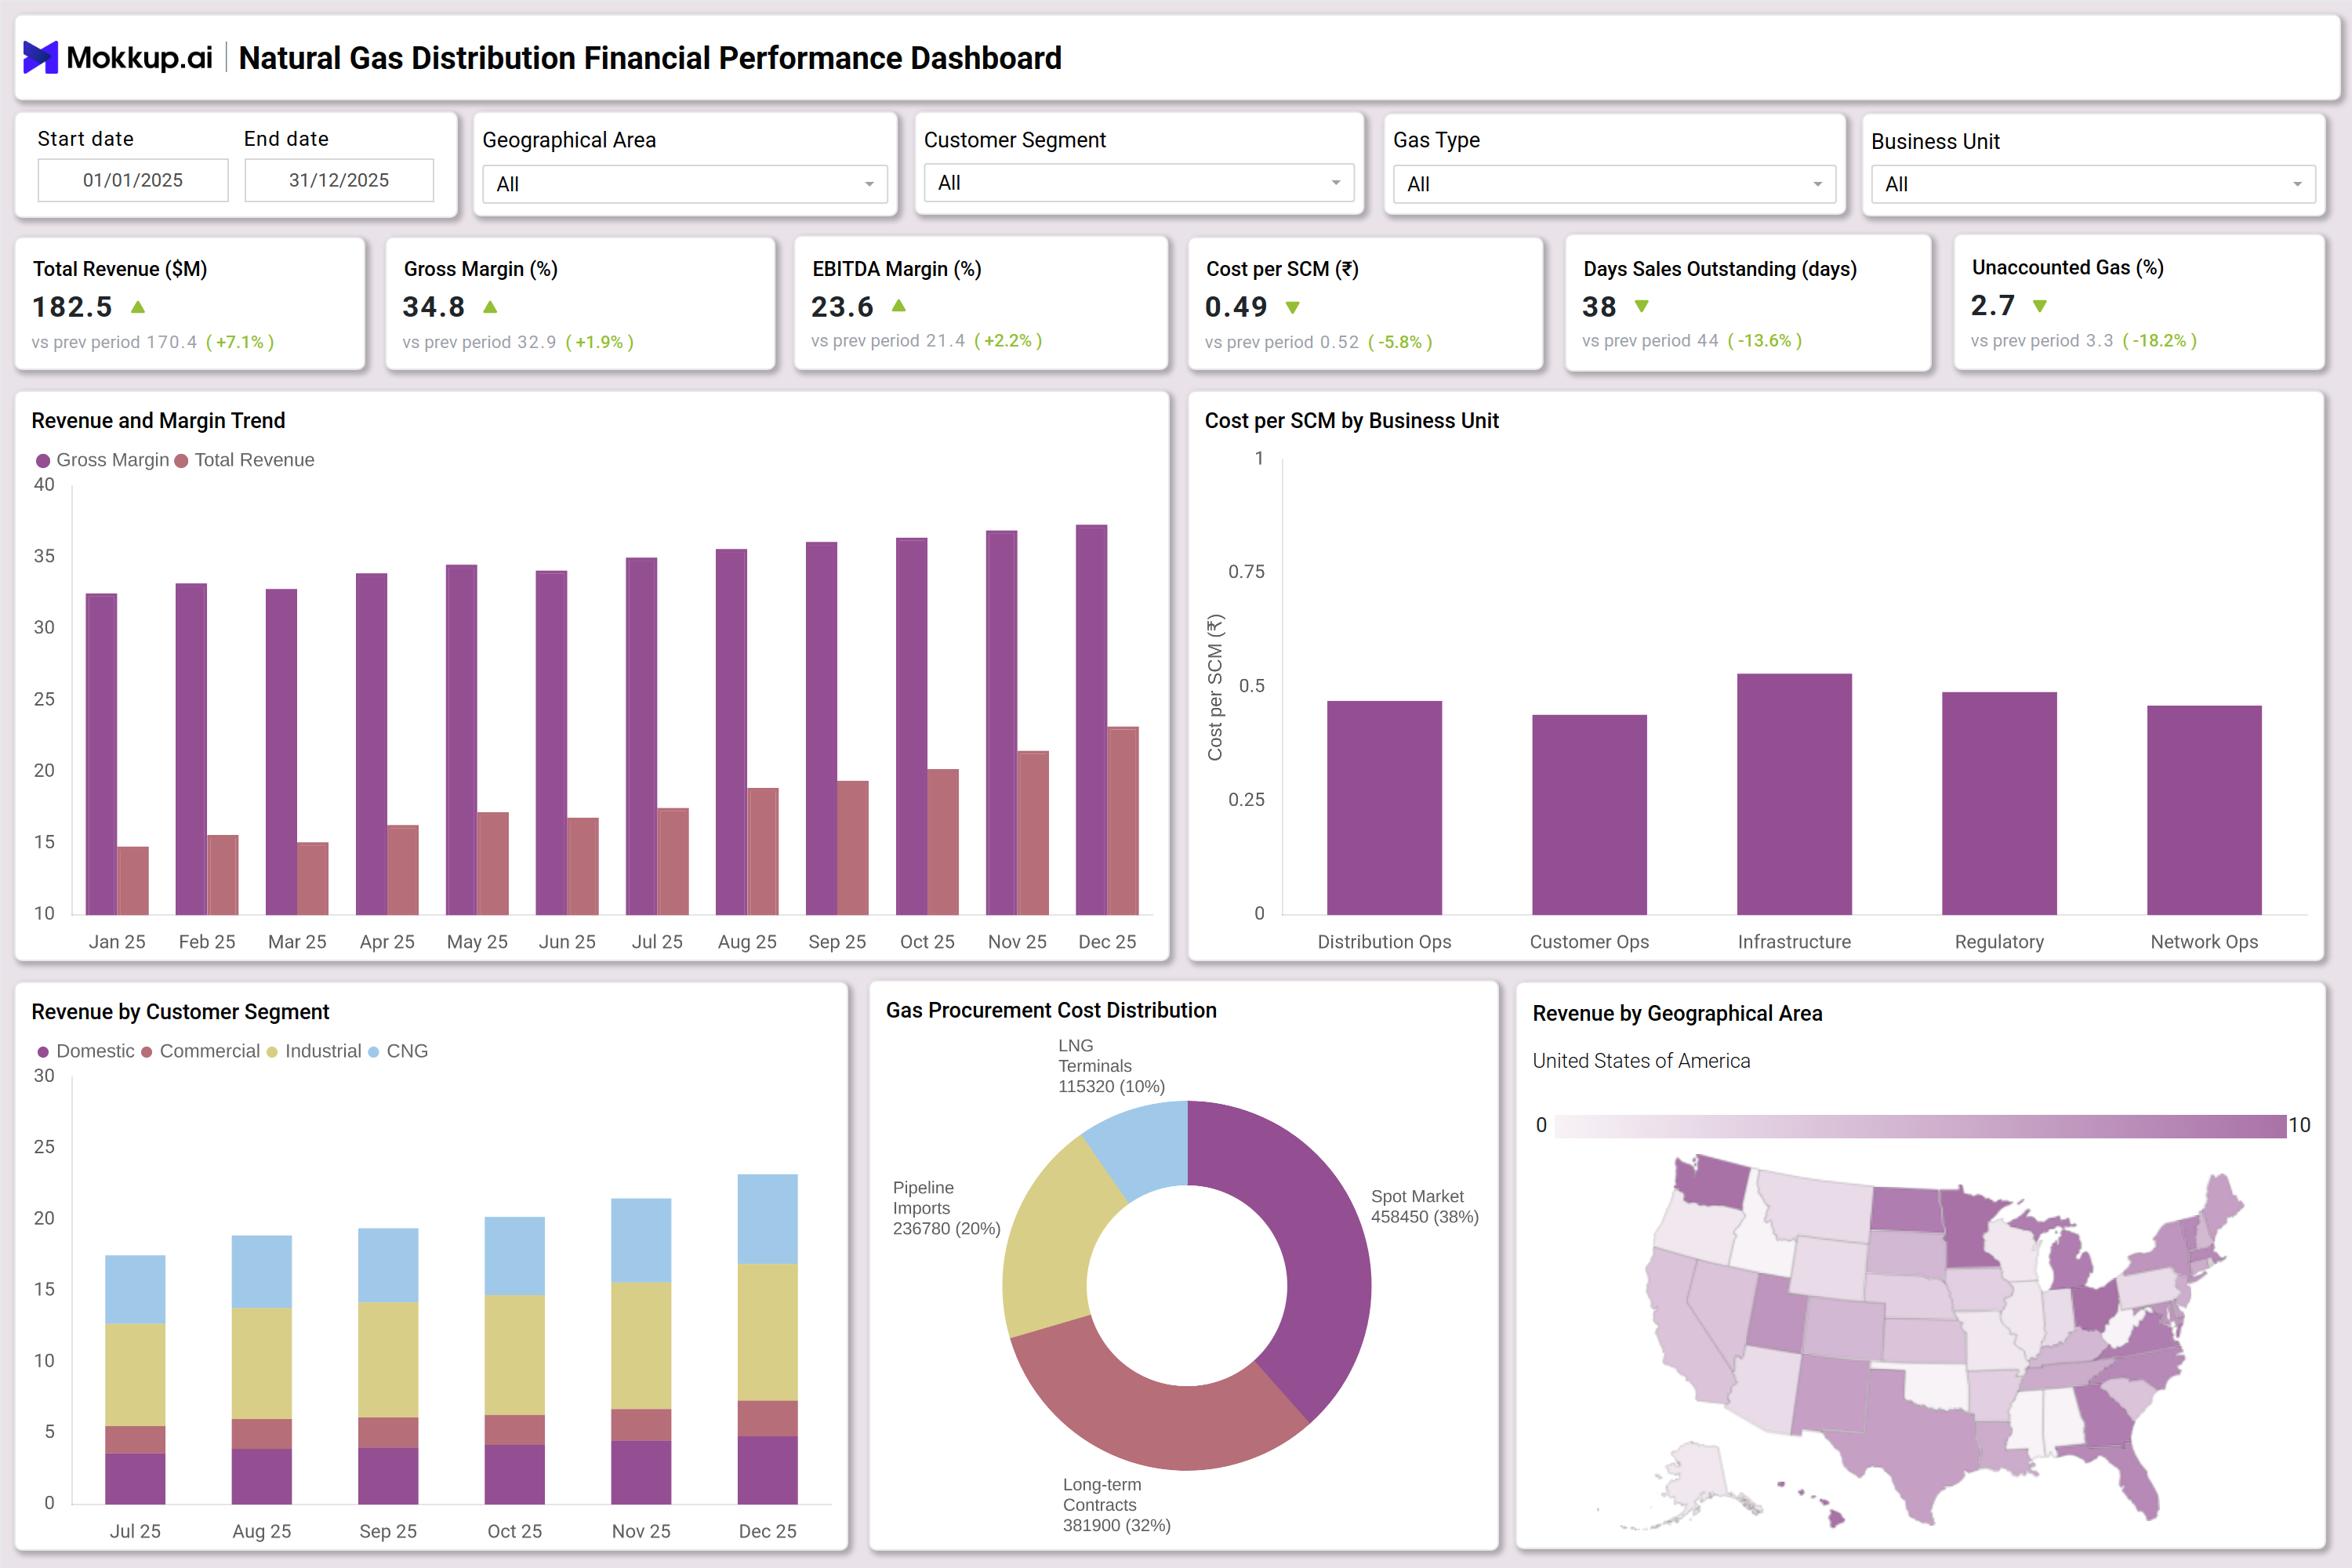
A practical example of a Natural Gas Distribution Financial Performance Dashboard includes multiple performance layers. At the top level, executive KPIs display Total Revenue, Gross Margin, EBITDA Margin, Cost per SCM, Days Sales Outstanding, and Unaccounted Gas percentage. These KPIs form the foundation of a natural gas distribution EBITDA margin tracking dashboard and provide quick visibility into financial health. The dashboard includes a natural gas utilities revenue and margin trend dashboard that tracks monthly revenue growth and margin expansion. Cost analysis is segmented by business unit such as Distribution Operations, Customer Operations, Infrastructure, Regulatory, and Network Operations. This supports detailed cost monitoring through a natural gas network operations cost dashboard.
Procurement analytics are displayed in a natural gas procurement cost distribution dashboard, showing cost allocation across Spot Market purchases, Long-Term Contracts, Pipeline Imports, and LNG Terminals. Revenue is further segmented by customer category such as Domestic, Commercial, Industrial, and CNG. Geographical insights are delivered through a natural gas utilities geographical revenue analysis dashboard, which maps revenue contribution by region. This structure enables management to analyze performance across territories, customer segments, and supply sources.
How to Analyze Data in a Natural Gas Distribution Financial Performance Dashboard
Here is how you can analyze data from this dashboard:
- Revenue Trend Analysis: Analyze monthly revenue patterns to identify demand fluctuations and seasonality.
- Profitability Assessment: Use EBITDA margin tracking to evaluate profitability after operating costs.
- Distribution Efficiency Monitoring: Track efficiency metrics to identify cost escalation across business units.
- Procurement Cost Analysis: Assess dependency on spot purchases vs long-term contracts.
- Cost Allocation Review: Evaluate network operation costs to detect inefficiencies.
- Loss Monitoring: Track unaccounted gas to reduce leakage and theft risks.
- Receivables Performance Tracking: Analyze Days Sales Outstanding to assess collection efficiency.
- Regional Performance Analysis: Use geographic revenue insights to identify high and low performing areas.
Benefits of Natural Gas Distribution Financial Performance Dashboard
The following are the benefits of using this dashboard:
- Centralized KPI Visibility: Provides a unified financial performance view for executives.
- Proactive Profitability Monitoring: Enables continuous tracking of EBITDA margins.
- Optimized Procurement Decisions: Improves sourcing strategy through cost distribution insights.
- Cost Efficiency Improvement: Identifies operational cost drivers across the network.
- Loss Reduction: Helps monitor and minimize unaccounted gas losses.
- Regional Insight Enablement: Supports territory-level performance analysis.
- Regulatory Reporting Support: Ensures accurate cost and margin reporting.
- Integrated Performance View: Combines financial and operational metrics in one dashboard.
KPIs to Track in Natural Gas Distribution Financial Performance Dashboard
The following key KPIs can be tracked by using this dashboard:
- Total Revenue ($M): Measures overall income generated from gas distribution across customer segments and regions.
- Gross Margin (%): Indicates profitability after deducting direct distribution costs.
- EBITDA Margin (%): Tracks operational profitability before interest, tax, depreciation, and amortization. Core metric in a natural gas distribution EBITDA margin tracking dashboard.
- Cost per SCM: Measures distribution cost efficiency per unit of gas supplied.
- Days Sales Outstanding (DSO): Evaluates receivables performance and working capital efficiency.
- Unaccounted Gas (%): Measures gas losses due to leakage, theft, or measurement error. Managed through a natural gas unaccounted gas monitoring dashboard.
- Procurement Cost Distribution (%): Shows cost allocation across Spot Market, Long-Term Contracts, Pipeline Imports, and LNG Terminals in a natural gas procurement cost distribution dashboard.
- Network Operations Cost: Tracks infrastructure and maintenance expenses within the natural gas network operations cost dashboard.
- Revenue by Customer Segment: Analyzes Domestic, Commercial, Industrial, and CNG contribution.
- Revenue by Geography: Assesses regional performance using a natural gas utilities geographical revenue analysis dashboard.
Frequently Asked Questions
Q1. Why is a Natural Gas Distribution Financial Performance Dashboard important for utilities?
It provides structured financial and operational visibility, helping utilities improve margin control and cost management.
Q2. How does the dashboard improve EBITDA monitoring?
It includes a natural gas distribution EBITDA margin tracking dashboard to evaluate operational profitability trends.
Q3. What is the role of procurement analytics in this dashboard?
The natural gas procurement cost distribution dashboard helps optimize sourcing strategy and reduce exposure to volatile spot prices.
Q4. How can utilities reduce gas losses?
By tracking performance in a natural gas unaccounted gas monitoring dashboard and identifying leakage or measurement gaps.
Q5. Does the dashboard support regional performance tracking?
Yes. The natural gas utilities geographical revenue analysis dashboard enables territory level revenue analysis.